Kriging interpolation method for laser induced breakdown spectroscopy (LIBS) analysis of Zn in various soils
Ki-Rak
Kim
,
Gibaek
Kim
,
Ju-Yong
Kim
,
Kihong
Park
and
Kyoung-Woong
Kim
*
School of Environmental Science and Engineering, Gwangju Institute of Science and Technology (GIST), Gwangju 500-712, Republic of Korea. E-mail: kwkim@gist.ac.kr; Fax: +82-62-715-2434; Tel: +82-62-715-2442
First published on 18th September 2013
Abstract
Laser induced breakdown spectroscopy (LIBS) was used to determine Zn concentrations in various types of soils, and discarding and kriging interpolation methods were combined to enhance the accuracy and precision of the LIBS analysis. In order to determine Zn concentrations in 10 field soils, the discarding method was used for pre-treatment of LIBS data acquisition. A remarkable decrease of relative standard deviation was observed indicating a significant increase of pulse-to-pulse precision. Nine artificial soil sets containing different contents of sand, kaolin, and goethite were manufactured for the interpolation database, and they displayed differing LIBS broadband spectra due to their respective sample matrices. In addition, the calibration slope of each soil set varied significantly showing up to a 3.36-fold difference. We found that the matrix effect derived from sand, kaolin, and goethite contents can be determined by detecting major elements in soil (Si, Al, and Fe) from LIBS analysis without additional measurements. The kriging interpolation model was applied using the database obtained from the artificial soil sets. The concentration of Zn in field soils calculated from data treatment methods showed significantly accurate results when compared to ICP-OES analysis results. By minimizing factors affecting the LIBS result, heavy metal concentrations in various types of soils can be determined using a developed database without calibration.
Introduction
Over recent years heavy metals have been acknowledged as an important pollutant group and measurements of heavy metal contaminations have emerged as a serious environmental issue.1,2 An excessive amount of hazardous heavy metals within an ecosystem is particularly dangerous because they are easily transferred and accumulate in living organisms throughout the food chain. Numerous studies have reported the effects of heavy metals on human health particularly on the liver, kidney, brain, skin, and nervous system.3–5 Therefore, heavy metal monitoring and remediation techniques within environmental media are important with efforts to measure and control toxic elements. As heavy metals are strongly adsorbed and remain in soil for a long time, concentrations are generally higher within soil than within water or air.2,6 Therefore, quantitative analysis of heavy metals in soil has received attention in environmental engineering and soil science fields. Atomic absorption spectroscopy (AAS) and inductively coupled plasma emission spectroscopy (ICP) are procedures typically employed for chemical analysis after acidic digestion of soil samples. However, these procedures require costly equipment, trained operators, and complicated sample pre-treatment processes. In order to avoid the disadvantages of conventional techniques, X-ray fluorescence (XRF) analysis, scanning electron microscopy-energy dispersive spectrometry (SEM-EDS), and electron probe X-ray microanalysis (EPMA) have been used as alternative methods for qualitative or semi-quantitative elemental analysis. Although suitable for solid samples, there are disadvantages of using these alternatives such as their relatively low levels of sensitivity, precision, and distinction.Laser induced breakdown spectroscopy (LIBS) is an atomic emission spectroscopy technique based on spectral analysis that is used to gain qualitative and quantitative information on the composition of elements in various media.7 In this technique a laser pulse is focused precisely onto the surface of a target sample, ablating a certain amount of sample to create plasma. The spectrum is collected by plotting intensity versus wavelength from light emissions generated from atomic, ionic, and molecular fragments. Due to the instrumental features of LIBS advanced analysis can be achieved, including non-preparative sample treatment, real-time analysis, in situ field application, and remote detection of hazardous materials.8,9 LIBS is used in a variety of applications including heavy metal analysis in different types of solids,10–12 liquids,13–15 gases,16–18 and biological materials.19–21 In particular, LIBS has been used for space exploration, installed on landers and rovers, including the Mars rover Curiosity in 2012, to analyse the geological samples on the planetary surface.22–26
Nevertheless, quantitative analysis of heavy metals in soil remains complicated because LIBS is easily affected by a broad range of factors including laser properties (laser pulse energy, laser pulse power, and repetition rate), detector parameters (detector gain and linearity of response), sampling geometries (lens-to-sample distance, optical path transmission, and atmosphere above the sample), and sample properties (uniformity of sample composition and surface, physical/chemical matrix effect).7,27–30 The development of hardware and analytical methods has been accomplished by minimizing these factors and has successfully enhanced the accuracy, precision, and detection limit of measurements using LIBS. Many studies have revealed that instrumental development such as the application of a double pulse laser,31,32 a combination with other equipment,21,33–36 and enhanced detector system including an Echelle spectrometer and intensified charge-coupled device (ICCD)37–40 has significantly increased the performance of LIBS. Furthermore, analytical methods can be employed to avoid the uncertainty of LIBS results after data acquisition. Normalization methods have been used for primary data interpretation to compensate for the matrix effect by reducing self-absorption and pulse-to-pulse variation, and therefore the correlation coefficients of calibration were increased.29,31,41 In addition, Ciucci et al.42 developed an algorithm for calibration-free LIBS (CF-LIBS) using a local thermodynamic equilibrium (LTE) approximation, and many applications have been studied.32,43,44 Another promising method for LIBS data analysis is multivariate analysis (MVA) which is a chemometric approach to analyse complex systems including principal components analysis (PCA) and partial least squares (PLS) regression for quantitative calibration.11,36,45,46
Since the determination of soil-sourced heavy metals using LIBS analysis is not as accurate as chemical extraction methods, more research is needed on equipment and data analysis methods to minimize the sample matrix effect on LIBS results. In this study, the soil matrix effect was investigated by using sample sets containing different main components found in typical soils such as sand, kaolin, and goethite. Sand is the most abundant component of soil and has the chemical formula SiO2. Kaolin is a typical clay mineral and is an important factor for heavy metal transport. The chemical composition of kaolin is Al2Si2O4(OH)4, and it is the major source of Al in soil. Goethite (FeO(OH)) is the most common iron oxide. The 3 major elements in soil (Si, Al, and Fe with the exception of oxygen)47 are considered the main contributors to the matrix effect of LIBS analysis. Therefore, data analysis methods should include factors related to these elements in order to overcome sample matrix effects.
In addition to investigation of the soil matrix effect, kriging interpolation was applied for data analysis. The kriging is an optimal interpolation method based on regression against observed values surrounding the data point which is widely used in geostatistics to calculate field elevation at an unknown location.48 Kriging is achieved by estimating the value at an unknown point using known values at nearby locations. The predicted value, kriging estimator Z(u), is based on the combination of basic linear regressions defined as
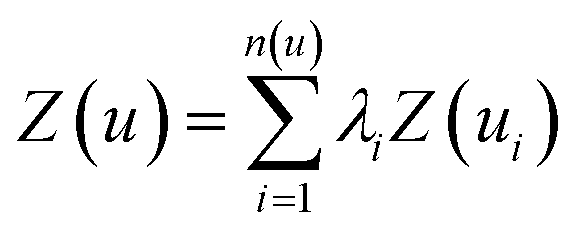 | (1) |
Materials and methods
Materials
The 19 soil samples including artificial soil sets, field soils, and reference soil used in this study are listed in Table 1. In order to examine the effect of soil type on quantitative heavy metal analysis, 9 sets of calibration soils were manufactured by mixing different proportions of sand (Korean standard sand from Jumunjin), kaolin powder (Duksan, Korea), and goethite powder (Aldrich, USA) to simulate the main soil component of sand, clay mineral, and iron oxide, respectively. In each calibration set, 7 different stoichiometric samples were prepared by adding ZnSO4·7H2O (Sigma-Aldrich, USA) into each dried mixture, making the approximate maximum concentration of Zn equal to 4100 mg kg−1. The prepared artificial soil samples were mixed completely and aged for 14 days to ensure sample homogeneity. Field soil in our institute (GIST) was collected as uncontaminated soil. And ZnSO4·7H2O was artificially spiked into the GIST sample to make two samples containing different Zn concentrations (LSP with low spiking and HSP with high spiking). Other soil samples were taken from areas in the vicinity of abandoned mines (SC and CY), from the stream sediment near the mining site (YG), from ground mine waste before refinement (MJ), and from mine tailings (DWT and SDGM). The field soil samples related to mining activity were collected from different mines around Korea, and reference soil (NIST SRM 2710a) was included for quality control. After field soil samples were dried, they were sieved to <74 μm particle size prior to experimentation, while particles of artificial soils were not separated to measure the exact content of sand. All artificial and field soil samples were mixed with 20% (w/w) anhydrous lactose (Fluka, Germany) for coherence of soil particles while making pellets for LIBS analysis. The contents of major elements such as Si, Al, and Fe in 19 soil samples were determined by XRF analysis (PANalytical Axios Minerals, Netherlands). In addition, the concentration of Zn was analysed using a ICP-OES (Perkin Elmer Optima 5300 DV, USA). For ICP-OES analysis, triplicate samples of 0.4 g each were extracted using a mixture of 3 ml HCl and 1 ml HNO3 at 70 °C for 1 h followed by dilution and filtration using a 0.45 μm membrane filter.| Sample | Description | Sourcesa (%) (S + K + G) | Contentsb | ||
|---|---|---|---|---|---|
| Si (%) | Al (%) | Fe (%) | |||
| a S: sand, K: kaolin, G: goethite. b Obtained from an X-ray fluorescence spectrometer (XRF). c The XRF data follow the GIST sample. | |||||
| Set 1 | Calibration set | 100 + 0 + 0 | 28.48 | 3.66 | 0.64 |
| Set 2 | Calibration set | 80 + 20 + 0 | 37.20 | 6.57 | 0.24 |
| Set 3 | Calibration set | 60 + 40 + 0 | 38.06 | 7.27 | 0.16 |
| Set 4 | Calibration set | 85 + 0 + 15 | 21.45 | 4.63 | 19.26 |
| Set 5 | Calibration set | 65 + 20 + 15 | 28.23 | 6.20 | 10.33 |
| Set 6 | Calibration set | 45 + 40 + 15 | 33.98 | 7.05 | 6.25 |
| Set 7 | Calibration set | 70 + 0 + 30 | 17.55 | 5.16 | 26.40 |
| Set 8 | Calibration set | 50 + 20 + 30 | 28.66 | 6.31 | 13.13 |
| Set 9 | Calibration set | 30 + 40 + 30 | 30.76 | 6.77 | 10.87 |
| GIST | Uncontaminated soil | — | 28.48 | 12.15 | 4.79 |
| SC | Farmland soil | — | 36.37 | 5.76 | 3.25 |
| CY | Farmland soil | — | 29.03 | 10.86 | 4.86 |
| LSPc | Spiked soil | — | 28.48 | 12.15 | 4.79 |
| HSPc | Spiked soil | — | 28.48 | 12.15 | 4.79 |
| YG | Stream sediment | — | 26.44 | 12.14 | 5.31 |
| MJ | Mine waste | — | 27.88 | 7.76 | 8.57 |
| DWT | Mine tailings | — | 22.84 | 7.55 | 7.51 |
| SDGM | Mine tailings | — | 35.55 | 4.98 | 3.46 |
| SRM | Reference soil | — | 30.36 | 7.06 | 4.45 |
Instrumentation
The LIBS analysis system used in the experiment is described in Scheme 1. The system contains a Q-switched Nd:YAG laser, a spectrometer with CCD modules, and a sample stage in a compact chamber. The New Wave Research laser (Polaris III model) delivers 4–5 nm width laser pulses at a fundamental wavelength of 1064 nm in a 4 mm diameter beam. In this study, we operated this system at a maximum pulse energy (90 mJ) and 2 Hz repetition rate. The laser pulse was focused on the surface of the pellet sample using a quartz lens of 9 cm focal length. The plasma spark from the light emission was collected by a 7.5 cm focal plano-convex lens and the obtained image was recorded 1 μs after plasma generation using a spectrometer (Applied Spectra, model Aurora LIBS) via an optical fibre bundle. The spectroscopic system contains a 4 channel CCD providing broadband spectra in the range of 190–588 nm with 0.09 nm spectral resolution. A soil sample was pressed into a pellet and mounted on a rotation stage operated at 2 revolutions per minute to avoid the crater effect. A total of 100 spectrum acquisitions were recorded in ambient conditions.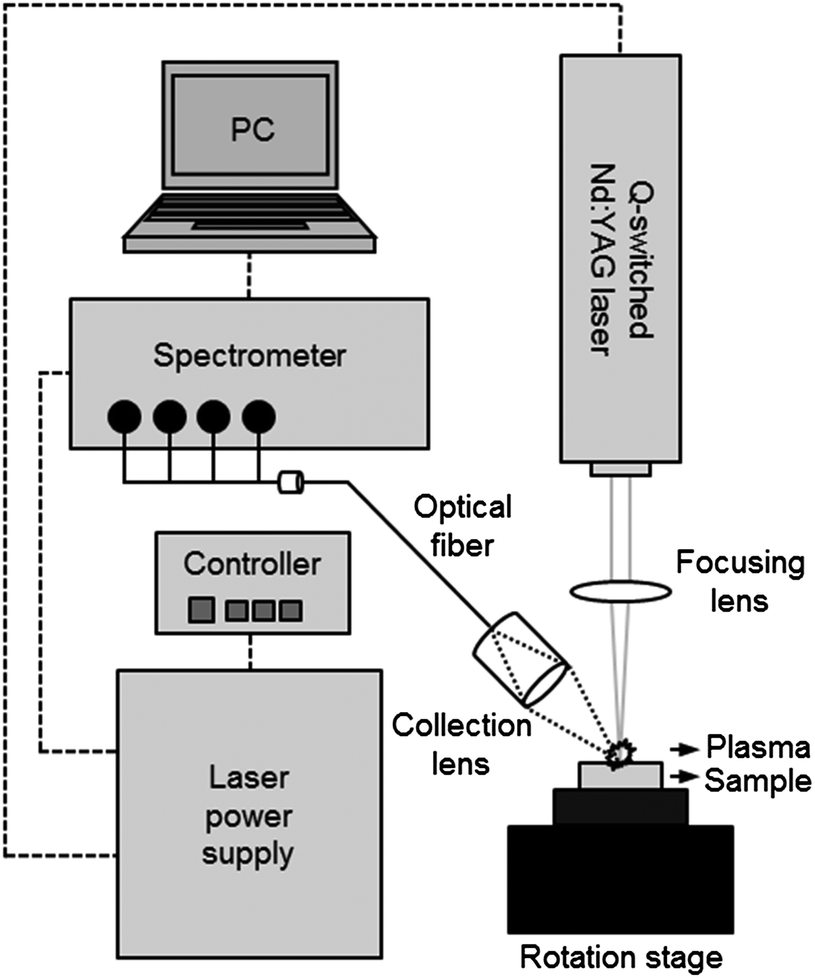 | ||
| Scheme 1 LIBS analysis system. | ||
Data analysis
The data obtained from LIBS were analysed by using various data processing methods to increase the accuracy and precision of pulse-to-pulse repetition and sample-to-sample deviation. The expansion of effective methods from previous research studies53–56 was conducted by adding analytical conditions to discarding and normalization methods, and a new approach to data processing was suggested and investigated in this study. In this study, discarding methods were conducted as the first step in data analysis by deleting the highest and the lowest 10% of the total data from 100 peak areas in one soil sample, and 80 were selected to be analysed. The second method was normalization; the most widely used processing method for LIBS to reduce matrix effects. For this study peak areas of Zn (481.053 nm) were normalized using 4 different methods including signal to noise ratio (SNR), signal to background ratio (SBR), carbon normalization (SCR), and full spectrum normalization (SFR). The term “noise” in this method indicates a peak area from the wavelength of a target element below the line between each side of the baseline (480.884 and 481.179 nm). The background peak area was integrated at the end of the spectrum wavelength range (582–583 nm) where only continuum emission was observed without any elemental spectral signal. The peak areas of carbon at the elemental peak of 193.091 nm and the full spectrum range of data acquisition (190–588 nm) were also integrated for additional normalization methods. The last analysis method suggested in this study is interpolation from 9 different calibration databases. The 9 calibration sets described in the previous section were analysed using LIBS and ICP-OES for database construction. The database includes the LIBS peak areas of Zn and major soil elements in addition to the Zn concentration from ICP-OES analysis. Concentrations of Zn in unknown soil samples (field soils and reference soil) were established using the kriging interpolation model based on the constructed database. At first, peak areas of a single soil component element (Si, Al, or Fe) and Zn were employed in the vectors (ui) of eqn (1) to determine Zn concentrations (Z(u)) in unknown field soils. The spectral lines of Si (288.157 nm), Al (396.152 nm), and Fe (274.648 nm) were selected to calculate peak areas of soil component elements in this study. Furthermore, the interpolation using 4 different multiplication sums (Si × Al, Si/Fe, Al/Fe, and Si × Al/Fe) of soil component combinations was also employed in the vectors (ui) to examine the matrix effect on LIBS resulting from more than one major element in soil.Results and discussion
Data pre-treatment
The LIBS spectra for 4 artificial soil samples from 9 calibration sets are displayed in Fig. 1. The compositions of selected samples were as follows: sand (set 1); a mixture of sand and kaolin (set 3); a mixture of sand and goethite (set 7); and a mixture of sand, kaolin and goethite (set 9). This figure illustrates that each sample has a different broadband spectrum pattern and absolute intensity. The relatively simple spectrum was detected in a sample from calibration set 1 because it only contained the main elemental components of sand (O, Si, and minor impurities) and lactose (C, H, and O). However, the spectra became more complicated after combination with kaolin or goethite, and the absolute intensity increased due to additional elements observed in the spectra, including Al, Fe, and other impurities such as Mg, Ca, and K. These significant differences were contributed by the physical/chemical matrix in soils caused by different compositions (Table 1).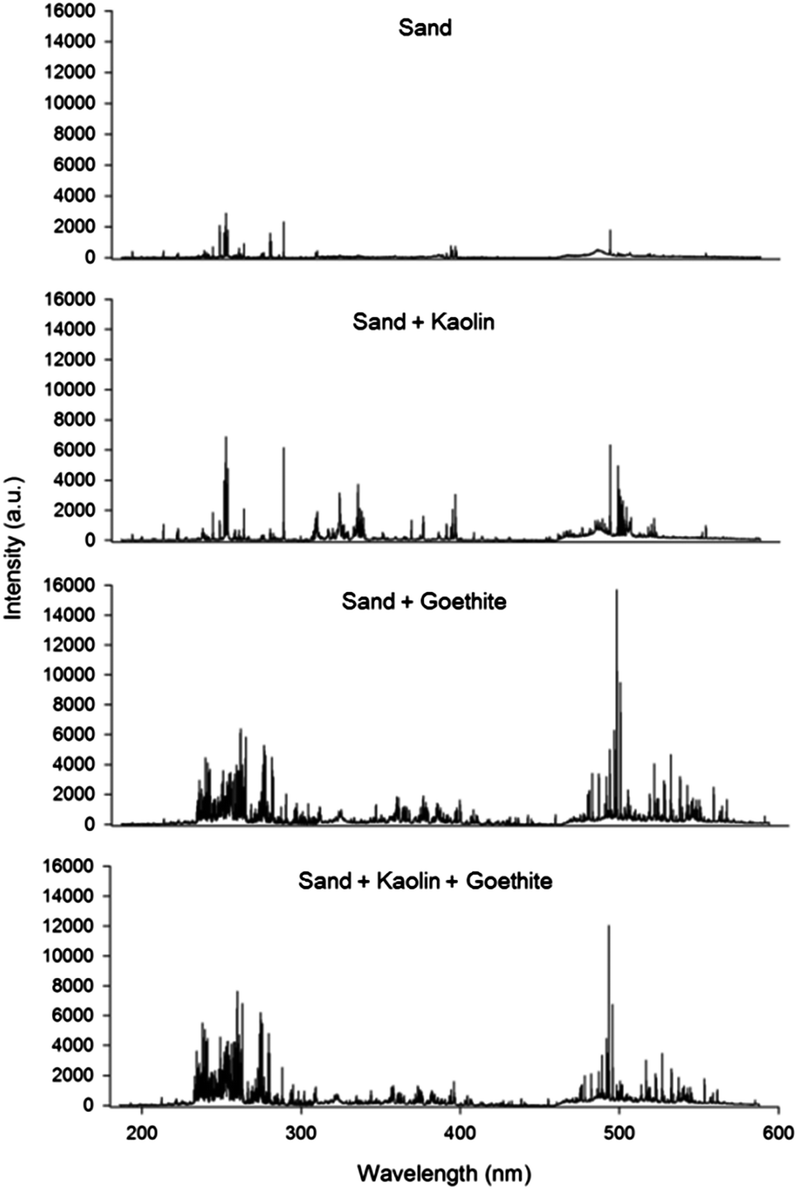 | ||
| Fig. 1 Broadband LIBS spectra for artificial soils containing different soil matrices. | ||
As the LIBS result is largely affected by complicating factors, it is very difficult to measure concentrations of heavy metals in unknown soil samples using a single calibration. Therefore, a data analysis method is required; this minimizes the impact of various factors affecting the quantification of heavy metals in soils. In the pre-treatment of LIBS signal acquisition, the effectiveness of the discarding and normalization methods is displayed in Table 2. Precise measurements of sample-to-sample deviations were obtained from R2 values of calibration lines using 10 field soils, and pulse-to-pulse variations were calculated using the average RSD value of each sample. Due to many unknown factors, a large variation can be detected during laser pulse repetition in a single soil sample. However, the RSD values of Zn showed a sharp decrease after discarding the highest and the lowest 10 LIBS spectra in each sample. Enhanced precision was evident because each side of the total data distribution was removed resulting in a more compact distribution. However, discarding did not improve the R2 values because it only reduces pulse-to-pulse variations without any change of sample-to-sample deviations. Based on previous studies,46,53,57,58 the results of 4 different normalization methods do not show significant increase in any of the normalization methods. Because field soil samples were directly applied for the calibration, the calibrations of Zn display good linear response (R2 values of 0.94) before normalization. In addition, data pre-treatment by the discarding method significantly lowered average RSD values and made great calibrations of field soils. The normalization using SNR showed adverse effects on the results due to self-absorption observed in the high concentration range as shown in Fig. 2.18 Self-absorption leads to a decrease in the peak area of Zn and makes the calibration line non-linear. Therefore, the calibration results of the peak area and three types of normalizations were negatively affected. In particular, self-absorption changes the results of SNR more significantly because the broadened Zn peak directly increases the signal of noise in the range of its baseline along with the decrease of the Zn peak area. Carbon normalization (SCR) was added in this study on the strength of the assumption that the detected carbon peak was mostly due to lactose added as a particle binder. However, the SCR values did not show a significant increase of R2 values indicating that internal standardization using a single element did not display good data treatment. Because of the different broadband spectra of each soil sample (Fig. 1), SFR values present problems regarding precision enhancement application. The similar R2 values were also calculated in the SBR by negative factors to reduce precision as explained above. As normalization did not significantly decrease the affecting factor, an additional method is required to increase the performance of LIBS data processing along with the discarding method. All of the LIBS data for further data analysis were discarded as pre-treatment.
| R 2 | % RSD (average ± standard deviation) | |||
|---|---|---|---|---|
| 100 shots | Discarded 80 shots | 100 shots | Discarded 80 shots | |
| Peak area | 0.94 | 0.94 | 30.57 ± 9.34 | 20.16 ± 7.07 |
| SNR | 0.88 | 0.88 | 34.75 ± 13.90 | 22.80 ± 10.28 |
| SBR | 0.93 | 0.94 | 30.74 ± 10.63 | 20.25 ± 7.60 |
| SCR | 0.93 | 0.94 | 53.61 ± 17.66 | 31.43 ± 8.70 |
| SFR | 0.90 | 0.90 | 38.25 ± 12.15 | 24.91 ± 10.05 |
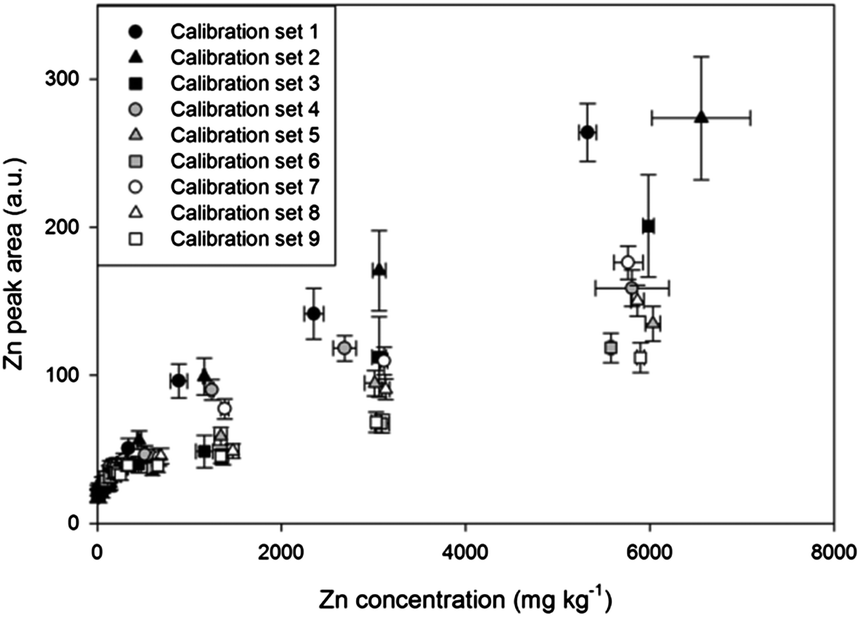 | ||
| Fig. 2 Calibrations of Zn using 9 artificial soil sets with different contents of sand, kaolin, and goethite. | ||
Interpolation database and soil matrix effect
The 9 artificial soil sets were calibrated to establish the effect of soil composition on LIBS results. Fig. 2 and Table 3 display results of 9 Zn calibrations containing different sand, kaolin, and goethite contents. Remarkable differences were found in calibration results with high correlation coefficients (R2 values higher than 0.97 except set 4). The slope of calibration set 1 was 3.36 times higher than that of calibration set 9, indicating that physical/chemical properties such as sample matrix, colour, and particle size all significantly affected the results. These results were based on the fact that sand particles are coarser than kaolin and goethite, and the colour of goethite is dark brown while pure sand and kaolin are white. The calibration slopes appeared to be increased as represented by circles, triangles, and square symbols due to the variance of particle size, porosity and mineral phase from different soil components.30,59 In addition, lower slopes were detected by increasing goethite contents in the sample matrix (order of closed, grey, and white symbols) with the expected factor of sample colour and matrix.| Sample set | Regression equation | R 2 |
|---|---|---|
| Set 1 | Peak are = 0.0450 × concentration + 30.89 | 0.98 |
| Set 2 | Peak are = 0.0392 × concentration + 30.42 | 0.97 |
| Set 3 | Peak are = 0.0302 × concentration + 19.53 | 0.99 |
| Set 4 | Peak are = 0.0228 × concentration + 38.78 | 0.92 |
| Set 5 | Peak are = 0.0176 × concentration + 33.10 | 0.99 |
| Set 6 | Peak are = 0.0153 × concentration + 27.79 | 0.98 |
| Set 7 | Peak are = 0.0245 × concentration + 34.90 | 0.99 |
| Set 8 | Peak are = 0.0197 × concentration + 31.08 | 0.98 |
| Set 9 | Peak are = 0.0134 × concentration + 30.70 | 0.99 |
The matrix effect from major elements in soil (Si, Al, and Fe) on the LIBS results was obtained by plotting slopes of Zn calibrations with regard to the contents of these elements measured by XRF analysis. Fig. 3 displays Zn calibration slopes largely affected by the content of all major elements in the soil. Initially, the slopes of calibration sets without goethite (grey circle symbols) were considerably higher than those of calibration sets containing goethite (closed square symbols) in all 3 correlations. In addition, Fig. 3(A) and (B) exhibit significant negative effects of Si and Al contents on calibration slopes; however in Fig. 3(C) a positive correlation between Fe contents and calibration slopes is detected. It is shown in this figure that high Si and Al and low Fe contents in soils tend to decrease the LIBS signal by changing the sample matrices described above. The considerable linear correlations between the concentrations of these elements and calibration slopes suggest that the detection of elements, instead of soil components, provides the capability to establish a difference in calibration. Because the major elements are easily detected by LIBS analysis, an interpolation method using a 9 calibration elemental database can be applied without further instrumental analysis.
 | ||
| Fig. 3 Relationships between (A) Si, (B) Al, and (C) Fe contents in soils and slopes of 9 Zn calibrations. | ||
Application of the kriging interpolation method
In order to investigate the soil matrix effect generated from major elements on LIBS data, various interpolation databases were constructed. Fig. 4 shows the mesh plots of interpolation databases by applying single elements (Si, Al, or Fe), multiplication of two elements (Si × Al, Si/Fe, or Al/Fe), and multiplication of three elements (Si × Al/Fe) in 9 calibration sets. Unlike the other two elements, Fe was applied in the multiplication as a division form because the correlation between Fe and calibration slope was different to that for Si and Al. This figure visually provides the database of each kriging interpolation method. When LIBS data were obtained from an unknown sample, the peak areas of soil major elements (Si, Al, and Fe) and target element (Zn) were discarded and applied in the constructed interpolation database. Then the Zn concentration value on the mesh regarding two peak areas was calculated using eqn (1). While the range of approximate input concentrations of Zn was between 0 and 5000 mg kg−1, estimated Zn concentrations were observed from negative values up to 15![[thin space (1/6-em)]](https://www.rsc.org/images/entities/char_2009.gif) 000 mg kg−1. As these values appeared at the outside of the input concentration range, the kriging interpolation could be used in the extended range from input data but should be used with more care for accurate estimation.
000 mg kg−1. As these values appeared at the outside of the input concentration range, the kriging interpolation could be used in the extended range from input data but should be used with more care for accurate estimation.
 | ||
| Fig. 4 Interpolation database employing single elements, multiplication of two elements, and multiplication of three elements using Si, Al, and Fe. | ||
The concentrations of Zn in 10 field soils were calculated by simple calibration and various interpolations. The calculated Zn concentration values of each sample are plotted on the vertical axis of Fig. 5, and the horizontal axis presents concentrations measured by ICP-OES analysis. The solid line indicates the same concentration value from LIBS and ICP-OES results. At first, a single element was applied in the location vectors of kriging interpolation in Fig. 5(A). Enhanced correlations were observed compared to that from the calibration result. The R2 values from interpolation with Si and Al were significantly increased from 0.94 to 0.98 and 0.99, respectively, and that from Fe interpolation showed a similar value as with calibration. The enhanced sample-to-sample variation of the unknown sample indicated that the effects of soil matrix and other factors were reduced. However, calculated concentrations were overestimated and appeared above the solid line. The difference between interpolation and ICP-OES analysis was high in the order of Fe, Al, and Si (slopes of 1.33, 1.19, and 1.12, respectively). Because only one element was applied to the interpolation, other affecting factors could have led to these unexpected overestimations. On the other hand, the differences in Zn concentration between two analytical methods were improved by employing two elements as shown in Fig. 5(B). The correlation slopes of two analyses were reduced to 1.17, 0.95, and 1.04 by applying Si × Al, Si/Fe, and Al/Fe, respectively. Because of including an additional elemental factor in the interpolation database, part of the LIBS signal in the overestimated sample was reduced closer to ICP-OES concentrations especially interpolation with Si/Fe and Al/Fe. The interpolation with Si × Al showed similar results to single interpolation results as two similar single interpolation results were combined. Although the correlation slopes were increased, sharp decreases of sample-to-sample variation were observed due to the broader distribution of each sample from the solid line. Because physical/chemical properties of each sample affect LIBS analysis in different ways according to the major element, the combination of affecting factors could lead to unexpected data processing results for certain unknown soil samples. Therefore, the R2 values were significantly reduced for Si/Fe and Al/Fe interpolation to 0.74 and 0.61, respectively. In order to resolve these problems, LIBS data were analysed by applying the Si × Al/Fe multiplication for the interpolation method, and plotted in the same figure with calibration results in Fig. 5(C). The concentrations of Zn in most soil samples displayed great correlation with ICP-OES results derived from LIBS analysis and two data processing methods. The concentrations were distributed over a narrow range from solid lines satisfying both high accuracy (a correlation slope of 1.01) and precision (R2 value of 0.97). It indicates that the negative aspects shown in previous interpolations were minimized and calculated Zn concentrations in most of the field soils were close to ICP-OES concentrations. Furthermore, interpolated Zn concentrations showed a more accurate result compared to calibrated concentration. The quality of calibration, conventional method of quantitative elemental analysis, should be reasonable for Zn detection due to the use of same samples for calibration and application. However, several samples were affected by factors for LIBS analysis causing unexpected overestimation or underestimation of the Zn signal. However, by using kriging interpolation instead of calibration, factors affecting the LIBS result were successfully corrected.
 | ||
| Fig. 5 Comparison of Zn concentrations in field soils calculated by calibration and various interpolations using (A) Si, Al, and Fe, (B) Si × Al, Si/Fe, and Al/Fe, and (C) Si × Al/Fe. | ||
The measured Zn concentrations in 10 field soils are listed in Table 4 by using ICP-OES analysis and LIBS analysis along with the most successful interpolation. In addition, the interpolations by using the average of discarded 80 peak areas and individual 100 peak areas are compared. As a result of 2 types of interpolations, most of Zn concentrations showed similar values indicating that the use of the averaged peak area was reasonable as an interpolation source. In the interpolation result using the individual peak area, the standard deviations among 100 measurements were extremely high in some field soils because the errors from factors affecting LIBS were increased significantly on applying the non-discarded peak area to the calculation of interpolation. The Zn concentration detected by ICP-OES and LIBS analysis also showed good agreement especially for samples containing high Zn concentration (e.g., DWT and SRM).
| Sample | ICP-OESa (triplicate) | Interpolationb (averaged peak area) | Interpolation (individual peak area) |
|---|---|---|---|
| a Average values shown on the horizontal axis of Fig. 5. b Shown on the vertical axis of Fig. 5(C). | |||
| GIST | 31.46 ± 1.45 | 15.16 | 20.92 ± 199.66 |
| SC | 479.63 ± 15.70 | 351.94 | 359.05 ± 185.65 |
| CY | 94.14 ± 1.44 | 41.29 | 30.40 ± 181.7 |
| LSP | 499.75 ± 5.98 | 11.22 | 390.51 ± 501.76 |
| HSP | 1512.66 ± 41.58 | 1981.36 | 2167.62 ± 859.67 |
| YG | 346.30 ± 6.88 | 213.53 | 226.52 ± 461.22 |
| MJ | 1048.79 ± 8.94 | 880.95 | 1175.70 ± 707.64 |
| DWT | 4133.68 ± 37.67 | 4115.97 | 4147.59 ± 564.98 |
| SDGM | 766.18 ± 8.39 | 670.98 | 655.83 ± 135.67 |
| SRM | 3535.55 ± 72.20 | 3639.56 | 3860.54 ± 331.43 |
These significant improvements suggest that a certain number of factors affecting LIBS analysis can be reduced by the combination of discarding and interpolation methods. Although large variations in calibration results were detected in 9 calibrations without considering relevant factors (e.g., colour, particle size, and sample matrix), these data were successfully used to build up the database for kriging interpolation. Our results could not reveal the mechanism by which factors affected the LIBS signal, but accuracy and precision were significantly improved using suggested data analysis methods. As a result, kriging interpolation can be applied to detect and determine heavy metals in a wide variety of soil samples such as uncontaminated soil, farmland soil, spiked soil, stream sediment, mine tailings, and reference soil. In addition, the quantitative analysis of heavy metals in unknown soil samples can be achieved using a constructed database without calibration.
Conclusions
In order to enhance the performance of LIBS analysis, concentrations of Zn in various types of soil samples were investigated using the data processing methods of discarding and kriging interpolation. The broadband spectra and the calibration slope of Zn in each soil sample showed remarkable differences in relation to main soil components, resulting in errors in accuracy and precision of quantitative analysis. It was found that the matrix effects derived from soil components can be determined by measuring the contents of major elements in soil (Si, Al, and Fe) and showed good correlations with the calibration slope of Zn. By minimizing the factors affecting LIBS results, the discarding method decreased the precision of pulse-to-pulse variation and the interpolation methods improved the sample-to-sample precision and accuracy of Zn concentration compared to ICP-OES analysis. Our results suggest that the LIBS technique along with the suggested data analysis methods can be a good alternative for quantitative heavy metal analysis in soils. The soil matrix effect can be minimized using the interpolation database instead of calibration, and the heavy metal analysis can be performed for various types of field soil samples including stream sediment or mine tailings. It is expected that the suggested data analysis method with high performance and convenience could be applied in the environmental monitoring field for the determination of hazardous elements in soil.Further work should focus on the use of additional elements for the interpolation database as soil components. In unusual cases soil could contain high concentrations of Ca, K, Na or other minor elemental compositions. It is expected that the accuracy of the LIBS measurement can be increased by including more factors in the database. In addition, the application of kriging interpolation can be extended to many different types of field soils.
Acknowledgements
This work was supported by the Korea Ministry of Environment as “The GAIA project” (no. G111-17002-0002-0) and the Gwangju Institute of Science and Technology (Ecological restoration for earth environment).References
- J. O. Nriagu and J. M. Pacyna, Nature, 1988, 333, 134–139 CrossRef CAS PubMed.
- D. C. Adriano, Trace elements in terrestrial environments: Biogeochemistry, bioavailability, and risks of metals, Springer-Verlag, New York, 2001 Search PubMed.
- L. M. Gaetke and C. K. Chow, Toxicology, 2003, 189, 147–163 CrossRef CAS.
- D. R. Juberg, C. F. Kleiman and S. C. Kwon, Ecotoxicol. Environ. Saf., 1997, 38, 162–180 CrossRef CAS PubMed.
- C. T. Walsh, H. H. Sandstead, A. S. Prasad, P. M. Newberne and P. J. Fraker, Environ. Health Perspect., 1994, 102, 5–46 CAS.
- B. J. Alloway, Heavy metals in soils, Blackie, Glasgow & London/Wiley, New York, 1990 Search PubMed.
- D. A. Cremers and L. J. Radziemski, Handbook of Laser-Induced Breakdown Spectroscopy, John Wiley & Sons, Ltd, Chichester, 2006 Search PubMed.
- R. E. Russo, T. W. Suen, A. A. Bol'shakov, J. Yoo, O. Sorkhabi, X. Mao, J. Gonzalez, D. Oropeza and V. Zorba, J. Anal. At. Spectrom., 2011, 26, 1596–1603 RSC.
- J. D. Winefordner, I. B. Gornushkin, T. Correll, E. Gibb, B. W. Smith and N. Omenetto, J. Anal. At. Spectrom., 2004, 19, 1061–1083 RSC.
- F. Capitelli, F. Colao, M. R. Provenzano, R. Fantoni, G. Brunetti and N. Senesi, Geoderma, 2002, 106, 45–62 CrossRef CAS.
- M. Z. Martin, N. Labbé, T. G. Rials and S. D. Wullschleger, Spectrochim. Acta, Part B, 2005, 60, 1179–1185 CrossRef PubMed.
- E. C. Ferreira, D. M. B. P. Milori, E. J. Ferreira, L. M. dos Santos, L. Martin-Neto and A. R. d. A. Nogueira, Talanta, 2011, 85, 435–440 CrossRef CAS PubMed.
- F.-Y. Yueh, R. C. Sharma, J. P. Singh, H. Zhang and W. A. Spencer, J. Air Waste Manage. Assoc., 2002, 52, 1307–1315 CAS.
- D. M. Díaz Pace, C. A. D'Angelo, D. Bertuccelli and G. Bertuccelli, Spectrochim. Acta, Part B, 2006, 61, 929–933 CrossRef PubMed.
- P. Fichet, P. Mauchien, J.-F. Wagner and C. Moulin, Anal. Chim. Acta, 2001, 429, 269–278 CrossRef CAS.
- S. G. Buckley, H. A. Johnsen, K. R. Hencken and D. W. Hahn, Waste Manag., 2000, 20, 455–462 CrossRef CAS.
- K. Park, G. Cho and J.-h. Kwak, Aerosol Sci. Technol., 2009, 43, 375–386 CrossRef CAS.
- D. Mukherjee and M.-D. Cheng, J. Anal. At. Spectrom., 2008, 23, 119–128 RSC.
- O. Samek, D. C. S. Beddows, H. H. Telle, G. W. Morris, M. Liska and J. Kaiser, Appl. Phys. A: Mater. Sci. Process., 1999, 69, S179–S182 CAS.
- O. Samek, D. C. S. Beddows, H. H. Telle, J. Kaiser, M. Liška, J. O. Cáceres and A. Gonzáles Ureña, Spectrochim. Acta, Part B, 2001, 56, 865–875 CrossRef.
- M. Abdelhamid, F. J. Fortes, M. A. Harith and J. J. Laserna, J. Anal. At. Spectrom., 2011, 26, 1445–1450 RSC.
- C. Fabre, S. Maurice, A. Cousin, R. C. Wiens, O. Forni, V. Sautter and D. Guillaume, Spectrochim. Acta, Part B, 2011, 66, 280–289 CrossRef CAS PubMed.
- R. Gaudiuso, M. Dell'Aglio, O. D. Pascale, G. S. Senesi and A. D. Giacomo, Sensors, 2010, 10, 7434–7468 CrossRef CAS PubMed.
- A. K. Knight, N. L. Scherbarth, D. A. Cremers and M. J. Ferris, Appl. Spectrosc., 2000, 54, 331–340 CrossRef CAS.
- R. Brennetot, J. L. Lacour, E. Vors, A. Rivoallan, D. Vailhen and S. Maurice, Appl. Spectrosc., 2003, 57, 744–752 CrossRef CAS.
- Z. A. Arp, D. A. Cremers, R. D. Harris, D. M. Oschwald, G. R. Parker Jr and D. M. Wayne, Spectrochim. Acta, Part B, 2004, 59, 987–999 CrossRef PubMed.
- C. Pasquini, J. Cortez, L. M. C. Silva and F. B. Gonzaga, J. Braz. Chem. Soc., 2007, 18, 463–512 CrossRef CAS PubMed.
- R. A. Multari, L. E. Foster, D. A. Cremers and M. J. Ferris, Appl. Spectrosc., 1996, 50, 1483–1499 CrossRef CAS.
- A. S. Eppler, D. A. Cremers, D. D. Hickmott, M. J. Ferris and A. C. Koskelo, Appl. Spectrosc., 1996, 50, 1175–1181 CrossRef CAS.
- D. Michaud, R. Leclerc and É. Proulx, Spectrochim. Acta, Part B, 2007, 62, 1575–1581 CrossRef PubMed.
- J.-h. Kwak, C. Lenth, C. Salb, E.-J. Ko, K.-W. Kim and K. Park, Spectrochim. Acta, Part B, 2009, 64, 1105–1110 CrossRef PubMed.
- M. Corsi, G. Cristoforetti, M. Hidalgo, S. Legnaioli, V. Palleschi, A. Salvetti, E. Tognoni and C. Vallebona, Appl. Geochem., 2006, 21, 748–755 CrossRef CAS PubMed.
- H. Loudyi, K. Rifaï, S. Laville, F. Vidal, M. Chaker and M. Sabsabi, J. Anal. At. Spectrom., 2009, 24, 1421–1428 RSC.
- F. Hilbk-Kortenbruck, R. Noll, P. Wintjens, H. Falk and C. Becker, Spectrochim. Acta, Part B, 2001, 56, 933–945 CrossRef.
- C. Latkoczy and T. Ghislain, J. Anal. At. Spectrom., 2006, 21, 1152–1160 RSC.
- H. A. O. Wang, D. Grolimund, L. R. Van Loon, K. Barmettler, C. N. Borca, B. Aeschlimann and D. Günther, Anal. Chem., 2011, 83, 6259–6266 CrossRef CAS PubMed.
- M. Walid and Y. Tawfik, Opt. Laser Technol., 2008, 40, 30–38 CrossRef PubMed.
- P. Robert, C. Fabre, J. Dubessy, M. Flin and M. C. Boiron, Spectrochim. Acta, Part B, 2008, 63, 1109–1116 CrossRef PubMed.
- M. Sabsabi, R. Héon and L. St-Onge, Spectrochim. Acta, Part B, 2005, 60, 1211–1216 CrossRef PubMed.
- S. R. Goode, S. L. Morgan, R. Hoskins and A. Oxsher, J. Anal. At. Spectrom., 2000, 15, 1133–1138 RSC.
- S. I. Gornushkin, I. B. Gornushkin, J. M. Anzano, B. W. Smith and J. D. Winefordner, Appl. Spectrosc., 2002, 56, 433–436 CrossRef CAS.
- A. Ciucci, M. Corsi, V. Palleschi, S. Rastelli, A. Salvetti and E. Tognoni, Appl. Spectrosc., 1999, 53, 960–964 CrossRef CAS.
- S. Pandhija, N. Rai, A. Rai and S. Thakur, Appl. Phys. B: Lasers Opt., 2010, 98, 231–241 CrossRef CAS.
- P. Yaroshchyk, D. Body, R. J. S. Morrison and B. L. Chadwick, Spectrochim. Acta, Part B, 2006, 61, 200–209 CrossRef PubMed.
- S. M. Clegg, E. Sklute, M. D. Dyar, J. E. Barefield and R. C. Wiens, Spectrochim. Acta, Part B, 2009, 64, 79–88 CrossRef PubMed.
- B. Bousquet, J. B. Sirven and L. Canioni, Spectrochim. Acta, Part B, 2007, 62, 1582–1589 CrossRef PubMed.
- D. L. Sparks, Environmental soil chemistry, Academic Press, 2003 Search PubMed.
- M. A. Oliver and R. Webster, Int. J. Geogr. Inform. Syst., 1990, 4, 313–332 CrossRef.
- P. Goovaerts, Geostatistics for Natural Resources Evaluation, Oxford University Press, New York. 1997 Search PubMed.
- Y.-P. Lin, T.-K. Chang, C.-W. Shih and C.-H. Tseng, Environ. Geol., 2002, 42, 900–909 CrossRef CAS PubMed.
- C. Ou, A. St-Hilaire, T. B. M. J. Ouarda, F. M. Conly, N. Armstrong, B. Khalil and S. Proulx-McInnis, J. Environ. Monit., 2012, 14, 3118–3128 RSC.
- C.-W. Liu, C.-S. Jang and C.-M. Liao, Sci. Total Environ., 2004, 321, 173–188 CrossRef CAS PubMed.
- D. Body and B. L. Chadwick, Spectrochim. Acta, Part B, 2001, 56, 725–736 CrossRef.
- S. Groh, P. K. Diwakar, C. C. Garcia, A. Murtazin, D. W. Hahn and K. Niemax, Anal. Chem., 2010, 82, 2568–2573 CrossRef CAS PubMed.
- J. E. Carranza, K. Iida and D. W. Hahn, Appl. Opt., 2003, 42, 6022–6028 CrossRef CAS.
- B. L. Chadwick and D. Body, Appl. Spectrosc., 2002, 56, 70–74 CrossRef CAS.
- G. S. Senesi, M. Dell'Aglio, R. Gaudiuso, A. De Giacomo, C. Zaccone, O. De Pascale, T. M. Miano and M. Capitelli, Environ. Res., 2009, 109, 413–420 CrossRef CAS PubMed.
- E. C. Ferreira, J. M. Anzano, D. M. B. P. Milori, E. J. Ferreira, R. J. Lasheras, B. Bonilla, B. Montull-Ibor, J. Casas and L. M. Neto, Appl. Spectrosc., 2009, 63, 1081–1088 CrossRef CAS PubMed.
- R. Krasniker, V. Bulatov and I. Schechter, Spectrochim. Acta, Part B, 2001, 56, 609–618 CrossRef.
| This journal is © The Royal Society of Chemistry 2014 |