Chemical halide vaporization as a sample introduction technique for atomic spectroscopy: significance of its kinetic mechanism
A.
Lopez-Molinero
*,
D.
Sipiera
and
J. R.
Castillo
Department of Analytical Chemistry, Faculty of Science, University of Zaragoza, 50009 Zaragoza, Spain
First published on 19th September 2013
Abstract
Chemical vaporization with halides, as a means of sample introduction in atomic spectroscopy, has been discussed taken into account the kinetics of the processes. The studied vaporizations involved those produced by As(III), Ge(IV), Sb(III–V) and Se(IV–VI) with chloride, bromide and fluoride ions. Vaporization was achieved using a systematic procedure: elements were reacted with aqueous halide solutions in concentrated sulphuric acid and were characterized by: the emission peaks in ICP-OES, temperature and molecular absorbance of reacting solutions. This last parameter allowed the kinetics of vaporizations to be determined. According to these results clear differences were observed between the vaporizations. Thus, a first type of halides, formed by Ge(IV)–chloride, Se(IV)–bromide and As(III)–fluoride species, could be identified by their large rate constant, Kv, sensitive determinations by ICP-OES and appearance time in the range of 1–2 min. The second type was characterized by Kv values smaller than 0.2 min−1, a sensitivity decrease with respect to the first group and the appearance time in ICP-OES was longer than 2.0 min. On the other hand, an outstanding behavior was presented by species such of As(III)–chloride, Se(VI)–bromide and Sb(V)–bromide. They were vaporized rapidly and the peaks appeared 1 min after the reaction onset. The optimum reaction conditions were clearly influenced by the halide composition. Thus chloride species were vaporized at medium to high chloride concentrations whereas bromide and fluoride species required low halide concentrations. Vaporizations with a significant analytical potential were evidenced for species formed by Ge(IV) and As(III) with chloride and Sb(V) and Se(VI) with bromide. Also As(III)–fluoride species retained some of these characteristics.
Introduction
Chemical Halide Vaporization (CHaV) can be described as the chemical production of volatile chlorides, bromides and fluorides that are then applied for sample introduction in atomic spectrometry. It can be seen as a particular case of a general procedure of Chemical Vapor Generation (CVG), where hydride generation (HG) is the most known type of method for the generation of volatile compounds.1–3The principal achievements of these procedures based on vapor generation can be summarized as being the high efficiency of sample transport and introduction into spectroscopy sources, the favorable energetic transfer to the analyte, and the use as a technique for pre-concentration, elimination of interferences and speciation. All of these characteristics, including the ability to be directly coupled to atomic or mass spectrometry, result in highly sensitive analytical methods.
CHaV for sample introduction in atomic spectroscopy has been applied in the determination of elements (metals(oids)) of groups IVa, Va and VIa of the periodic table. As, Ge, Sb, Se and Si, have been vaporized by bromide, chloride and fluoride ions. Iodide has been only described to enhance the bromide vaporization of Sb(III).4
Initial work in this field can be attributed to Skogerboe5 who developed a vaporization process based on heating, at high temperature, of the elements in the presence of halides. Followed by transfer of the vapors into microwave induced plasma-optical emission spectroscopy (MIP-OES) or flame-atomic absorption spectroscopy (F-AAS) instruments. This type of thermal process could be considered as being a helping procedure to enhance the vaporization yield. And it can currently be seen in electrically heated atomizers such as the graphite furnace (GF) coupled with AAS.
CHaV represents a different approach for vaporization. It can be defined as being vaporization by means of chemical reactions, that is, the production of halide species which are volatile under reaction conditions. Most volatile halides have been obtained by reactions with concentrated hydrochloric acid (halogen hydracid). So, it was applied to release volatile chlorides of As(III) by Tesfalidet et al.6 These authors determined As(III) by FAAS with a limit of detection of 0.25 μg mL−1. The same procedure was used by Guo et al.7 and Smichowski et al.8 to volatilize GeCl4. These authors determined Ge by Atomic Fluorescence Spectroscopy (AFS) and ICP-OES, with limits of detection of 4.90 ng mL−1 and 3.0 ng mL−1, respectively. Fluoride ions in acidic media are well known, in classical analysis, as a way to volatilize SiF4. However, this straightforward procedure has only been applied in the indirect determination of fluorine by direct current plasma (DCP)-OES.9 These examples represent the great majority of the published cases of CHaV. The principal characteristics of these procedures, such as reaction conditions, interferences and applications, have been reviewed by Smichowski et al.10 and more recently by Wu11et al.
A different and new alternative for CHaV was proposed by our group.12 It could be described as being a systematic procedure where elements could be reacted with halides in concentrated sulfuric acid. The principal characteristics of this method were: the consumption of strong and concentrated mineral acids and the discontinuous injection mode of reagents in the reactor. Consequently, reactions can be carried out in highly acidic conditions which favors covalent reactions and also the release of aqueous dilution heat of concentrated acids. In particular, the use of sulfuric acid favors a sharp temperature increase in the media, because of the high value of the aqueous dilution heat of concentrated sulfuric acid.
The method has been applied to perform vaporizations of different elements with distinct halides. So, Si(IV) was volatilized with fluoride and the gas phase introduced into an ICP-OES instrument for Si determination.13,14 In a similar way, As(III) could be volatilized by fluoride,15 chloride16,17 and bromide,18 and introduced into ICP-OES and/or F-AAS instruments. Also Ge(IV)19 was volatilized by chloride, Sb(III20–V21,22) and Se(IV–VI)23 by bromide and introduced into ICP-OES and/or F-AAS instruments. All of these procedures have been characterized as sensitive determinations, with limits of detection ranging from 0.4 μg mL−1, for As(III) with chloride, to 3 ng mL−1 for Ge(IV) with chloride. This methodology has also made it possible to distinguish between different species such as in the case of Sb(III–V) and Se(IV–VI) with reduced levels of interferences, compared to similar procedures by hydride generation, especially those due to transition metals.24 It should be mentioned that Cr(VI), Ti(IV) and Sn(IV) have been assayed with chloride, but the results were not published.
There has been a sustained interest in research of efficient methods for sample introduction in atomic spectrometry, in particular for CVG. There has been great development on two principal aspects. On the one hand: new types of vaporizations such as, “non-hydride volatilisation”11 which includes those produced with the use of UV radiation, photo-induced CVG,25 cathode glow discharge26 or by microwave irradiation.27 And, on the other hand, fundamental studies of reactions to have a better understanding of the vaporization mechanisms.28,29
In this paper, the basic kinetic characteristic of the principal CHaV produced by reactions in sulfuric acid media are presented and discussed. Kinetic rate constants can be determined in practical analytical conditions. This paper represents the development of a generalization of CHaV that pursues a multiple goal: firstly to derive the mechanisms that drives CHaV; secondly, to justify how experimental factors affect the analytical results; and finally, to search for new methods for the enhancement of the vaporization yield.
Experimental
2.1 Instrumentation and assemblies
A P-400 Perkin Elmer (Shelton, CT, USA) inductively coupled plasma optical emission spectrometer was used. The operating conditions are detailed in Table 1.| ICP-OES instrument | Perkin-Elmer P-400 (Shelton, CT, USA) |
|---|---|
| Torch | Demountable, type Perkin-Elmer |
| Injector tube | Alumina |
| Spectrometer operating conditions | |
| RF/ MHz | 40 |
| Incident Power/kW | 1 |
| Ar (99.995%) flow rates | |
| Outer/L min−1 | 12 |
| Intermediate/L min−1 | 0.6 |
| Observation height (above the load coil)/mm | 15 |
| Wavelength/nm | |
| As | 193.682 |
| Ge | 209.429 |
| Sb | 217.581 |
| Se | 196.026 |
| OH | 306.360 |
Molecular Absorbance Spectrophometric measurements (MAS) were carried out using a Hewlett-Packard HP 8452A diode-array spectrophotometer (Palo Alto, California, USA) equipped with a 1 cm path-length quartz cell and connected to an HP Vectra CS. It was a single-beam UV-vis spectrophotometer with a photodiode array detector in the range 190–900 nm, with 2 nm resolution and reading with cycles of less than 0.5 s per cycle. Absorbance measurements were carried out vs. reagent blank, which included all of the reagents but no analyte.
Temperature was measured using a calibrated thermocouple type K (0.5 mm diameter × 105 mm, range 0–1500 °C) (Labfacility, Teddington, UK) was connected by an Analog/Digital (A/D) converter to a microcomputer.
The set-up for the discontinuous generation of volatile halides is an adaptation of previous assemblies. Fig. 1a describes the components of the ICP-OES assembly while Fig. 1b describes the configuration for MAS measurements.
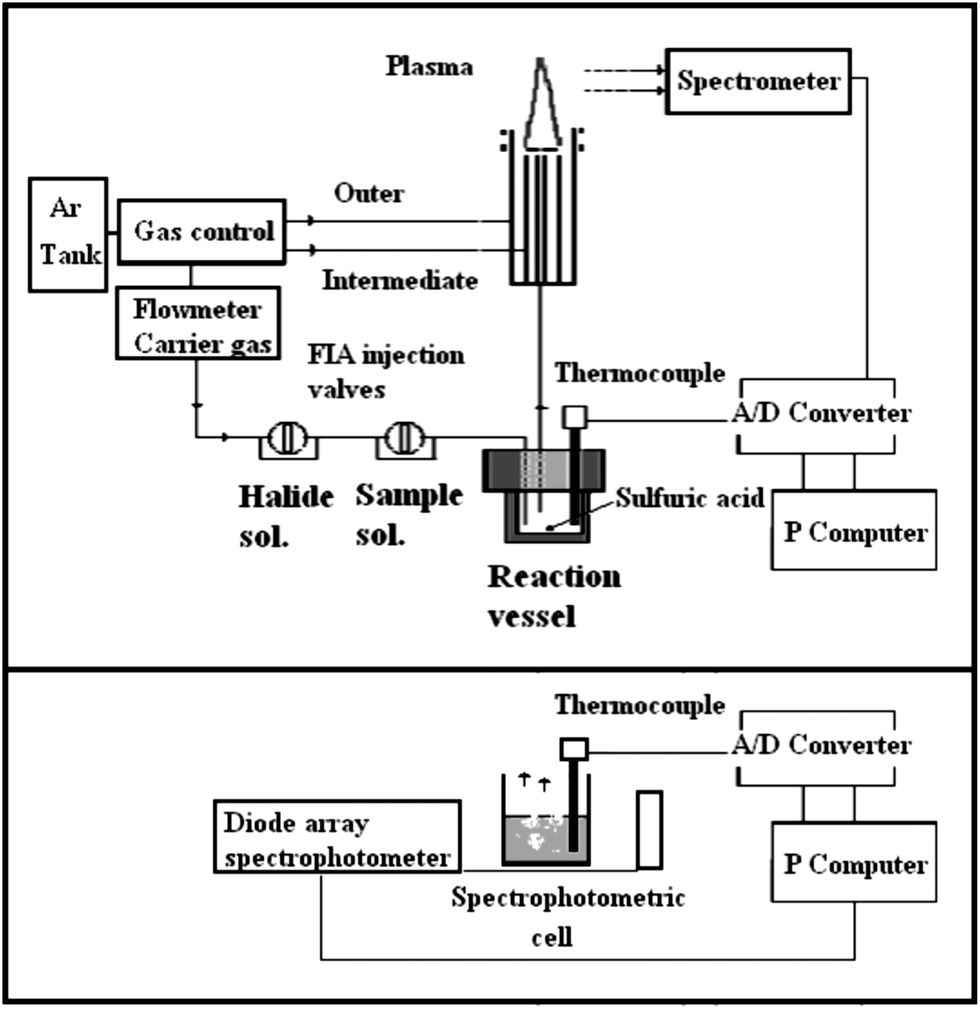 | ||
| Fig. 1 Schematic diagram of the experimental set-up used. | ||
2.2 Reagents
Standard 1000 mg L−1 solutions of As(III), Ge(IV), Sb(III), Sb(V), Se(IV) and Se(VI) were prepared by appropriate dissolution of their primary standard (Sigma and Merck, Darmstadt, Germany products were used) and final dilution to 250 mL in volumetric flasks.Sodium and potassium bromide, chloride, fluoride and iodide (Panreac, Barcelona, Spain) solutions were prepared as required by dissolution of the solid salt in de-ionized water. Concentrated sulfuric acid (96% w/w) (Merck, Darmstadt, Germany) and all other chemicals used were of analytical reagent grade. De-ionized water from a Milli-Q water purification system was used (Millipore, Bedfort, MA, USA).
2.3 The CHaV procedure
Halide vaporization was based on the following procedure: concentrated sulfuric acid was injected into the reaction vessel and subsequently aqueous solutions of elements and halide (chloride, bromide or fluoride alkaline salts), in this order, were injected. After that, the volatile phases were swept into the ICP torch by the carrier gas, and the atomic emissions were recorded.Ar nebulization gas, at the commercial configuration, was used as the carrier gas. It was channeled through two FIA injection valves (Operating manual, Omnifit, Cambridge, UK) corresponding to the analyte and halide aqueous solutions. After the injections, the carrier gas transported the volatile phase into the plasma. An A/D converter digitized the emission signals for subsequent computer processing.
Vaporization for MAS measurements was carried out in a quartz spectrophotometric cell as the reactor (3 mL maximum volume of reagents). The same conditions and injection procedure were maintained as in the previous assembly. However, no carrier gas was used and the reagents were dispensed by micropipettes. These processes were characterized by spontaneous bubbling of solutions and vapor release. The absorbance could be measured after an initial safety period, in the order, of 60 seconds after addition of the reagents. The readings were carried out vs. a reagent blank, in the range 190–900 nm.
The variables influencing the reaction, transport and emission signals in ICP-OES were adapted from the published optimized conditions to best suit the characteristics of the current vessels and mountings.
The influence of the reactor volume was verified. In general, the time taken to produce the volatiles was longer for larger reactor volumes. That is, the appearance times of volatiles could be seen to be delayed in the current reactor versions compared to older versions.
In all the experiments a thermocouple, in the reaction vessel and the spectrophotometric cell, enabled the temperature to be measured during the procedure.
In all cases, time, temperature, emission intensity and absorbance could be measured at high speed, better than 10 data points per second.
2.4 Experimental data obtained
Vaporizations were characterized by the following experimental data:(i) Atomic emission of the elements by ICP-OES, at optimum emission wavelength. This provided evidence of halide vaporization as typical transient emission peaks.
(ii) Molecular absorbance (MAS-UV-vis) of solutions provided evidence of the change of the halide species remaining in solutions during vaporizations.
(iii) Atomic emission of the OH radicals by ICP-OES showed the profile of the water vapour during the reactions and provided evidence of the influence of the gaseous by-products in the vaporization.
(iv) Solution temperature in the ICP-OES reactors and also in MAS-UV-vis spectrophotometric cells showed the temperature variation with time.
2.5 Kinetic measurements: theoretic basis
 | (1) |
 | (2) |
Where kf and kv are the kinetic rate constants of formation and vaporization.
However if species MXg presented significant solubility in solution, vaporization would require the consideration of two more steps:
(a) vapor solubility in solution: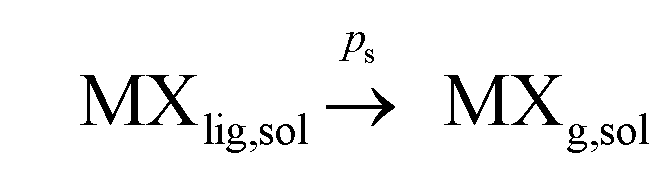 and finally
(b) separation to the gas phase:  where ps and ds are the kinetic rate constants for both processes.
Notwithstanding the optimized halide vaporization conditions: ambient pressure, flash temperature increase, large water vapour release, high sulfuric concentration media, the vapor solubility, MXg,sol could be negligible or very reduced and consequently the vaporization could be simplified in terms of processes (1) and (2).
According to reactions (1) and (2), the variation with time of [MX] (MXliq,sol) could be expressed as a function of two principal processes: formation and vaporization.
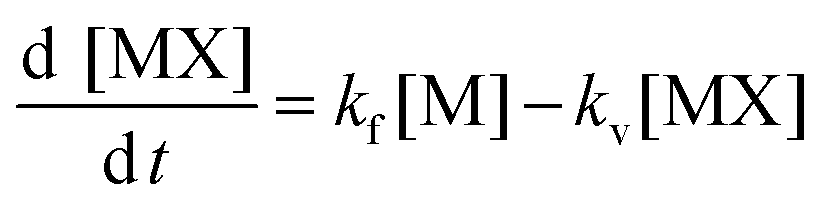 | (3) |
In this equation two important conditions were taken into consideration:
[X] is not altered ([X] is in excess) and has zero order.
[MX]g,sol gas solubility was zero or negligible.
Then if the formation of MX was favored (large kf), [M] could be said to be negligible and consequently the previous equation could be reduced to:
 | (4) |
That is, under these conditions, the rate limiting process for [MX] (in solution) was the vaporization.
This expression could be rearranged and integrated to:
 | (5) |
In MAS, absorbance at time t, At, is measured at the wavelengths detailed in Table 2 for each halide and after tm, are proportional to [MX]:
| At = εl[MX] | (6) |
| Element | Halide | *[Halide]/mol L−1 | *[Sulfuric acid]/ mol L−1 | Flow Ar carrier gas/L min−1 | LD ICP-OES mg L−1 | MAS Wavelength of the maximum nm | Ref. |
|---|---|---|---|---|---|---|---|
| As(III) | Bromide | 0.03 | 7.8 | 0.4 | 1.4 | 220 | 18 |
| As(III) | Chloride | 0.50 | 6.9 | 0.4 | 0.4 | 200 | 16 and 17 |
| As(III) | Fluoride | 0.10 | 11.0 | 0.9 | 0.1 | 190 | 15 |
| Ge(IV) | Chloride | 0.70 | 7.2 | 0.9 | 0.003 | 202 | 19 |
| Sb(III) | Bromide | 0.05 | 11.0 | 0.8 | 0.014 | 216 | 20 |
| Sb(V) | Bromide | 0.11 | 12.7 | 1.2 | 0.050 | 228 | 21 and 22 |
| Se(IV) | Bromide | 0.02 | 9.3 | 1.2 | 0.0015 | 212 | 23 |
| Se(VI) | Bromide | 0.05 | 12.7 | 1.3 | 0.0012 | 206 |
Consequently, eqn (5) could be rearranged to:
 | (7) |
The plot of the first term of the equation vs. reaction time (min) is a straight line, and the slope, kv, is the vaporization rate constant, in min−1 (with t in min).
Results and discussion
3.1 Volatile halides studied and experimental measurements
The vaporizations included in this study correspond to the following elements and halides:As(III) which was vaporized by: bromide, chloride and fluoride. Ge(IV) by chloride. Direct vaporizations of Sb(III) and Sb(V) were carried out by bromide. And also, species of selenium, Se(IV) and (VI) were both vaporized by bromide. The optimum conditions for the vaporization of all the different halides are presented in Table 2.
3.3 Chemical vaporization of As(III) with bromide, chloride and fluoride. General tendencies in halide vaporizations
As(III) was vaporized with bromide, chloride or fluoride, according to the vaporization procedure previously described using the optimum analytical conditions presented in Table 2. These processes yielded, in ICP-OES, the evolution of emission profiles of As, at 193.682 nm, and OH radicals at 306.360 nm, with time. The temperature during the reaction was also measured. The results generated in MAS experiments (molecular absorbance spectrophotometry) showed the evolution of the absorbance of solutions at lambda max (located at 220, 200 and 190 nm for species of bromide, chloride and fluoride respectively) and the solution temperature.All these data are presented, superimposed, in Fig. 2a–c.
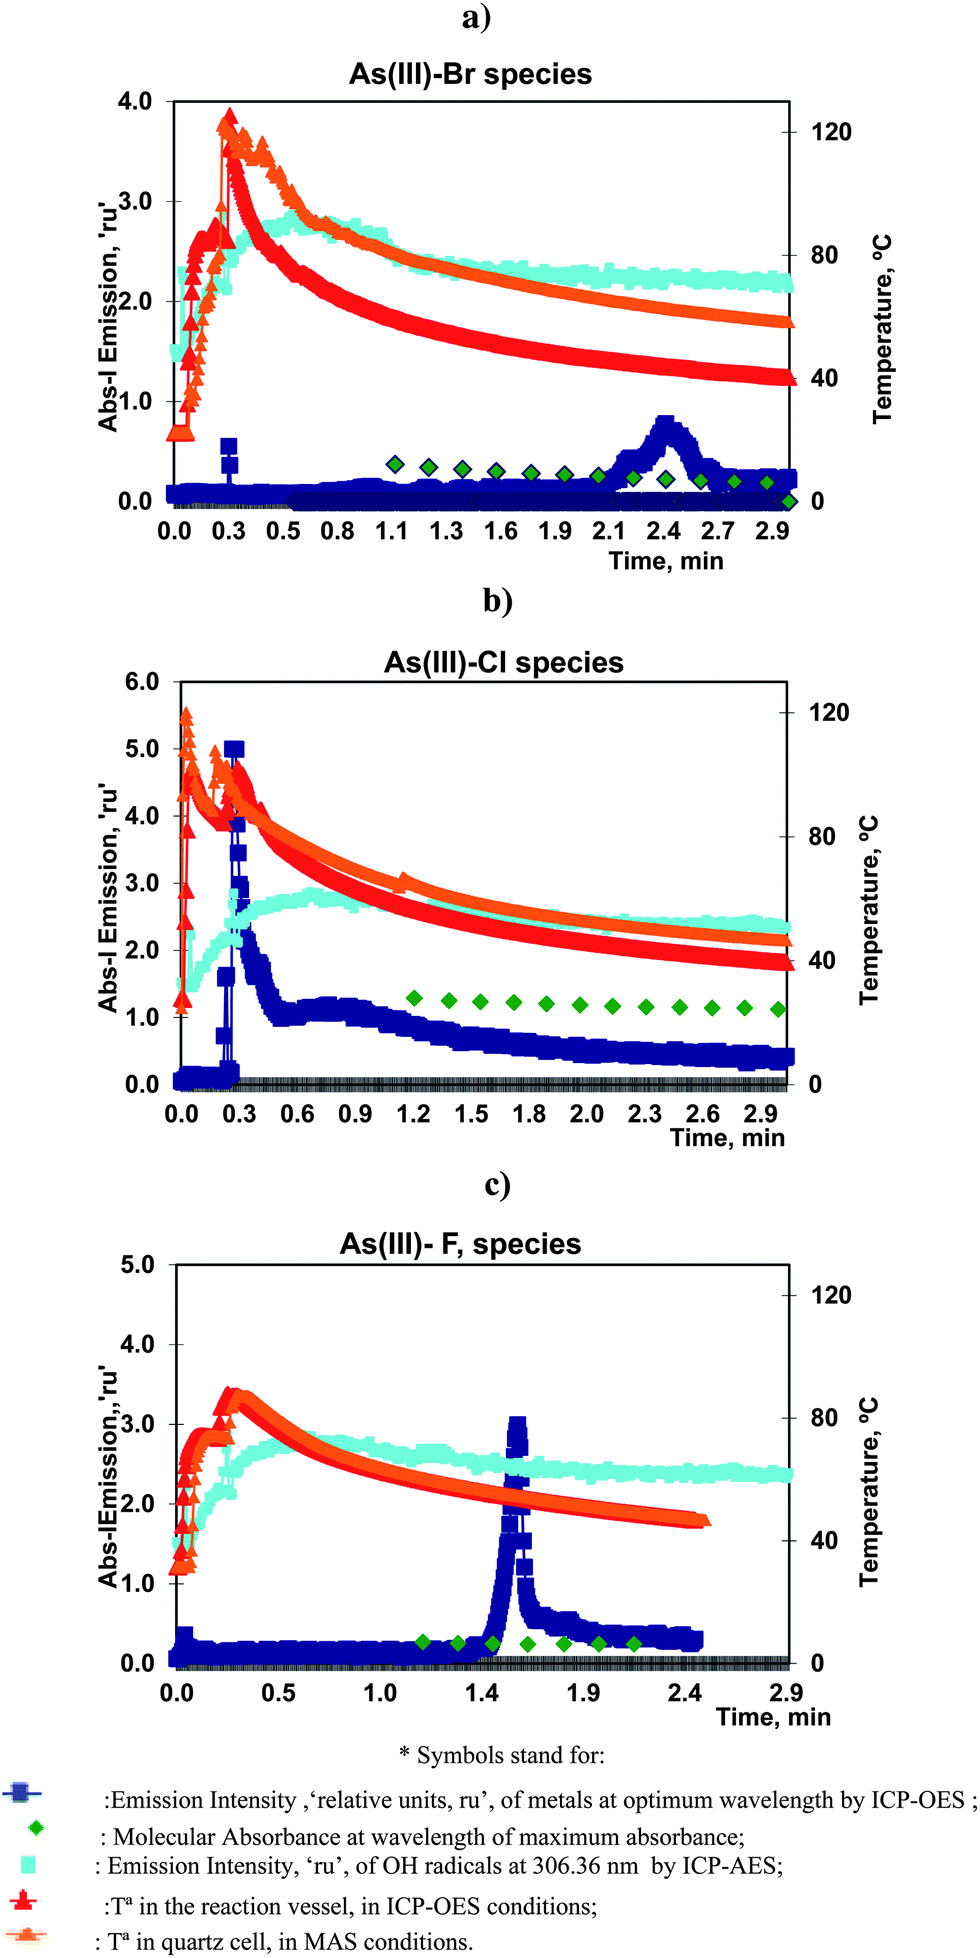 | ||
| Fig. 2 Volatilization of 10.0 mg L−1 of As(III) with (a) bromide, (b) chloride and (c) fluoride under optimum conditions. Profiles of As and OH atomic emission and T in ICP-OES and MAS experiments. | ||
Two peaks were observed in ICP-OES following the chemical vaporization of As(III). The first peaks, for bromide and fluoride appeared very soon, at 0.1–0.2 min, but were very small. This could be a result of the simple transport of the elements by water vapour and gases released after the initial exothermic reaction. However the first chloride peak, at 0.3 min, was very significant, reproducible and sensitive. The same analytical characteristics were observed for the bromide and fluoride peaks present at 2.2 and 1.6 min, respectively.
That is, the principal analytical vapour species of chloride was obtained very soon whereas bromide and fluoride required a longer reaction time.
It is important to note that, in these experiments, there was a sharp increase of the emission profile of the OH radicals in the first minute followed by a slow decrease. Therefore, the presence of the resulting gaseous by-products could improve the transport efficiency of the initial vaporizations but was not so significant for the remaining peaks. This OH profile was characteristic of all the studied halides.
The temperature in the reactor followed a similar trend for all the vaporizations. It started by and initial sharp increases from ambient to maximum values, corresponding to the injection of the aqueous solutions into sulfuric acid. And after three minutes of reaction, the temperature decreased to values of, roughly, 50–40 °C. The maximum temperature was a function of the quantity of the reagents. Thus, it was higher than 100 °C, for bromide and chloride but lower for fluoride.
The ICP-OES profiles of emission vs. temperature showed that the maximum bromide peak appeared when the temperature in the reactor was 44 °C. The maximum chloride peak appeared at 101 °C, and that of fluoride peak at 54 °C.
The temperature behavior in the spectrophotometric cells was similar to the previous values but, in general, the temperature was higher in MAS than in ICP-OES experiments. This could be explained by the use of carrier gas in ICP-OES which resulted in a decrease of the temperature.
The results of the As(III) vaporization with bromide are presented in Fig. 2a, 3a1 and a2. It can be observed that the MAS spectra did not show a substantial change with time. Absorbance–time expression (7) measured at the maximum wavelength, resulted a linear range until 3 min of the reaction onset. In these studies, linear model fittings, or first-order reaction rate plots, could be identified for different time intervals but were only accepted when correlation coefficients were higher or equal to 0.99. This criterion was maintained for all the volatiles.
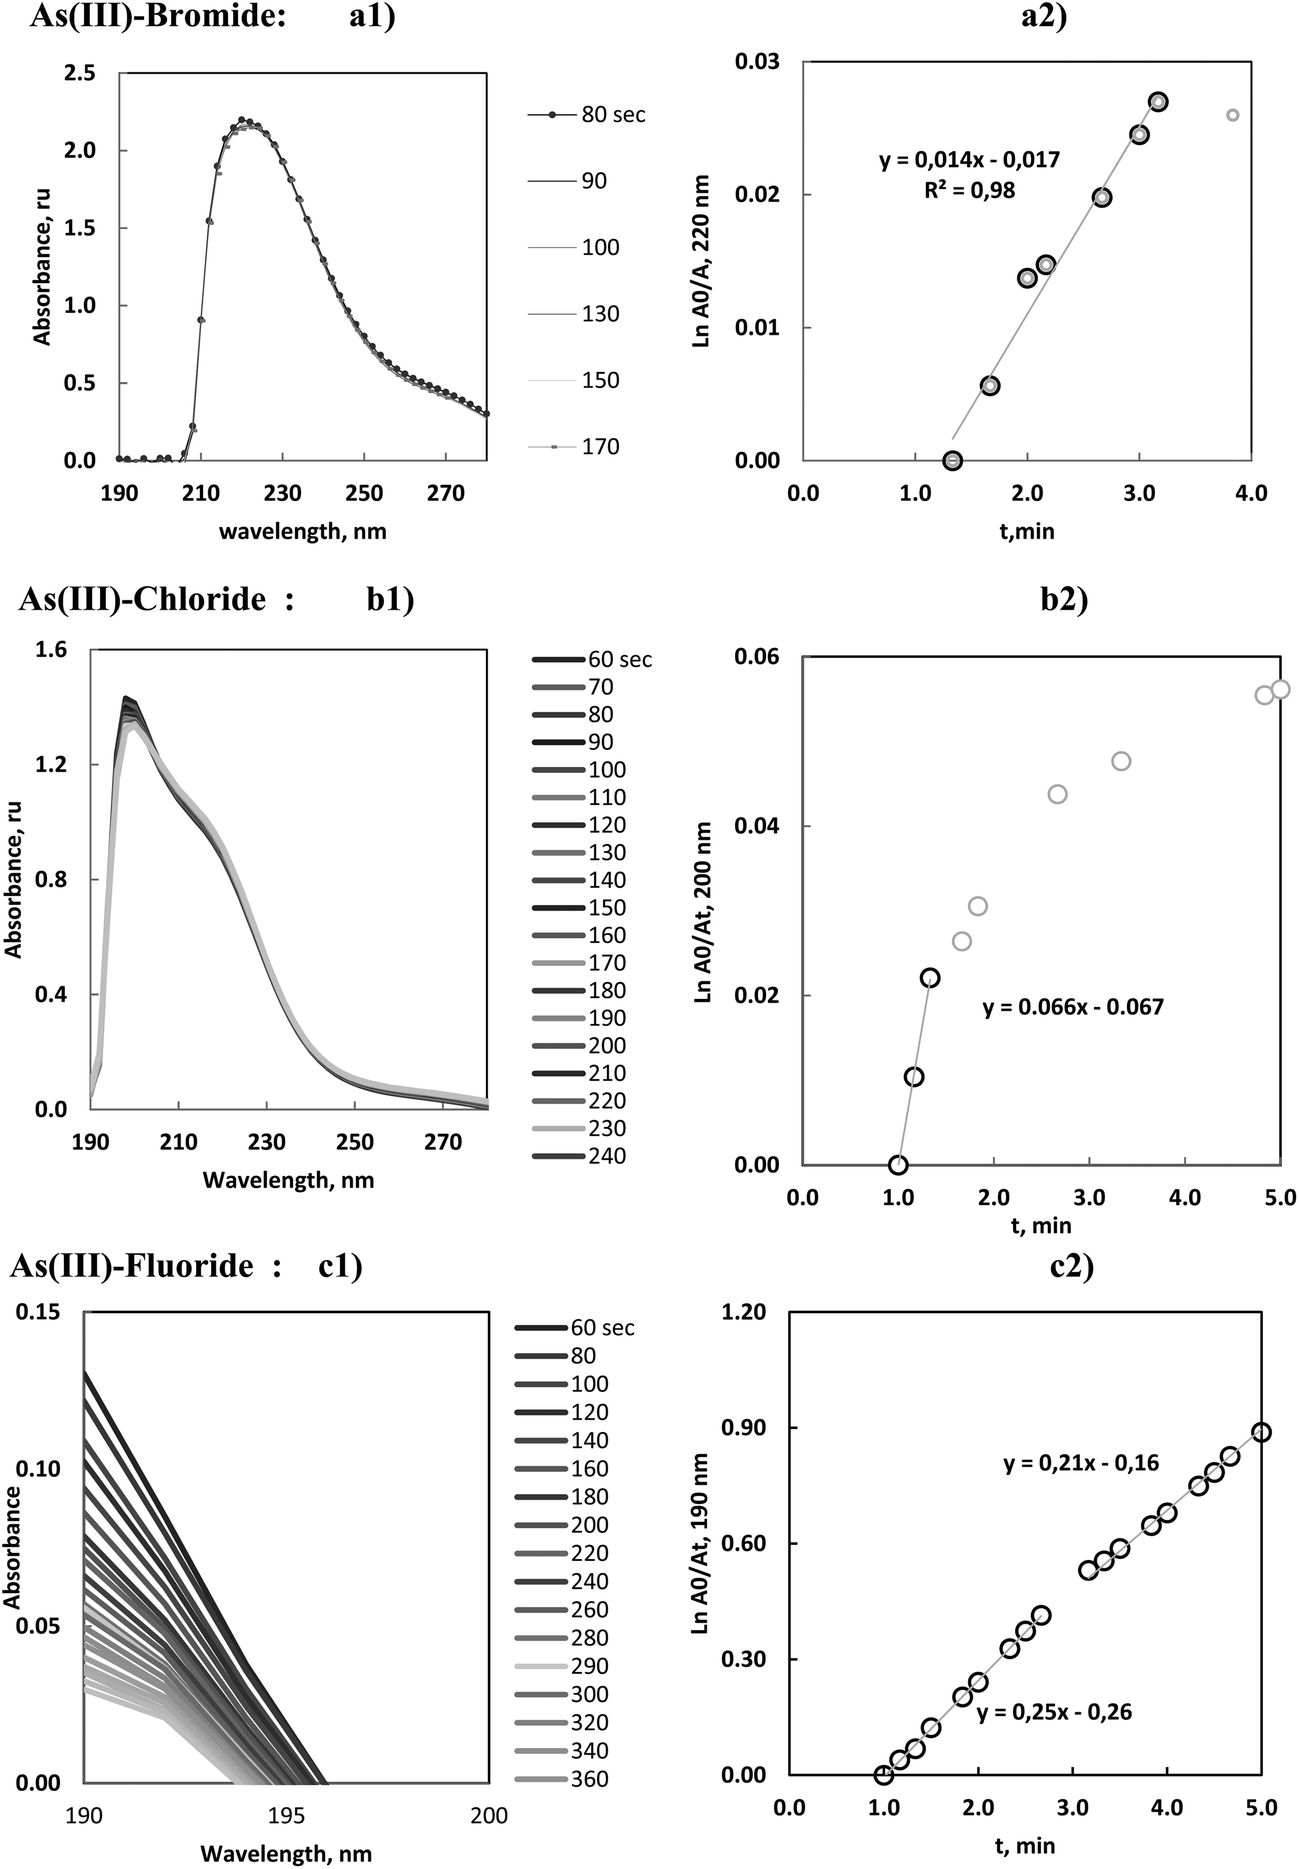 | ||
| Fig. 3 (a1–c1) Molecular absorption spectra of reacting solution of As(III) with bromide, chloride and fluoride, during the vaporization time. (a2–c2) Variation of ln(Am/At), vs. vaporization time: kinetic first order reaction rate plot for As(III)–Br, As(III)–Cl and As(III)–F species. Absorbance values corresponded to the wavelength of maximum absorbance. | ||
The calculated linear slope had a low magnitude and consequently the vaporization was characterized by a small rate constant. The value was in agreement with the long appearance time of the ICP-OES peaks. It was remarkable that As(III)–bromide species presented a significant delay and the analytical sensitivity was low (18) in comparison with the rest of the halides.
Furthermore, all these kinetic results agree with the theoretical and initial assumptions. That is, the formation of MX was favored and the rate limiting process was the MXsol vaporization.
As(III)–chloride vaporization is shown in Fig. 2b, 3b1 and b2, and can be seen to be start very quickly and to be a fast process. The maximum emission of the principal peak for ICP-OES was centered at about 0.3 min. The absorbance of the solutions (measured by MAS after 1 min of the reaction onset) confirmed that the halide concentration remaining in the solution was quite stable, that is, the halide species were already substantially vaporized and consequently the derived kinetic data should be interpreted with partial significance. Furthermore, this vaporization greatly influenced the resulting gaseous by-products released in the reaction.
On the other hand, the MAS spectra showed that the maximum of the chloride species presented a hypsochromic shift in comparison with the previous maximum of the As(III)–bromide species. This tendency is more accentuated for the As(III)–fluoride species. This effect was congruent with the halide influence in the wavelength shift of the absorption maximum in UV-vis spectrophotometry and was argued as evidence of the halide formation.
The study of the As(III)–fluoride species presented a molecular absorption close to the UV transmission limit (190 nm), Fig. 3c1. The linear plot, Fig. 3c2, demonstrated the presence of two linear ranges which were justified by the temperature influence on the rate constant. Notwithstanding this influence was not strong and consequently the slope change was minimal.
These results were interpreted in the sense that As(III)–fluoride species presented a significant vaporization. These species reached a high sensitivity by ICP-OES with a limit of detection in the order of 0.1 μg mL−1.15
3.4 Vaporization of Ge(IV) with chloride
It is well known that Ge(IV) can react with chloride to produce a volatile tetrachloride. Analytical applications have always been based on the use of the continuous flow of concentrated HCl acid7,8 to produce and volatilize GeCl4 except for the discontinuous procedure proposed by us.19 The kinetics of our procedure was studied under the optimum conditions of Table 2.The Ge atomic emission profiles obtained by ICP-OES, at 209.429 nm, and temperature evolution in the reactor, during vaporizations, were measured. Blank tests were carried out and the emission corresponding to OH radicals, at 306.360 nm, was also recorded.
Experiments in a quartz spectrophotometric cell were carried out. And the molecular absorbance and temperature during vaporizations were measured.
The profiles of all these different data are gathered in Fig. 4.
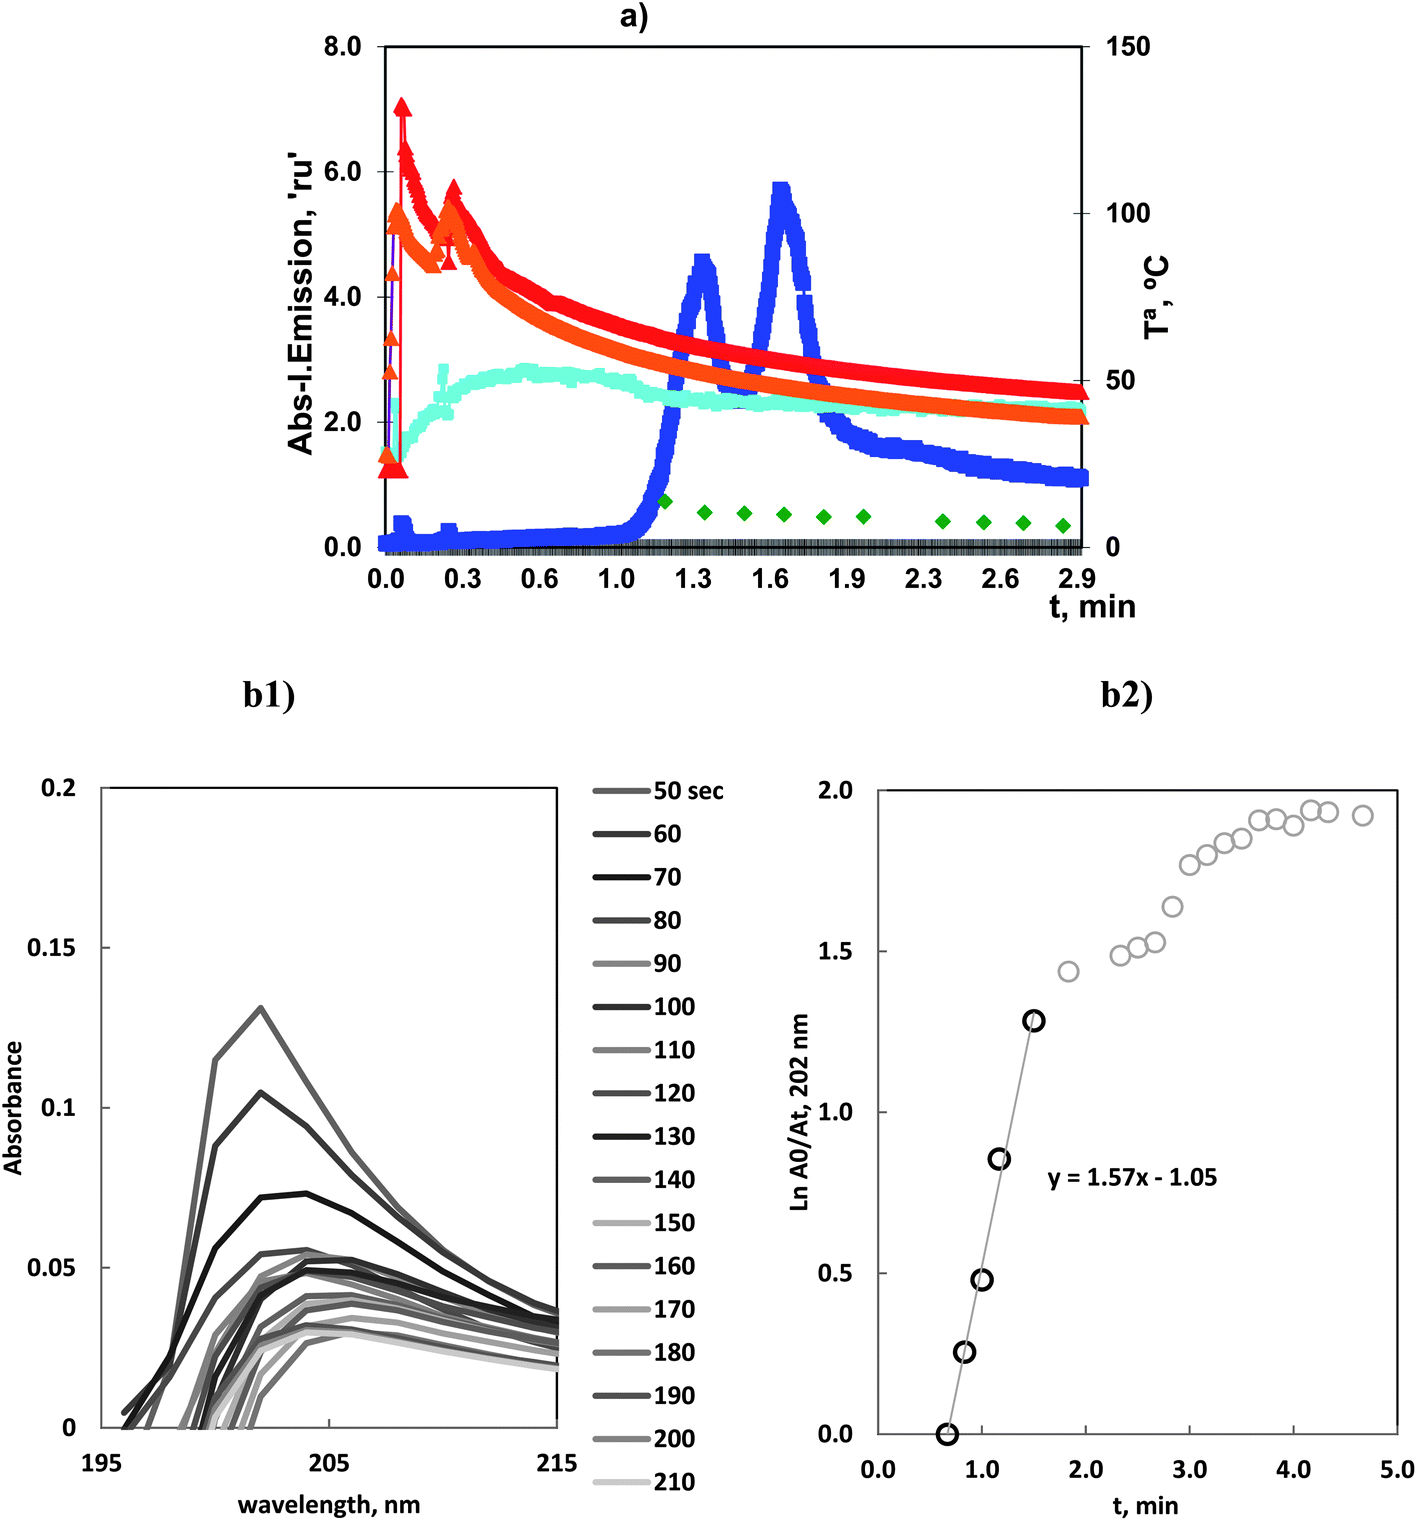 | ||
| Fig. 4 (a) Volatilization of 10.0 mg L−1 of Ge(IV) with chloride at optimum conditions: profiles of Ge and OH atomic emission and Tª in ICP-OES and MA S experiments. (b1) Molecular Absorption Spectra of reacting solution during the vaporization time. (b2) Variation of ln(Am/At), vs. vaporization time. Absorbance values corresponded to the wavelength of maximum absorbance. | ||
The atomic emission profiles for ICP-OES had two partially overlapping peaks at 1.3 and 1.7 min.
It was observed that the first peak, at 1.3 min, was very influenced by the experimental conditions: reactor volume and carrier gas flow. Previous mounting, such as that used in ref. 19, showed that vaporization started in the range 0.3–0.6 min. That is, the first peak vaporization could be compared to the As(III)–Cl species. However, in the current mounting with a larger reactor, the appearance time was delayed.
That is, these species could be considered to be significantly volatile which was congruent with our published results and others published results. The high vaporization is associated with the low limit of detection, 3.0 ng mL−1, obtained by ICP-OES.19
After the initial vaporization, a second vaporization step occurred. MAS spectra revealed a bathochromic shift on the absorption maximum with longer time and the linear plots reflected the presence of new linear ranges.This is congruent with the formation of a second different species. Thus, whereas the first peak was the kinetically favored complex the second peak was produced at lower temperature, with a smaller rate constant.
This result exhibited the general behavior of the halide vaporization. Reactions always proceeded with the appearance of two peaks where the first occurred readily and corresponded to a very reactive and kinetically favored species. In this case, it was presented with a certain delay in comparison with halides such as As(III)–chloride or the next case of Se(VI)–bromide species.
These results were in accordance with those obtained by other authors32 who identified different compositions of halide species depending on the reaction conditions.
3.5 Vaporization of Sb(III) and (V) by bromide
The vaporization of Sb(III) and Sb(V) with bromide can be followed in Fig. 5a and b. The emission profiles for ICP-OES, for both species, showed a first peak that appeared at 0.2–0.3 min and a second peak at 1.9–2.5 min. The analytically significant peaks were those obtained as the second peaks.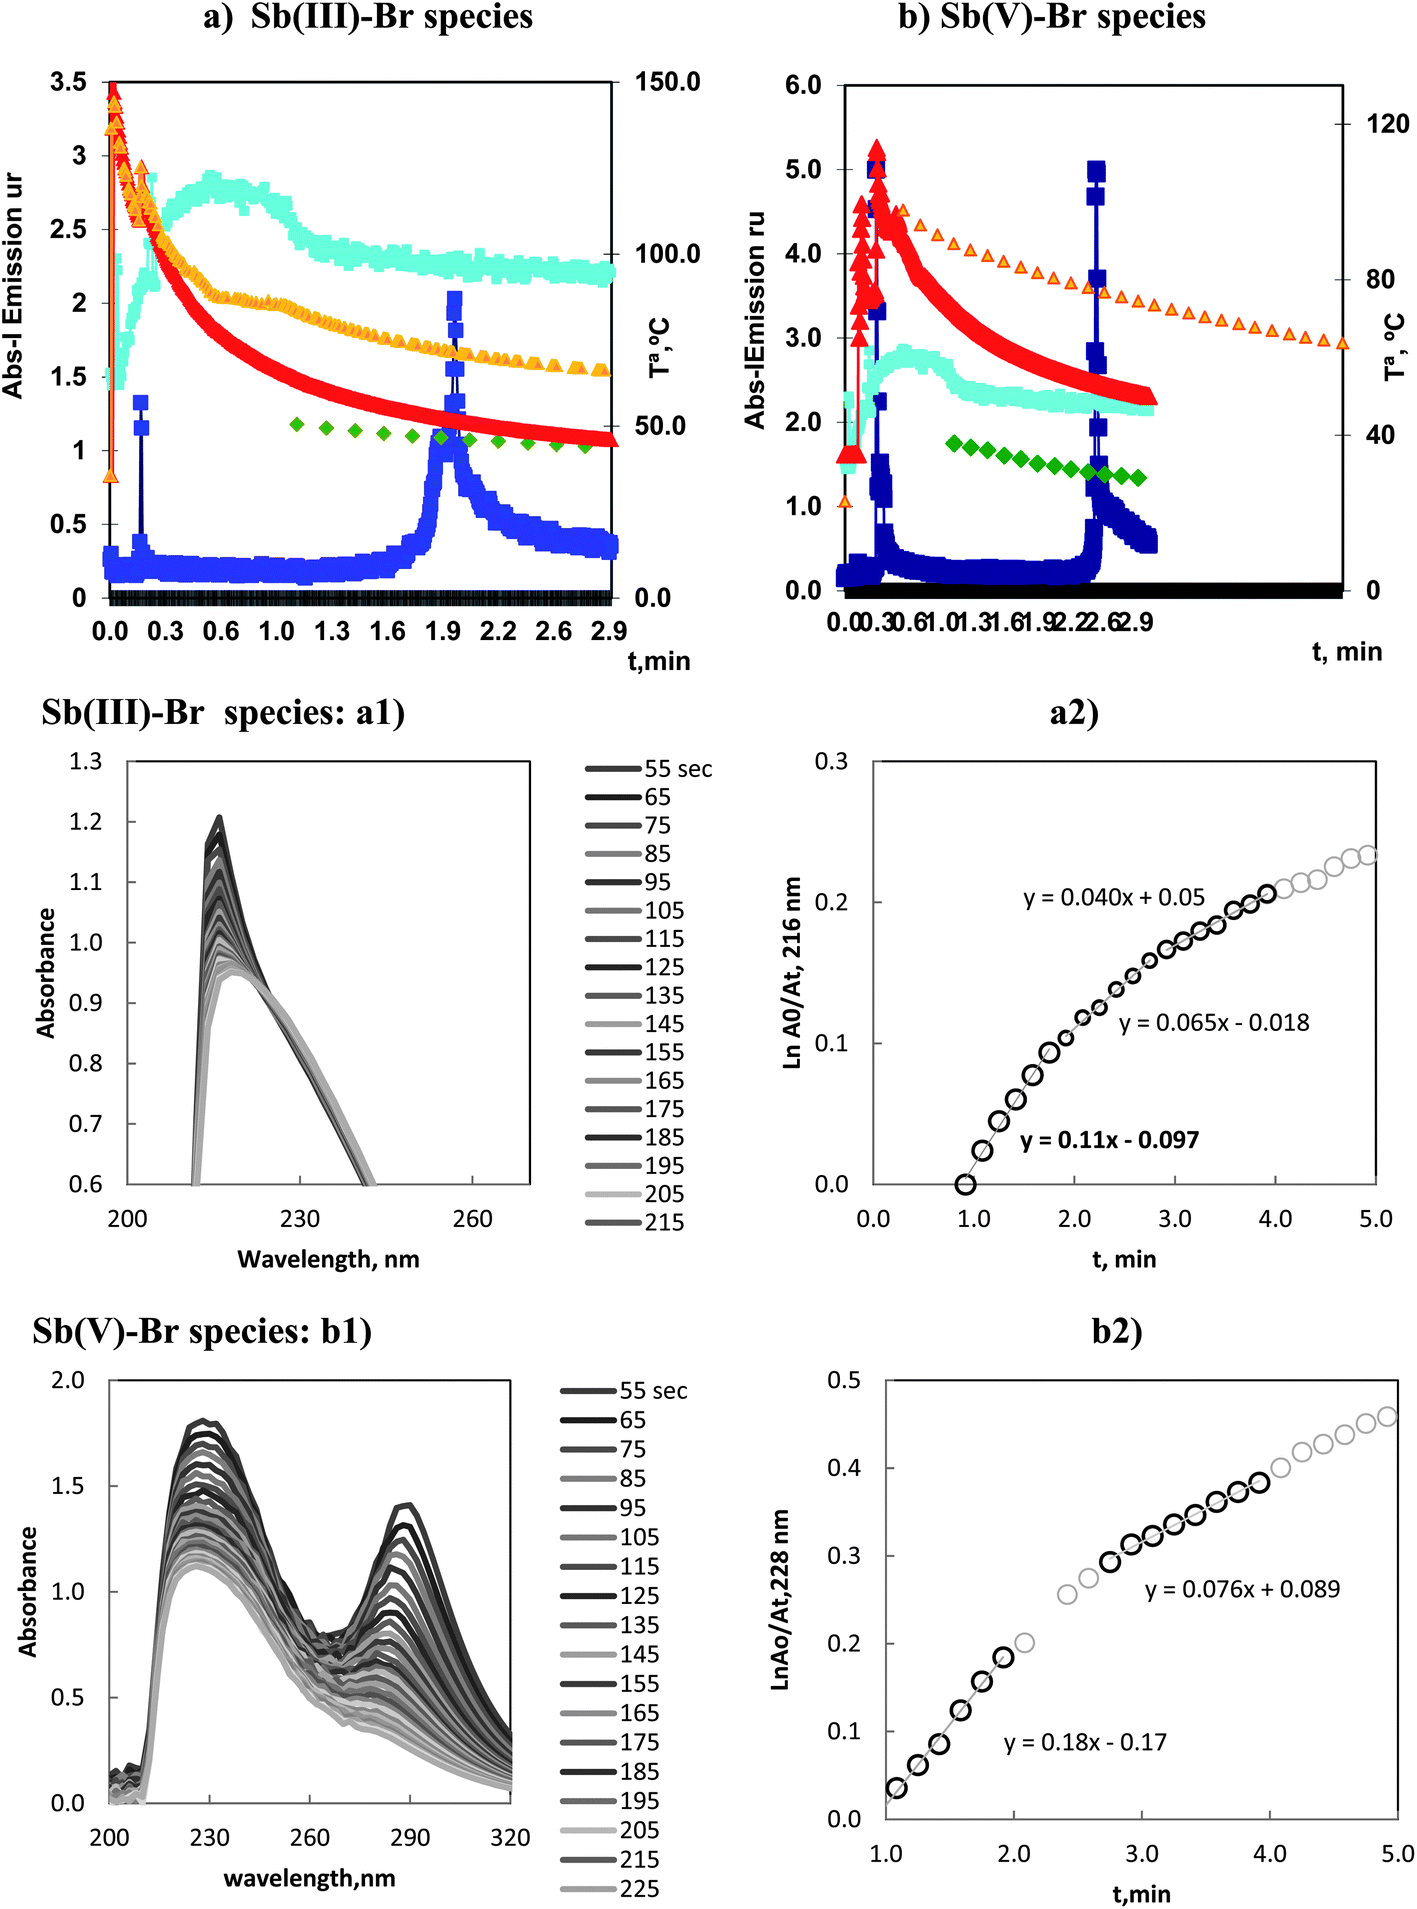 | ||
| Fig. 5 Volatilization of 5.0 mg L−1 of: (a) Sb(III) and (b) Sb(V) by bromide in optimum conditions. Profiles, of Sb and OH atomic emission, and Tª, in ICP-OES and MA S experiments. (a1) Molecular Absorption Spectra of reacting solution during the vaporization time and (a2) variation of ln(Am/At), vs. vaporization time, for Sb(III)–Br species. (b1) Molecular Absorption Spectra of reacting solution during the vaporization time and (b2) variation of ln(Am/At), vs. vaporization time, for Sb(VI)–Br species. | ||
The intense first peak at 0.3 min in the vaporization of Sb(V) was very important. That is, the vaporization of Sb(V) presented a first and kinetically favored peak and, in this sense, was similar to the As(III)–chloride and Se(VI)–bromide species.
Kinetic results for Sb(III) are presented in Fig. 5a2, three linear segments can be observed, with kv values ordered in the sequence: 0.11–0.065–0.04 min−1. These values demonstrated a first important vaporization and a transition to smaller values as a consequence of the temperature decrease in the reaction vessel.
The data corresponding to the species of Sb(V) are plotted in Fig. 5b2. The results obtained are similar to those discussed above. Although the magnitude of kv was larger with the slope of the linear segments ranged in the interval: 0.18, 0.076 min−1.
3.6 Se vaporization by bromide
Se(IV) and Se(VI) reacted with bromide to vaporize both species. In Fig. 6 is presented a general view of the absorbance–time profiles together with the temperature evolution during the vaporization, obtained under the optimum conditions detailed in Table 2.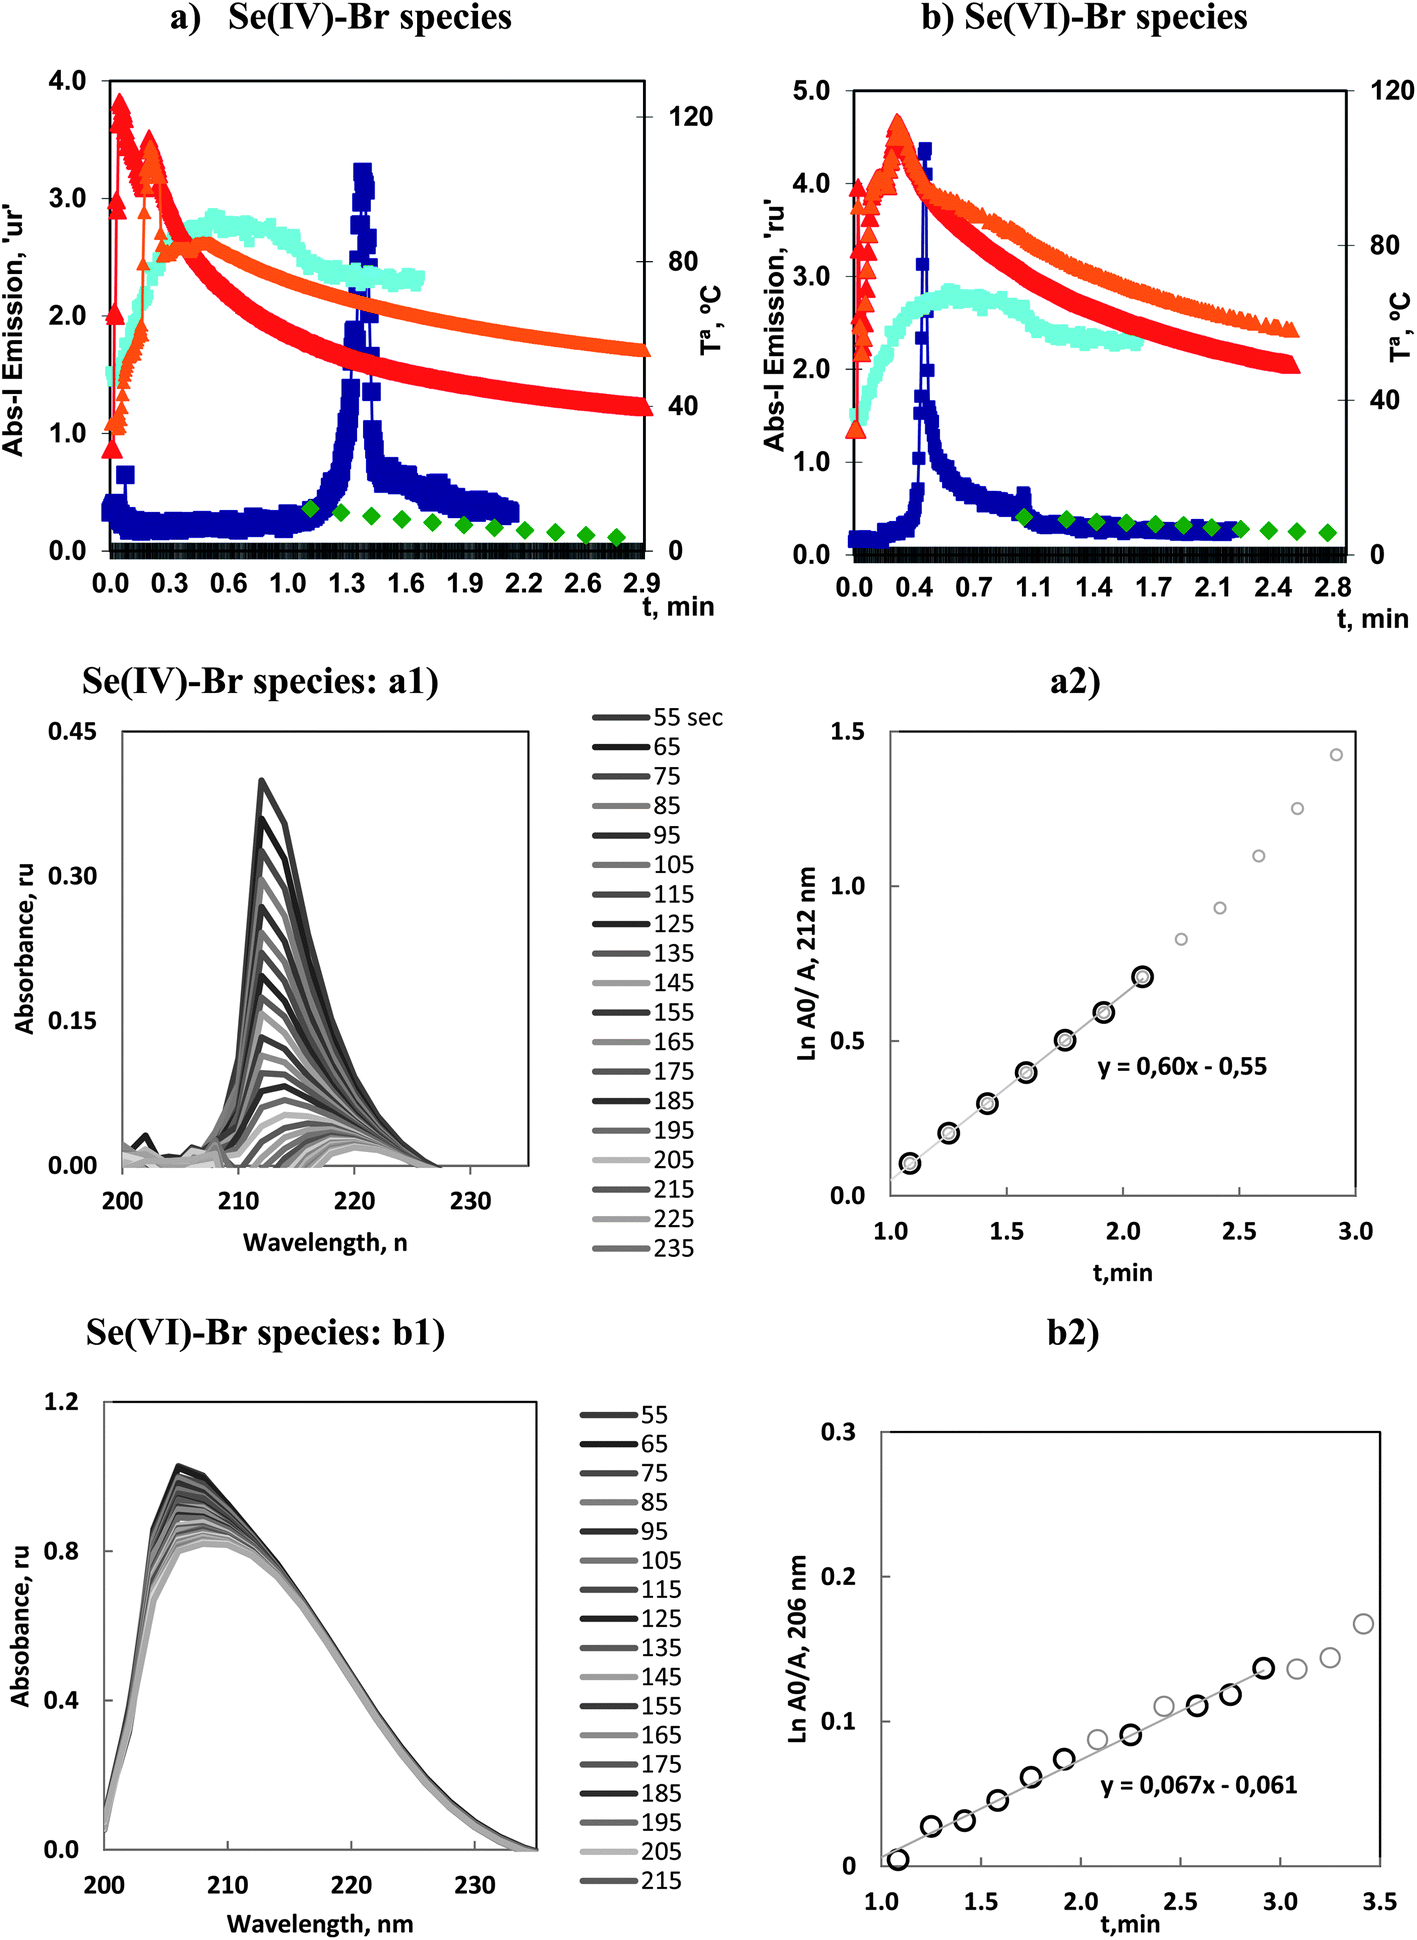 | ||
| Fig. 6 Volatilization of 5.0 mg L−1 of: (a) Se(IV) and (b) Se(VI), by bromide under optimum conditions. Profiles of Se and OH atomic emission, and Tª, in ICP-OES and MAS experiments. (a1) Molecular absorption spectra during the vaporization time and (a2) variation of ln(Am/At), vs. vaporization time, for Se(IV)–Br species. (b1) Molecular Absorption Spectra during the vaporization time and (b2) variation of ln(Am/At), vs. vaporization time, for Se(VI)–Br species. | ||
The principal characteristics of the emission profiles for ICP-OES showed that Se(IV) presented a weak initial peak at 0.1 min whereas the second and principal analytical peak appeared at 1.4 min. However, Se(VI) presented a first readily significant analytical peak at 0.4 min. The second, and weak peak, was present over 1 min.
Kinetic studies were carried out following a similar procedure to those previously applied. That is, MAS spectra were recorded after 1 min of the reaction start, and are presented in Fig. 6a1 and b1. The spectra corresponding to Se(IV) showed a significant decrease with time. Also a bathochromic shift in the wavelength of the absorption maximum with time could clearly be appreciated. The corresponding linear plot had a significant slope, with kv in the order of 0.6 min−1. This magnitude corresponded to the second most significant vaporization.
However the MAS spectra corresponding to Se(VI) exhibited a high stability. This was justified in the sense that these species were already vaporized and consequently the composition remained constant. This result was similar to that reported for As(III)–chloride and the first peak of the Sb(V)–bromide species. That is, the species was readily vaporized, thus it acted as a very reactive species and could be presented as a compound with great analytical potential.
3.7 Comparison between halides
The kinetic results showed well defined characteristics for the different halides. Thus, on the basis of kv, it is possible to distinguish between the different halide types.A first class comprised of halides with large kv, ranging from 2.0–0.2 min−1. It included: Ge(IV)–chloride, Se(IV)–bromide, As(III)–fluoride species. The appearance time in ICP-OES procedures ranged between 1 and 2.4 min, which was a convenient experimental time. They were analytically characterized as being very sensitive, with low limits of detection. Ge(IV)–chloride is representative of this type of behavior.
A second class formed by halides with low kv: less than 0.2 min−1. It included: Sb(V)–bromide, Sb(III)–bromide and As(III)–bromide species.
We also differentiate a type of species that appeared readily and were considered to be very reactive compounds. They included species of As(III)–chloride, Se(VI)–bromide and the first peak of Sb(V)–bromide. Their kv were not calculated but their characteristics allowed similarities to be found with Ge(IV)–chloride species. That is, high kv values could be expected.
It is important to compare the halides on the basis of the appearance time in ICP-OES experiments. It was evident that this time exhibited a high correlation with kv.
The reactive species appeared with a significant peak within the first min of the reaction start.
Halides with large kv appeared between 1.0 and 2.0 min. By contrast, halides with lower kv reached the maximum emission after 2 min.
Fig. 7 shows an iso-contour map where halides could be projected and located on the basis of the reaction conditions and kv values. It can be seen that halides with small kv tend to be located towards the bottom and left of the map whereas the rest of the halides were displaced from this zone. And the most volatile could be seen located near the boundary of the system.
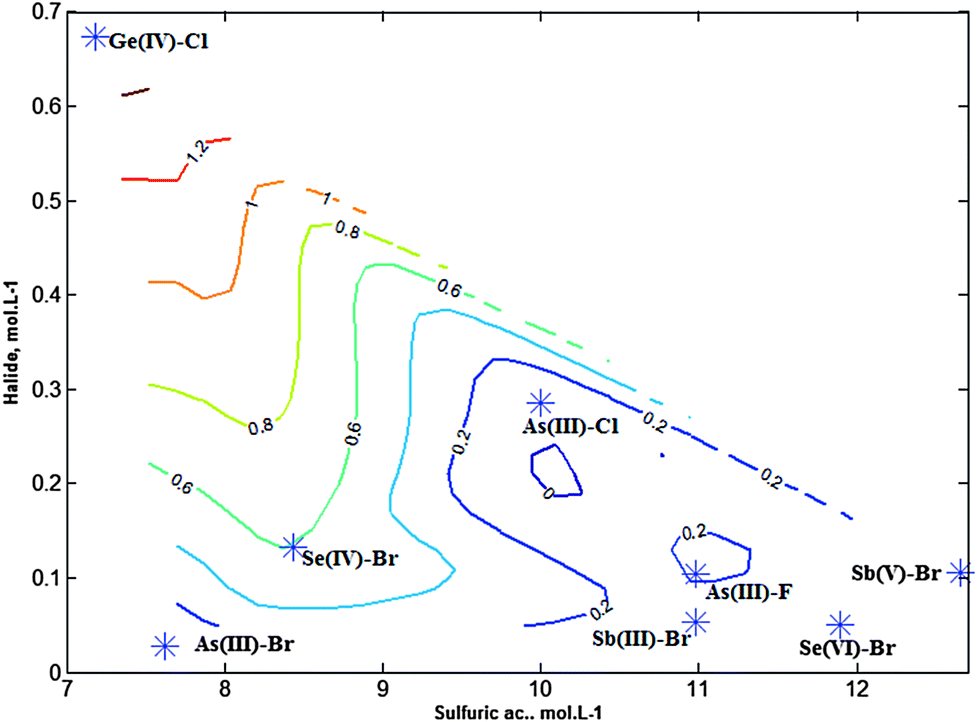 | ||
| Fig. 7 Projection and localization of the volatiles in the iso-contour map obtained according to their optimum reaction conditions: x = [Sulfuric ac] mol L−1; y = [Halide] mol L−1; z = kv, vaporization rate constant, min−1. | ||
It was significant that halides could be ordered on the basis of their composition. Thus, bromide species appeared in the bottom of the map, that is, at smaller bromide concentration, whereas fluoride and chloride species were present at larger halide concentrations. This is in line with previous findings because bromide, in strong acid media, tend to be oxidized whereas fluoride and chloride are more stabilized.
The MAS results demonstrated a systematic tendency in the wavelength of the maximum absorption. The spectra could be attributed to n–sigma* transitions, linked to the unshared electrons in halides and it could be seen that there was a shift in the lambda maximum correlated to the electron affinity of halogens.
The sensitivity of the ICP-OES determinations presented a high degree of correlation with the kv values. Thus, the first class halides, Ge(IV)–chloride, Se(IV)–bromide were the most sensitive, with limits of detection in the order of ng L−1. The reactive Se(VI)–bromide species was also very sensitive, but the As(III)–halides were the least sensitive. These results could be interpreted in the sense that, atomization–excitation yields in the plasma were influenced by both the transport efficiency and also by the energetic characteristics of the molecular bonds.
Conclusions
This work presents a general and basic perspective of chemical vapor generation. In particular, the named volatile halides. These useful analytical procedures were studied in order to have an overall comprehension of the processes which have been recognized as needing to advance in the field in order to improve new and more significant determinations.The paper was intended to correlate basic kinetic parameters of chemical vaporizations calculated under analytical conditions with experimental analytical performance.
In this context, the results obtained enabled kinetic mechanisms to be proposed that connect the analytical reaction conditions, the chemical composition, with the kinetic vaporization rate constants and the performance of ICP-OES.
General trends in halide vaporization could be observed and congruency with analytical results was found. Consequently, vaporized halides could be differentiated and classified. Also significant and readily vaporized species were recognized. Their peaks showed a soon appearance time and were treated as species with great analytical potential.
The vaporization conditions, in particular in reference to the halide concentration, were evidenced as an important factor that influenced the optimum vaporization. Thus, chloride species could be formed with large halide and low acid concentrations whereas bromide species were favoured with small halide but large acid concentrations.
References
- R. E. Sturgeon and Z. Mester, Appl. Spectrosc., 2002, 56, 202–213A CrossRef.
- D. I. Brindle, Anal. Bioanal. Chem., 2007, 388, 735–741 CrossRef PubMed.
- P. Pohl and P. Jamroz, J. Anal. At. Spectrom., 2011, 26, 1317–1337 RSC.
- A. Lopez-Molinero, D. Sipiera and J. R. Castillo, J. Anal. At. Spectrom., 2011, 26, 1841–1848 RSC.
- R. K. Skogerboe, D. L. Dick, D. A. Pavlica and F. E. Lichte, Anal. Chem., 1975, 47, 568–570 CrossRef CAS.
- S. Tesfalidet and K. Irgum, Fresenius' J. Anal. Chem., 1990, 338, 741–744 CrossRef CAS.
- X. W. Guo and X. M. Guo, Anal. Chim. Acta, 1996, 330, 237–243 CrossRef CAS.
- S. Farias and P. Smichowski, J. Anal. At. Spectrom., 1999, 14, 809–814 RSC.
- N. Barnett, H. Beere, L. Ebdon and B. Fairman, J. Anal. At. Spectrom., 1989, 4, 805–806 RSC.
- P. Smichowski and S. Farías, Microchem. J., 2000, 67, 147–155 CrossRef CAS.
- P. Wu, L. He, C. Zheng, X. Hou and R. E. Sturgeon, J. Anal. At. Spectrom., 2010, 25, 1217–1246 RSC.
- A. Lopez-Molinero, A. Ferrer and J. R. Castillo, Talanta, 1993, 40, 1397–1403 CrossRef CAS PubMed.
- A. Lopez-Molinero, A. Morales, A. Villareal and J. R. Castillo, Fresenius' J. Anal. Chem., 1997, 358, 599–603 CrossRef CAS.
- A. Lopez-Molinero, L. Martinez, A. Villareal and J. R. Castillo, Talanta, 1998, 45, 1211–1217 CrossRef CAS PubMed.
- A. Lopez-Molinero, M. Benito, Y. Aznar, A. Villareal and J. R. Castillo, J. Anal. At. Spectrom., 1998, 13, 215–220 RSC.
- A. Lopez-Molinero, A. Villareal, Y. Aznar, M. Benito and J. R. Castillo, Appl. Spectrosc., 2001, 55, 1277–1282 CrossRef CAS.
- A. Lopez-Molinero, J. R. Castillo, P. Chamorro and A. Callizo, Microchim. Acta, 1999, 131, 225–230 CrossRef CAS.
- A. Lopez-Molinero, A. Villareal, C. Velilla, D. Andía and J. R. Castillo, J. AOAC Int., 2002, 85, 31–35 CAS.
- A. Lopez-Molinero, A. Villareal, D. Andia, C. Velilla and J. R. Castillo, J. Anal. At. Spectrom., 2001, 16, 744–749 RSC.
- A. Lopez-Molinero, O. Mendoza, A. Callizo, P. Chamorro and J. R. Castillo, Analyst, 2002, 127, 1386–1391 RSC.
- A. Lopez-Molinero, Y. Echegoyen, D. Sipiera and J. R. Castillo, Talanta, 2005, 66, 863–868 CrossRef CAS PubMed.
- A. Lopez-Molinero, P. Calatayud, D. Sipiera, R. Falcon, D. Linan and J. R. Castillo, Microchim. Acta, 2007, 158, 247–253 CrossRef CAS.
- A. Lopez-Molinero, R. Gimenez, P. Otal, A. Callizo, P. Chamorro and J. R. Castillo, J. Anal. At. Spectrom., 2002, 17, 352–357 RSC.
- A. Ramesh Kumar and P. Riyazuddin, TrAC, Trends Anal. Chem., 2010, 29, 166–176 CrossRef.
- Y. Yin, J. Liu and G. Jiang, TrAC, Trends Anal. Chem., 2011, 30, 1672–1684 CrossRef CAS.
- Z. Zhu, C. Huang, Q. He, Q. Xiao, Z. Liu, S. Zhang and S. Hu, Talanta, 2013, 106, 133–136 CrossRef CAS PubMed.
- L. Wu, Z. Long, L. Liu, Q. Zhou, Y.-I. Lee and C. Zheng, Talanta, 2012, 94, 146–151 CrossRef CAS PubMed.
- A. D'Ulivo, Z. Mester, J. Meija and R. E. Sturgeon, Anal. Chem., 2007, 79, 3008–3015 CrossRef PubMed.
- A. D'Ulivo, Spectrochim. Acta, Part B, 2010, 65, 360–375 CrossRef.
- C. W. Fuller, Analyst, 1976, 101, 798–802 RSC.
- C. H. Chung, Anal. Chem., 1984, 56, 2714–2720 CrossRef CAS.
- R. E. Surgeon and Z. E. Mester, J. Anal. At. Spectrom., 2001, 16, 470 RSC.
| This journal is © The Royal Society of Chemistry 2014 |