Spectroscopic and electrochemical characterization of heteropoly acids for their optimized application in selective biomass oxidation to formic acid†
Jakob
Albert
a,
Daniela
Lüders
b,
Andreas
Bösmann
a,
Dirk M.
Guldi
*b and
Peter
Wasserscheid
*a
aLehrstuhl für Chemische Reaktionstechnik der Universität Erlangen-Nürnberg, Egerlandstrasse 3, D-91058 Erlangen, Germany. E-mail: wasserscheid@crt.cbi.uni-erlangen.de; Fax: +0049 9131 85 27421; Tel: +0049 9131 85 27420
bLehrstuhl für Physikalische Chemie I der Universität Erlangen-Nürnberg, Egerlandstrasse 3, D-91058 Erlangen, Germany. E-mail: guldi@chemie.uni-erlangen.de; Fax: +0049 9131-85 27340; Tel: +0049 9131-85 28307
First published on 17th September 2013
Abstract
Different Keggin-type polyoxometalates have been synthesized and characterized in order to identify optimized homogeneous catalysts for the selective oxidation of biomass to formic acid (FA) using oxygen as an oxidant and p-toluenesulfonic acid as an additive. Applying the optimized polyoxometalate catalyst system H8[PV5Mo7O40] (HPA-5), a total FA-yield (with respect to carbon in the biogenic feedstock) of 60% for glucose within 8 h reaction time and 28% for cellulose within 24 h reaction time could be achieved. The transformation is characterized by its mild reaction temperature, its excellent selectivity to FA in the liquid product phase and its applicability to a very wide range of biogenic raw materials including non-edible biopolymers and complex biogenic mixtures.
Introduction
The depletion of fossil resources and concerns about increasing CO2 concentration in the atmosphere (accompanied with negative effects on the climate) are pushing scientists around the world towards green energy technologies. In this context, the conversion of biomass to energy carrier molecules and fuels is most relevant as all the carbon in biomass stems from CO2 that has been previously captured from the atmosphere.1–3Among the types of biomass available for such energetic applications, lignocellulosic biomass is of the highest importance as it is not in direct or indirect competition to food production. Lignocellulosic biomass typically contains 40–50% cellulose, 20–40% hemicellulose and 20–30% lignin.4 Consequently, the efficient valorization of cellulose is a very important and also a challenging topic.5,6 In general, cellulose conversion processes are complicated by the fact that this biopolymer is insoluble in water and in most organic solvents. Moreover, cellulose is very resistant to many ways of chemical and biological transformations.7,8 Nevertheless, several publications deal with cellulose conversion catalysed by heteropolyacid salts and Ru/C in hydrolytic hydrogenation,9 saccharification,10 production of isosorbide11 and hydrogenation to hexitols.12
Under an industrial view, new biomass-to-energy concepts must fulfil the following three criteria: (a) low specific investment cost even at small plant sizes as big plant sizes require transport of biomass over long distances; (b) low operation costs, and (c) production of a product or product mixture of high value.
Low specific investment cost results from a low number of unit operations, mild operating conditions and simple downstream processing (no solids, no dead-end streams, no complex product fractionation). To realize low operation cost the use of cheap biomass feedstock (e.g. wet, mixed waste biomass that is not suitable for fermentation or gasification processes) and low energy demand is essential. In terms of product value a clearly defined, large market or a wide range of different interesting product applications are desired.
It is a matter of fact that many of the options that have been intensively developed to date to convert lignocellulosic biomass to energy molecules (like e.g. hydrogen, syngas, methane or ethanol), do not fulfil all of the named criteria. While biomass gasification requires high temperature and significant efforts for gas purification,13,14 supercritical reforming suffers from high investment into corrosion resistant equipment.15,16 Aqueous reforming, in contrast, has been reported to be restricted to a small range of biogenic substrates and is typically operated in high dilution. Even under these conditions the process is still characterized by the undesired formation of solid carbohydrate polymers as dead-end products.17 Moreover, fermentative processes to convert biomass to ethanol or methane are typically restricted to carbohydrate substrates which are in direct or indirect competition with the food industry.
The numerous attempts to convert biomass into platform chemicals for further use in industrial chemistry or as fuels have certainly produced in the recent years a large number of very important fundamental insights into the nature of catalytic defunctionalisation reactions.1–5 However, the direct technical relevance of these findings is limited, as most of these studies deal with pure starting materials18 or even use biomass model compounds to study the general nature of the transformations of interest.19
Catalytic oxidation chemistry of biomass is a growing field of research. The main effort is to overcome the recalcitrant nature of the feedstock by acid-catalyzed depolymerization followed by oxidative cleavage of the carbon bonds in the biomolecule. For this purpose, solid acid catalysts in active reaction media, such as sulfonated resins in ionic liquids, supported metal catalysts/heteropolyacids20–22 or classical heterogeneous catalysts like Ru or Pt on acidic surfaces like zeolites or acidic Al2O3![[thin space (1/6-em)]](https://www.rsc.org/images/entities/char_2009.gif) 23 have been applied.
23 have been applied.
Since 2011, our group is active in exploring an alternative way to convert biomass into energy molecules. In detail, we are studying the selective oxidation of biomass to formic acid (FA) using oxygen as an oxidant and polyoxometalate (POM) complexes as a homogeneous catalyst.24,25 We could demonstrate for example that H5PV2Mo10O40 (HPA-2) converts water-soluble carbohydrates to FA as the sole product in the liquid phase at 90 °C using 30 bar of oxygen in aqueous solution.24 Later, we demonstrated that complex water-insoluble biomass can be effectively converted by the same catalyst if organic acids, such as e.g. p-toluenesulfonic acid (TSA) are used as an additive.25 In this way it was possible to convert cellulose and even wood. The conversion of cellulose in the presence of TSA was interpreted as a two stage process of acid cellulose hydrolysis followed by glucose oxidation to FA and CO2.
This “cold and wet” combustion process is restricted to a reaction temperature of 90 °C as higher temperatures would lead to a thermal decomposition of FA to CO and water. During the reaction the oxidation produces heat. The generated FA can be separated from the aqueous reaction mixture by simple liquid/liquid extraction. FA yields of 30 kg from 100 kg cellulose (molar yields of 19% based on carbon in cellulose) could be realized using HPA-2 within 24 h reaction time.25
Besides the mild reaction conditions and the very broad range of useable biogenic substrates, the here described method has the advantage that all thermally induced side-reactions forming gluey or solid by-products (as typically observed in reductive biomass conversion processes) are completely suppressed under the applied oxidative conditions. Moreover, the formed FA is not oxidized further to CO2 while all carbon from the biomass ends up (after appropriate reaction times) as either FA or CO2. This facilitates dramatically the downstream processing of the reaction mixture that essentially contains – after full feedstock conversion – FA as the only liquid phase product in the aqueous solution.
In our view FA is a very interesting product from biomass conversion processes. FA is a commodity chemical that is widely used in the chemical, agricultural, textile, leather, pharmaceutical and rubber industries.26 So far, commercially available FA is entirely based on fossil raw materials. Its industrial production is based on the hydrolysis of formic acid methyl ester that is accessible via carboxylation of methanol.26 Alternatively, FA is also produced by partial oxidation of naphtha or butanes.27 Hydrogenation of CO2 is an alternative route to FA that has attracted a lot of interest in the recent years but has so far not been industrially realized.28 Alternative ways to produce FA from biomass include thermal cracking of biomass (FA is only a byproduct),29 wet oxidation with Fe2(SO4)3/CuSO4 at 200 °C,30 with NaOH under hydrothermal conditions,31 or with H2O2![[thin space (1/6-em)]](https://www.rsc.org/images/entities/char_2009.gif) 32 or OH−/H2O2
32 or OH−/H2O2![[thin space (1/6-em)]](https://www.rsc.org/images/entities/char_2009.gif) 33 in supercritical water. Moreover, the group of Li and co-workers has published a paper in 2012 dealing with the oxidation of biomass by different water-soluble vanadium-compounds.34 All these processes suffer, however, from a modest selectivity to FA or from thermal degradation of the product.
33 in supercritical water. Moreover, the group of Li and co-workers has published a paper in 2012 dealing with the oxidation of biomass by different water-soluble vanadium-compounds.34 All these processes suffer, however, from a modest selectivity to FA or from thermal degradation of the product.
Recently, FA has been proposed by the groups of Beller and Dyson as a suitable hydrogen storage compound35,36 in the context of future hydrogen economy.37 FA contains a 4.4 wt% share of hydrogen38 that can be easily and selectively liberated through metal catalyzed processes under very mild conditions (<100 °C) forming CO2 as the only by-product.39–41 It is obvious that an FA-based hydrogen transport and storage concept would greatly benefit from new and innovative ways to produce FA from renewable resources.
For the here described selective oxidation of biomass to FA, selection of the right homogeneous catalyst is critical. Since complete combustion of biomass to water and CO2 is always the thermodynamically favoured reaction in biomass oxidation with molecular oxygen, the applied catalyst must promote fast oxidation of all carbon in biomass to FA while preventing oxidation of FA to CO2. This challenging task is fulfilled remarkably well by the Keggin-POM H5PV2Mo10O40 (HPA-2) reported in our previous papers. For this particular POM catalyst an interesting electron-oxygen transfer chemistry including the ability to insert oxygen into a carbon–carbon bond has been described in the literature.42
One major drawback of the HPA-2 catalyst is however, its relatively slow biomass conversion rate and the need for high oxygen partial pressures (typically 30 bar) for the re-oxidation of the catalyst. Moreover, the relatively low redox potential of HPA-2 (0.68 V vs. NHE at pH = 1)43 in comparison with FA (0.61 V vs. NHE)44 implies the risk of over-oxidation of FA to CO2. Remarkably, the rate determining step of the biomass conversion to FA with HPA-2 is clearly not the biomass oxidation itself but the re-oxidation of the reduced catalyst with molecular oxygen after oxygen has been transferred to the biomass substrate.
In this contribution, we present the results of our attempts to identify a more readily re-oxidizable catalyst system for the selective conversion of carbohydrates to formic acid. For this purpose, we synthesized different Keggin-type polyoxometalates (HPAs) and characterized them by photophysical and electrochemical techniques. In order to compare the catalytic performance of different HPAs with solubility aspects excluded, we applied glucose as model substrate and used NMR and in situ UV-Vis electrochemical methods to monitor the FA formation. The so identified, best catalyst system was later investigated in the oxidation of the main components of lignocellulosic biomass with TSA as an additive.
Results and discussion
To define the exact requirements for the catalytic systems under investigation it is helpful to divide the whole reaction mechanism into three basic reaction steps: (a) acid hydrolysis of the water-insoluble substrate to water-soluble fragments (not required in the case of water soluble feedstock); (b) oxidative cleavage of C–C-bonds in the substrate; (c) re-oxidation of the in situ reduced POM-catalyst by molecular oxygen. Step (c) is rate determining at low oxygen pressure. Steps (b) and (c) are schematically illustrated in Fig. 1.From these three key steps the requirements for a suitable catalyst can be derived. The catalyst should be re-oxidizable with molecular oxygen at partial pressures as low as possible (to allow e.g. the use of air), the catalyst should effectively promote oxidative C–C-bond cleavage without oxidising FA to CO2, the catalyst should be stable and active in acidic aqueous solutions (pH = 0–3), have a redox potential between 0.61 V (FA) and 1.23 V (O2) vs. NHE, and finally, the catalyst should be insensitive against typical impurities in real biomass.
The here presented catalyst optimization study is entirely based on the use of Keggin-type polyoxometalates. These form the most widely used class of POMs. They have the general formula [XYmM(12−m)O40](3+m)−, where X is the heteroatom and M and Y are the addenda atoms. The tetrahedral XO4 (X = P, Si) and via the sharing corner or edge oxygen atom bridged 12 octahedral MO6 (M = W, Mo) and YO6 (Y = V, Cr, Mn) units form their structure.45–47 These POMs are characterized by strong Brønsted acidity, high proton mobility, fast multi-electron transfer, high solubility in various solvents and excellent resistance against hydrolytic or oxidative degradations in solution.48,49 These properties make them very attractive catalysts for the oxidative conversion of biomass.
As stated above, the re-oxidation of the reduced form of POM is in most cases the rate determining step in the oxidation reaction. This step is strongly dependent on the available oxygen concentration in solution where the reaction takes place.50 As oxygen availability in solution is a function of oxygen partial pressure and of oxygen mass transfer from the gas-phase into the liquid phase, we conducted all our experiments in a 600 mL Parr reactor equipped with a gas entrainment stirrer. As already shown in our former work,24,25 POM re-oxidation becomes significantly faster under higher oxygen partial pressure. At 30 bar oxygen pressure the re-oxidation of the catalyst is clearly faster than the oxidation of the substrate. Thus under these conditions the biomass oxidation becomes the rate determining step.
We started the here presented catalyst optimization study based on the published observation that HPA-n with n > 3 are especially easy to re-oxidise.51,52 While Keggin-type HPA-n (n = 1–3) are typically prepared from solutions of their salts,53 this method is not applicable for higher substituted HPA-n. An alternative literature method prepares the Na-salts instead of the free HPA-n by using different Na-precursors.54,55 However, lower catalytic activities have been reported for these Na-salts compared to the free heteropoly acids.56
Using a synthesis method published by Odyakov et al. in 2008,57 we were able to prepare HPA-n solutions with n = 2–6. In this method water-insoluble V2O5 is first dissolved in cooled H2O2 to form peroxyvanadic compounds which decompose quickly to unstable H6V10O28 solutions. The latter are subsequently stabilized with H3PO4 to yield a stable H9PV14O42 vanadium(V) intermediate. Independently, the molybdenum(VI) precursor is prepared by mixing a boiling aqueous suspension of MoO3 and H3PO4. To yield the final HPA-n solution, the two vanadate and the molybdate solutions are combined under boiling conditions followed by water removal under vacuum.
This method was further modified by our working group to make it applicable for the synthesis of HPA-n (n = 0–6) solid heteropolyacid hydrates without deficiency of vanadium in the crystals by elimination of pervanadyl cations from the HPA-n solutions, a synthetic problem described in the literature.58,59 This was carried out by slow evaporation of water at 80 °C in the presence of an additional PEG solvent followed by crystallization of the Keggin-POM overnight in the refrigerator. The received crystals were finally dried at 10−3 mbar by keeping a constant low temperature of max. 4 °C.
The characterization of the different HPA-n (n = 0–6) catalysts obtained in this way was performed via ICP-OES, 31P- and 51V-NMR, UV-Vis and FT-IR measurements. Additionally, the content of hydration water was determined via TGA. A detailed description of the analytical procedures is found in the Experimental section below.
Table 1 shows the list of prepared HPAs together with the results of the respective ICP-OES and TGA measurements of the completely dried compounds. All compounds have been obtained in very good yields (>95% with respect to the applied metal compounds) and in very good purity (relative error of ICP-OES elemental determination <3%).
| Compound | Molecular composition | P/V/Mo ratioa,b,c | Hydration waterd [mole] |
|---|---|---|---|
| a P/V/Mo ratio determined via ICP-OES, 20 mg of the HPA-n catalyst dissolved in 250 mL of double distilled water. b Yield of synthesis for vanadium calculated by Y(V) = n(vanadium in HPA-n)/n(vanadium in V2O5). c Yield of synthesis for molybdenum calculated by Y(Mo) = n(molybdenum in HPA-n)/n(molybdenum in MoO3). d Moles of hydration water determined via TGA with a three-step temperature programme up to 350 °C with helium as a carrier gas. | |||
| HPA-0 | H3[PMo12O40] | 1/0/11.83 | 8 |
| HPA-1 | H4[PVMo11O40] | 1/0.82/11.14 | 9 |
| HPA-2 | H5[PV2Mo10O40] | 1/2.01/10.12 | 10 |
| HPA-3 | H6[PV3Mo9O40] | 1/2.94/9.20 | 10 |
| HPA-4 | H7[PV4Mo8O40] | 1/4.18/7.95 | 11 |
| HPA-5 | H8[PV5Mo7O40] | 1/4.87/7.21 | 12 |
| HPA-6 | H9[PV6Mo6O40] | 1/5.95/5.87 | 13 |
Furthermore, TGA analyses up to 350 °C showed no thermal degradation of the POM complexes. Only hydration water was removed during heating resulting in a mass loss of about 10 wt%. Up to 140 °C, the dry hydrated compounds are present. On raising the temperature further to 350 °C, also constitutional water is removed without destroying the Keggin structure. These observations fit well with the results published by Jerschkewitz et al.58 Interestingly, the content of hydration water in the POM complexes rises with a higher degree of substitution. This could be due to the higher basicity of the compounds going along with higher vanadium content.
In the following, we describe analytic methods to characterize POM complexes of the general type HPA-n exemplified for the HPA-2 compound. Fig. 2 shows the 51V- and 31P-NMR spectra of the synthesized HPA-2 in acidic (pH = 1.3) D2O solution. All detected resonances can be assigned to individual isomers of the Keggin structure of decamolybdodivanadophosphate according to the literature.60,61 This confirms that our modified synthesis of the isolated HPA-2 complex results in the same structure as the literature known synthesis protocol via the corresponding Na-salts.53 With a higher degree of substitution and thus an increasing vanadium content, the resonances of the different positional isomers become broader which makes the interpretation of the spectra more complicated. The corresponding 31P-NMR spectra also show the signals of all five positional isomers at the appropriate shifts and, in addition, the peak for the free [PO4]3− anion at +0.5 ppm (see Fig. 2).
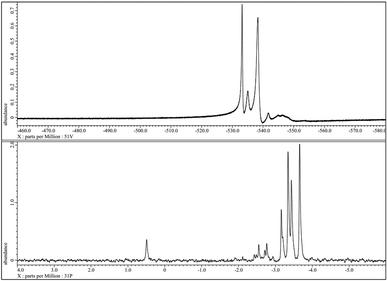 | ||
| Fig. 2 51V-NMR (top) and 31P-NMR spectra of the 1 mmol HPA-2 solution at pH = 1.3 and 25 °C without resolution enhancement. | ||
Apart from HPA-2, all other POMs of the general type [XYmM(12−m)O40](3+m)− have been investigated by NMR as well. The corresponding spectra also agree well with the references published in the literature for the same POM structures synthesised in more complex ways (see ESI†).52,62 This confirms that the here applied synthetic method is appropriate for the preparation of the full series of HPA-n (n = 0–6) heteropolyacid hydrates. Identity and purity of the synthesized compounds were further confirmed by UV-Vis spectroscopy and the data obtained were again identical to literature reports (see ESI†).63,64
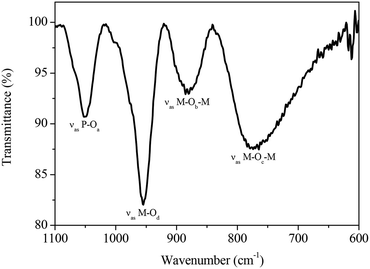
As mentioned before, the primary structure of the heteropolyanions of the general type HPA-n (n = 0–6) studied in this work is the Keggin structure. The oxygen atoms of the Keggin structure can be subdivided into four different types (Oa: inner oxygen; Ob: corner-sharing oxygen, Oc: edge-sharing oxygen, Od: terminal oxygen). These show four well-defined infrared bands that can be applied for the identification and discrimination of different HPA-n catalysts. The four classes of oxygen atoms can be described as follows: the central oxygen X–Oa establishes a connection between the central heteroatom of the XO4 tetrahedron and the transition metal atoms of a trimetallic MO3 structure. The M–Ob–M oxygen atoms connect two M3O13 units by corner sharing. Furthermore, M–Oc–M oxygen links two transition metal atoms by edge sharing of two MO6 units and finally the terminal oxygen atom M–Od binds to only one transition metal atom.65–67 To the best of our knowledge, this is the first time where the full series of HPA-n (n = 0–6) has been completely characterized and the same complexes have been applied in catalysis.
For example, the FT-IR spectrum of HPA-2 in the range of 1100–600 cm−1 is shown in Fig. 3. Intense IR bands are found that we assigned to the characteristic stretching vibrations of the Keggin oxoanion observed at 1051 cm−1 (νas P–Oa), 951 cm−1 (νas M–Od), 877 cm−1 (νas M–Ob–M) and a broad band at 766 cm−1 (νas M–Oc–M), respectively (M = Mo, V).
Table 2 presents an overview of the results obtained from the FT-IR measurements of all POM complexes synthesised in this study. The comparison of the FT-IR spectra of the different HPA-n (n = 0–6) shows that the characteristic bands of the Keggin ion shift to lower wavenumbers proportional to the number of introduced vanadium atoms. This shift is due to the presence of vanadium atoms in the structure and hence gives a further indication for the incorporation of V in the Keggin structure.68
| Compound | ν as (P–Oa) | ν as (Mo–Od) | ν as (Mo–Ob–Mo) | ν as (Mo–Oc–Mo) |
|---|---|---|---|---|
| a Measurements: Infrared (IR) spectra of the different HPAs were accomplished with a FT-IR spectrophotometer Prestige-21 (Shimadzu) by using a Golden Gate ATR unit with a diamond crystal (LOT) in the range between 1100 and 600 cm−1. | ||||
| HPA-0 | 1054 | 952 | 878 | ∼740 |
| HPA-1 | 1052 | 952 | 877 | ∼740 |
| HPA-2 | 1051 | 951 | 873 | ∼740 |
| HPA-3 | 1048 | 948 | 871 | ∼735 |
| HPA-4 | 1046 | 948 | 870 | ∼735 |
| HPA-5 | 1045 | 948 | 864 | ∼730 |
| HPA-6 | 1041 | 948 | 864 | ∼730 |
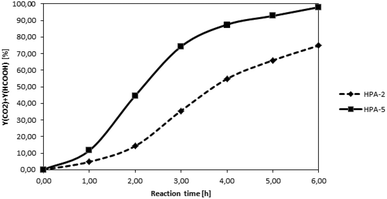
After the successful characterization of all prepared HPA-n complexes, we aimed to test first their efficiency for the oxidation of the water-soluble model substrate glucose in analogy to our first publication on the topic in 2011.24 To allow the calculation of yields based on the carbon atoms available in the substrate, we used quantitative NMR- and GC-measurements for product analysis. The yield of FA was determined by means of 1H-NMR using benzene as an external standard and calculated as n(FA)/n(C-atoms feedstock). The yield of CO2 was determined by GC-analysis and is obtained as n(CO2)/n(C-atoms in the feedstock). In each experiment, the glucose substrate was processed with a different HPA complex as a catalyst. Deionized water was used as a solvent and the oxidation was carried out for 8 h at 90 °C under 30 bar of pure oxygen pressure. The reaction time was set to eight hours to guarantee full conversion of the substrate in all the experiments. For the higher substituted HPAs, the reactions approach complete conversion at shorter reaction times. The reaction temperature was selected to be 90 °C, as lower temperatures would have resulted in a much lower reaction rate (EA = 150 kJ mol−1) while temperatures over 100 °C would have led to loss of FA by thermal decomposition to CO and water. Fig. 4 shows a comparison of the combined FA + CO2 yields over time for the glucose oxidation catalysed by the two different catalysts HPA-2 and HPA-5.
The two curves show clearly the faster kinetics of the higher substituted HPA-5 catalyst while both curves follow the same general trend. The results of our complete HPA-n catalyst screening are given in Table 3.
| No. | Catalyst | Combined yield FA + CO2![[thin space (1/6-em)]](https://www.rsc.org/images/entities/char_2009.gif) b (%) b (%) |
pH beforec | pH afterc | Selectivity FA + CO2![[thin space (1/6-em)]](https://www.rsc.org/images/entities/char_2009.gif) d (%) d (%) |
|---|---|---|---|---|---|
| Reaction conditions: 5.0 g (27.8 mmol) of glucose as a substrate and 0.8 mmol of catalyst (initial weight depending on molar mass of the HPA) dissolved in 100.0 mL H2O, at 30 bar O2, 90 °C, 8 h, 1000 rpm.a Processed for 24 h because of lower conversion.b Combined yield determined by means of 1H-NMR (FA) and GC analysis (CO2) considering the two being the only products; combined yield was calculated as (n(FA) + n(CO2))/n(C-atoms feedstock) with a relative error of ±1%.c pH measurements performed directly in solution at 20 °C with an accuracy of ±0.01.d Selectivity determined by means of 1H-NMR using benzene as an external standard according n(FA)/n(C-atoms feedstock). | |||||
| 1 | HPA-0a | 10 | 3.32 | 1.54 | 40![[thin space (1/6-em)]](https://www.rsc.org/images/entities/char_2009.gif) : :![[thin space (1/6-em)]](https://www.rsc.org/images/entities/char_2009.gif) 60 60 |
| 2 | HPA-1a | 12 | 3.34 | 1.52 | 50![[thin space (1/6-em)]](https://www.rsc.org/images/entities/char_2009.gif) : :![[thin space (1/6-em)]](https://www.rsc.org/images/entities/char_2009.gif) 50 50 |
| 3 | HPA-2 | 91 | 3.51 | 1.30 | 52![[thin space (1/6-em)]](https://www.rsc.org/images/entities/char_2009.gif) : :![[thin space (1/6-em)]](https://www.rsc.org/images/entities/char_2009.gif) 48 48 |
| 4 | HPA-3 | 100 | 3.39 | 1.27 | 56![[thin space (1/6-em)]](https://www.rsc.org/images/entities/char_2009.gif) : :![[thin space (1/6-em)]](https://www.rsc.org/images/entities/char_2009.gif) 44 44 |
| 5 | HPA-4 | 97 | 3.45 | 1.41 | 54![[thin space (1/6-em)]](https://www.rsc.org/images/entities/char_2009.gif) : :![[thin space (1/6-em)]](https://www.rsc.org/images/entities/char_2009.gif) 46 46 |
| 6 | HPA-5 | 94 | 3.45 | 1.41 | 61![[thin space (1/6-em)]](https://www.rsc.org/images/entities/char_2009.gif) : :![[thin space (1/6-em)]](https://www.rsc.org/images/entities/char_2009.gif) 39 39 |
| 7 | HPA-6 | 97 | 3.24 | 1.41 | 58![[thin space (1/6-em)]](https://www.rsc.org/images/entities/char_2009.gif) : :![[thin space (1/6-em)]](https://www.rsc.org/images/entities/char_2009.gif) 42 42 |
| 8 | H9PV14O42a | 88 | 3.68 | 1.88 | 58![[thin space (1/6-em)]](https://www.rsc.org/images/entities/char_2009.gif) : :![[thin space (1/6-em)]](https://www.rsc.org/images/entities/char_2009.gif) 42 42 |
Additionally, we used vanadylsulfate (VOSO4) as water-soluble vanadium species. This compound showed good catalytic activity with a FA-yield of 62% at a conversion of 93% for glucose as a substrate within 24 h reaction time. However, the major drawback of this homogeneous vanadium oxide is its non-re-oxidability under the applied reaction conditions. After the reaction, the solution showed a blue colour of reduced V(IV)-species together with little green-black solid residue at the bottom. The 31P-NMR-spectra showed only peaks for vanadium(IV). The solid was separated and further characterized via ICP-OES as VO2. Thus it could be demonstrated that the heteropolyacid cage and especially the presence of molybdenum in it is necessary for stability and re-oxidability of the vanadium complex.
In fact, all tested HPA-n compounds were active in the glucose oxidation to FA and CO2 under the applied conditions. The major drawback of the unsubstituted species HPA-0 and the monosubstituted HPA-1 was found to be their low catalytic activity with only 4 and 6% yield of FA after 24 h reaction time. This mediocre catalytic activity is attributed to the slow re-oxidisability of HPA-0 and HPA-1 under 30 bar oxygen pressure at 90 °C. The reason for this phenomenon is that the one-electron oxidation of V(IV) to form the HO2˙ radical is thermodynamically unfavourable.69 This behaviour was further confirmed by the dark blue colour of the reaction solution. Moreover, 31P- and 51V-NMR analyses showed that the largest part of vanadium stayed in its reduced form as vanadium(IV) during the reaction. Therefore, these two compounds are not appropriate as catalysts for biomass oxidation. Nevertheless, it is noteworthy that the re-oxidation of HPA-0 and HPA-1 by O2 proceeds readily at temperatures over 200 °C.69
Interestingly, the pure vanadium complex H9PV14O42 showed also a remarkable catalytic activity (Table 3, entry 8). The combined yield reaches 88% after 24 h with FA and CO2 being the only products. The reaction solution had a clear yellow colour and no solid residues were found. Before the reaction, the 51V-NMR spectrum showed five peaks for the different positional isomers of vanadium. The spectrum after the reaction, however, showed only one broad peak at −535 ppm indicating that the initial catalyst species is not stable under the applied reaction conditions. It is also fair to state that the catalytic activity of H9PV14O42 is much lower than that of the active HPA-n complexes (n = 2–6) as 24 h reaction time was required to reach yields compared to 8.
In fact, all other tested HPA-n with n = 2–6 are stable and re-oxidisable under the applied reaction conditions. All these HPAs showed a clear orange colour without any solid residues after eight hours reaction time in glucose oxidation. Hence, the presence of a certain number of V ions in the heteropolyanion complexes seems to be essential for suitable re-oxidability. The selectivity was for all HPA-n (n = 2–6) complexes higher than 50% for FA while the combined yields after 8 h reaction time were in the range of 90 to 100%. The highest selectivity was 61% and reached with HPA-5 as a catalyst. The stability and reversibility of the HPA-5 could be demonstrated via51V- and 31P-NMR and absorption spectroscopy. The 31P-NMR spectra of HPA-5 before (top) and after (bottom) the reaction are shown in Fig. 5.
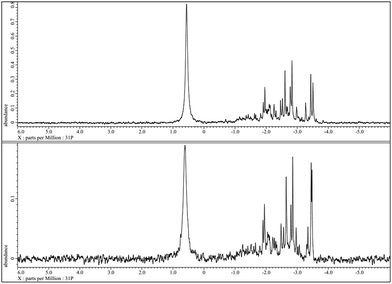 | ||
| Fig. 5 31P-NMR of HPA-5 before (top) and after (bottom) the reaction at pH = 1.41 and 25 °C without resolution enhancement. | ||
Remarkably, we found a clear tendency that a higher degree of vanadium substitution in the Keggin structure increases the catalytic activity. At the same pH, the stability of HPA-n in solution decreases with an increasing number of vanadium atoms, especially for n > 5.70 Heteropolyacids in aqueous solution are extremely complex systems, and the higher the V content, the more complex becomes the system. Details regarding these structural questions are found in a publication by Kozhevnikov and Matveev.71
As already shown in Fig. 1, once the biogenic substrate is in aqueous solution, the next step in the reaction mechanism is the oxidation of the organic substrate. The required electron transfer from the substrate to the oxidant cannot be carried out directly by molecular oxygen because the energy barrier is too high. In this context the HPA-n complex acts as a reversible oxygen transfer catalyst. The HPA-n complexes are catalytically active under very mild conditions (<100 °C) preventing thermally induced side-reactions of the substrate. The mechanism can be explained via two different active species. The dissociation of the parent HPA-n leads to a monomeric pervanadyl (VO2+) cation and complexes thereof. This step has been described by Matveev et al.71 as an individual observation for HPA-n with n = 4–6 in strongly acidic media (such as our reaction system). In addition, the parent heteropolyanions can be the active species in step 1. This is likely the case for more stable polyanions with a lower V-content, e.g. HPA-2 or HPA-3. As the parent heteropolyanions are multi-electron oxidants, they can in principle react via multi-electron transfer.
The results in Table 3 clearly show that for higher substituted HPA-n, the selectivity to FA is higher than for the lower substituted ones. Thus our results indicate that the formation of the pervanadyl cation has a positive effect on selective FA formation. The free pervanadyl cation has a higher redox potential (0.87 V vs. NHE)50 and hence a higher catalytic activity than the parent HPA-n with 0.68–0.71 V vs. NHE at pH = 1.72 This pH dependency of different vanadium clusters in aqueous solution was already investigated by Murmann and Giese73 in 1978 for the vanadyl oxoanion V10O286−. The description of the dissociation equilibrium was further investigated by Zhizhina et al.51 The results from these studies can be transferred to the formation of the pervanadyl cation at low pH values in our reaction system and help to understand the observed differences in reactivity.
The proposed mechanism is shown in Fig. 6. It comprises two alternative ways for the dissociation of HPA-n. On the one hand, before the oxidation reaction starts, the fully oxidized HPA-n with a reduction degree of m = 0 dissociates to free pervanadyl and the residual degenerated lacunary species. On the other hand, the fully reduced HPA-n after the substrate oxidation with a reduction degree of m = n dissociates to vanadyl (VO2+) and the lacunary species.
In an acidic solution, the free vanadyl (VO2+) ion cannot be oxidised by molecular oxygen. Instead, the V4+ formed in the reaction returns into the heteropolyanion either by an electron transfer or by association with the lacunary species (HPA-n − 1). Consequently, V4+ is re-oxidised by oxygen inside the HPA-n as shown in Fig. 7.
One major effect of the above described equilibria is that the pH of the reaction solution does not only decrease by the formation of FA, but also with the increasing re-oxidation of HPA-n. Hence the pH not only influences the dissociation and therefore the substrate oxidation, but also the second re-oxidation step of the POM catalyst and thus the rate-determining step of the whole reaction. This interplay was further investigated by electrochemical and in situ UV-Vis-electrochemical methods.
Another mechanism was offered by Khenkin et al. in 1999.74 These authors used aldehydes as reducing agents in the HPA-2 catalysed oxidation of alkanes with molecular oxygen. In this study, they describe an acyl-peroxo radical mechanism for the formation of an aldehyde-polyoxometalate intermediate as an active species. Furthermore, the HPA-2 compound was identified as an inhibitor for the oxidation reaction presumably due to its ability to capture the active acyl peroxo radical intermediate.
To investigate the idea of a free radical oxidation determining the outcome of our reactions, we performed comparison runs with added radical scavenger. For this purpose we added BHT (2,6-bis(1,1-dimethylethyl)-4-methylphenol) as a scavenger to the oxidation of glucose under the same reaction conditions as described previously in Table 3, entry 6. To trap all possible radicals, we used an excess of BHT compared to HPA-5 (1.2 equivalents). The experiment clearly showed that there was no influence of the BHT scavenger. With the added scavenger, the conversion reached 99% with a FA-selectivity of 60% after eight hours reaction time. Therefore we can unambiguously conclude that the reaction mechanism is not of radical nature.
In accordance with the literature, the cyclic voltammogram of HPA-2 shows peaks at +0.32 V and +0.08 V. These can be assigned to the reduction of the V(V) and Mo(VI) in the heteropolyacid cage.75 The cyclic voltammogram of HPA-5 was measured under identical conditions and showed the same trends (see ESI†). In order to shed light onto the individual peaks shown in the CVs, square wave voltammograms (SWVs) of all HPA-n (n = 0–6) complexes were measured.
Fig. 8 shows a comparison of different HPA-n (n = 0, 2 and 5) indicating significant changes with increasing V-content. While the main redox-peaks at −0.47, −0.31 and +0.08 V decrease with increasing V-content, an increase of the peaks at −0.12 and +0.39 V is observed. These findings imply that the peaks at +0.32 and −0.12 V belong to the reduction of the different vanadium species. The other listed peaks in the potential range from +0.16 to −0.60 V refer to the reduction of molybdenum. Due to the overlapping electrochemical features of different vanadium and molybdenum species, an exact assignment of the individual species renders, however, rather complicated.
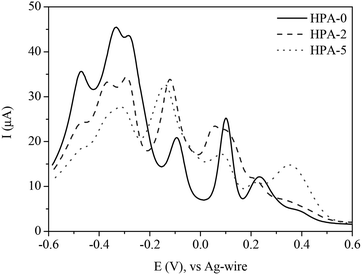 | ||
| Fig. 8 Square wave voltammograms of HPA-n (n = 0, 2, 5) in hydrochloric aqueous solution (pH = 1.0); potential range: +0.6 to −0.6 V. | ||
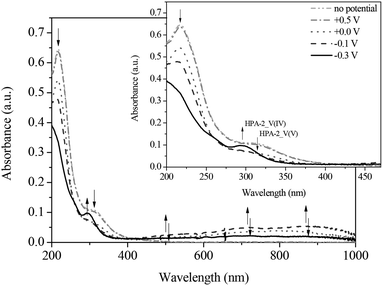
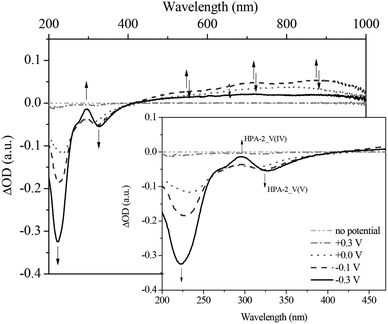
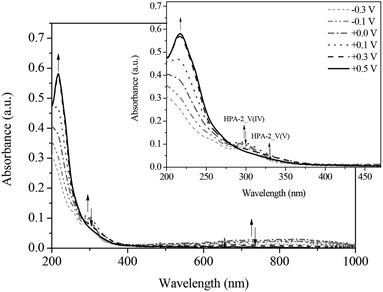
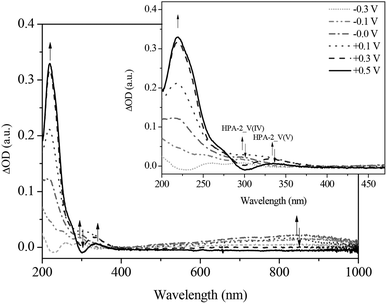
To gain a deeper understanding into the redox processes of the different HPA-n catalysts, we also used in situ UV-Vis electrochemistry as a further characterization technique. The respective catalyst was reduced by applying a defined voltage and simultaneously, the corresponding absorption spectra were recorded. Fig. 9 and 10 show the UV-Vis spectra of the spectroelectrochemical measurements of HPA-2 in hydrochloric aqueous solution in the potential range from +0.50 to −0.40 V as well as the corresponding differential spectra.
By applying the required potentials for the reduction of Mo(VI) and V(V) several changes in the optical features of HPA-2 could be observed. Concerning the ligand-to-metal-charge-transfer (LMCT) region of HPA-2 between 200 and 500 nm, a decrease of the absorption bands at 217 and 330 nm as well as the formation of a new absorption band at around 300 nm is observed (Fig. 9 and 10). The described alterations are attributable to the reduction of V(V) and Mo(VI) in the heteropolyacid cage. Especially the decrease of the band at 310 nm and the simultaneous formation of a new band at 300 nm (Fig. 10) can be assigned to the reduction of V(V) to V(IV) within the Keggin structure.76,77
In the spectroscopic region between 500 and 1000 nm reduced vanadium and molybdenum exhibit characteristic intervalence-charge-transfer-bands (IVCT), which could also be recorded during the spectroelectrochemical measurements. The spectra show the formation of a broad peak at around 700 nm indicating the hetero-IVCT of a V–O–Mo group with a weak contribution of the Mo(V) transition system. Another broad peak around 860 nm is characteristic for the homo-IVCT of Mo–O–Mo.77 The spectral changes in the IVCT region occur at the same applied potential as the changes in the LMCT region. This confirms V(V) and Mo(VI) reduction within the structure.
Fig. 11 and 12 show the spectral changes during the re-oxidation of the afore-reduced HPA-2. The observable recovery and backshift of the LMCT band at 217 nm as well as the decrease of the homo-IVCTs of Mo–O–Mo confirm the reversibility of the reduction of Mo(VI) to Mo(V). Also the decrease of the hetero-IVCT of V–O–Mo and a poor increase of the LMCT band around 330 nm could be observed by applying a voltage of 0.30 V. Since the increase of the LMCT band is only minimal, it can be concluded that the re-oxidation of V(IV) to V(V) in a purely electrochemical manner is at best quasi-reversible due to partially decomposing HPA-2 to afford species with lower vanadium content.78
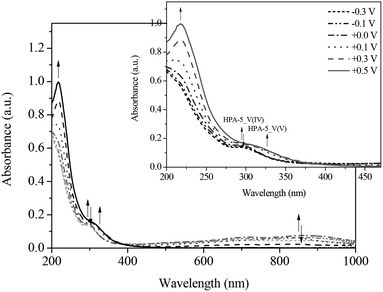
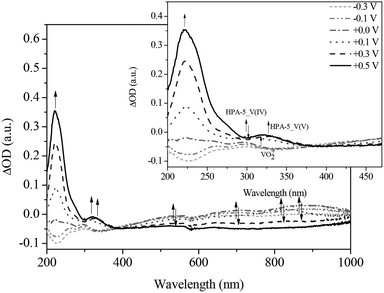
Similarly, HPA-5 as a higher substituted catalyst was investigated by spectroelectrochemistry under the same conditions and the results were compared. The spectra of the HPA-5 catalyst during reduction show the same trends regarding the LMCT and IVCT bands. Notably, the individual LMCT bands of HPA-5 are significantly broader and less resolved compared to those of HPA-2 (see ESI†). A likely reason is the lower stability of HPA-5 in comparison with HPA-2 and consequentially, the decomposition of the catalyst into less V-substituted species (HPA-n with n = 1–4) under the applied electrochemical conditions.
During the gradual re-oxidation (Fig. 13 and 14) of V(IV) to V(V) in HPA-5, a decrease of the band at 300 nm and an increase of the band at 330 nm is discernable at a voltage of 0.30 V indicating the partial re-oxidation of V(IV) to V(V). Moreover, the formation of a band at 325 nm is seen upon applying a potential of 0.50 V. This new absorption band belongs to the previously mentioned vanadium-peroxo species and reflects the release of vanadium from the heteropolyacid cage into the aqueous solution.78
Thus, we could unambiguously demonstrate that the dissociation of HPA-5 to the pervanadyl cation and different peroxo species is the crucial point for its observed enhanced catalytic activity compared to HPA-2. Obviously, HPA-5 combines a fast oxidation of the substrate, on the one hand, with an efficient re-oxidation behaviour, on the other hand.
To round-up our study we probed the so-optimized polyoxometalate HPA-5 in the transformation of all main components of lignocellulosic biomass. The conversion of cellulose, xylan (hemicellulose) and lignin with TSA as an additive was performed for 24 hours reaction time. As cellulose feedstock we used Vitacel L600 powdered cellulose from J. Rettenmaier & Söhne & Co. GmbH with a purity of 98%+. The C, H, N, S elemental analysis gave a molecular composition of C1.07H1.88O1. The applied hemicellulose (xylan from birchwood) was of 95%+ purity and is commercially available from Carl Roth GmbH. Its molecular composition was determined as C0.99H1.76O1. The lignin was purchased from Sigma Aldrich (alkali, low sulfonate content) and has a purity of 95%+. Its molecular composition as determined by elemental analysis was C1.70H1.84O1.
The reaction time compared to the conversion of glucose (Table 3) was extended to allow more time for acid hydrolysis of the water-insoluble substrates to water-soluble fragments through the additive TSA. The results of these experiments in comparison with former HPA-2 catalyzed conversion of the same substrates25 are summarized in Table 4.
| No. | Substrate | Catalyst | Molecular compositionc | Combined yield FA + CO2d (%) | Selectivity FA![[thin space (1/6-em)]](https://www.rsc.org/images/entities/char_2009.gif) : :![[thin space (1/6-em)]](https://www.rsc.org/images/entities/char_2009.gif) CO2d (%) CO2d (%) |
|---|---|---|---|---|---|
| Reaction conditions:a 100 mmol substrate, 20 mmol TSA as an additive, 1.82 g (1 mmol) HPA-5 resp.b 90 mmol substrate, 17 mmol TSA as an additive, 1.74 g (0.9 mmol) HPA-2 catalyst; dissolved in 100.0 mL H2O, 30 bar O2, 90 °C, 24 h, 1000 rpm in 600 ml autoclave.c Determined via C, H, N, S elemental analysis.d Yields and selectivity determined by means of 1H-NMR using benzene as an external standard. | |||||
| 1 | Cellulosea | HPA-5 | C1.07H1.88O1 | 76 | 37![[thin space (1/6-em)]](https://www.rsc.org/images/entities/char_2009.gif) : :![[thin space (1/6-em)]](https://www.rsc.org/images/entities/char_2009.gif) 63 63 |
| 2 | Celluloseb | HPA-2 | C1.07H1.88O1 | 39 | 48![[thin space (1/6-em)]](https://www.rsc.org/images/entities/char_2009.gif) : :![[thin space (1/6-em)]](https://www.rsc.org/images/entities/char_2009.gif) 52 52 |
| 3 | Lignina | HPA-5 | C1.70H1.84O1 | 100 | 32![[thin space (1/6-em)]](https://www.rsc.org/images/entities/char_2009.gif) : :![[thin space (1/6-em)]](https://www.rsc.org/images/entities/char_2009.gif) 68 68 |
| 4 | Ligninb | HPA-2 | C1.70H1.84O1 | 95 | 33![[thin space (1/6-em)]](https://www.rsc.org/images/entities/char_2009.gif) : :![[thin space (1/6-em)]](https://www.rsc.org/images/entities/char_2009.gif) 67 67 |
| 5 | Xylana | HPA-5 | C0.99H1.76O1 | 100 | 58![[thin space (1/6-em)]](https://www.rsc.org/images/entities/char_2009.gif) : :![[thin space (1/6-em)]](https://www.rsc.org/images/entities/char_2009.gif) 42 42 |
| 6 | Xylanb | HPA-2 | C0.99H1.76O1 | 97 | 55![[thin space (1/6-em)]](https://www.rsc.org/images/entities/char_2009.gif) : :![[thin space (1/6-em)]](https://www.rsc.org/images/entities/char_2009.gif) 45 45 |
The results clearly show that all the three main components can be converted selectively to FA and CO2 both with HPA-2 and HPA-5 catalysts in very high yields. The observed FA yield from cellulose after 24 h was increased from 19% (HPA-2)25 to 28% (HPA-5). Note that the selectivity of the oxidation of cellulose is not independent of conversion. The gradual degradation of the substrate's carbon framework inplicates that carbon functionalities leading preferentially to FA formation are oxidised first. For lignin and xylan oxidation, HPA-5 also shows higher activities than HPA-2. The overall effect is, however, less pronounced after 24 h reaction time. The major advantage for converting water-insoluble lignocellulosic biomass with HPA-5 instead of HPA-2 is the fact that the higher V substituted catalyst can be completely re-oxidized at 30 bar oxygen pressure and, in turn, the rate-determing step is still the biomass oxidation to FA. For the HPA-2 catalyst, this is not the case at 30 bar oxygen pressure – a finding that is concluded from the dark green colour of partially reduced V-species in the solution. Consequentially, the rate-determining step in the case of biomass conversion catalyzed by HPA-2 is the re-oxidation of the catalyst. The HPA-5 catalyst proved its superior performance also with lignocellulosic substrates underlining its potential for selective biomass oxidation to FA with enhanced space-time-yields.
Conclusions
We have synthesised a series of different heteropolyacids of the general type H3+n[PVnMo12−nO40] (n = 0–6) and tested them as homogeneous catalysts in the selective oxidation of biomass to formic acid. For the higher V-substituted complexes (n = 4–6) we could develop an improved synthetic method. All complexes were successfully characterised via ICP- and NMR-analysis. A screening of all POM complexes with glucose as a substrate confirmed the general reactivity of all complexes. Nevertheless, the higher V-substituted complexes (n = 2–6) showed far better activities than the lower V-substituted complexes (n = 0–1). To explain this trend, the best system, HPA-5, was compared to the lowest V-substituted system of good activity, HPA-2, using different optical and electrochemical methods.As the most important result of the spectroelectrochemical investigations the formation of the pervanadyl species was only discernable for the higher V-substituted species HPA-5. According to our mechanistic interpretation this species is responsible for the observed enhanced catalytic activity. As such, we have shed new light on the mechanism of the POM catalysed oxidation of biomass and have linked different catalytic activities to the vanadium content in catalytic POM complexes.
In the end, we could demonstrate superior catalytic performance of the optimized HPA-5 in the conversion of all main components of lignocellulosic biomass. HPA-5 enables higher space-time-yields compared to HPA-2 allowing a reduced reactor size and lower pressure level at the same catalytic productivity of real biomass oxidation to FA.
Experimental details
All reagents and substrates were commercially available and used as received. The model substrate glucose was supplied by Merck KGaA and the model substrate cellulose was purchased from J. Rettenmaier & Söhne & Co. GmbH. The TSA additive for cellulose conversion was obtained from Alfa Aesar. Elementary analysis of the cellulose substrate was performed using a Euro Vector EA 3000. Gaseous product analyses were performed using a Varian GC 450 equipped with a 2 m × 0.75 mm ID Shin Carbon ST column. Thermogravimetric analyses (TGA) were conducted using a SETSYS-1750 CS Evolution from SETARAM Instruments. For these investigations, 80 mg of the substance were weighed into a quartz crucible, heated at a constant rate of 10 °C min−1 up to 350 °C and kept there for 20 min. Helium was used as a carrier gas. pH measurements were performed at 20 °C with a Blueline 18 pH electrode from Schott Instruments Type GC 842 with an accuracy of ±0.01.Catalytic oxidation reactions (results of Tables 3 and 4)
The oxidation reactions were carried out in a 600 mL Hastelloy C276 autoclave equipped with a gas entrainment impeller. Water (100.0 mL), POM-catalyst (0.8 mmol) and the substrate (5.0 g) were charged into the apparatus. The system was purged with oxygen (2 times), then the stirrer was set to 300 rpm and heating was switched on. When the reaction temperature of 90 °C was reached, the oxygen pressure was adjusted to 30 bar and the stirrer was set to 1000 rpm.For the determination of FA yield and FA selectivity it is important to note that only two detectable C1-products, FA and CO2, were found in the system after reaction. The mass balance of the transformation could be closed by using NMR- and GC-results. The yield of FA was determined by means of 1H-NMR using benzene as an external standard and was calculated as YFA = n(FA)/n(C-atoms feedstock). The yield of CO2 was determined by means of GC-analysis and was calculated as YCO2 = n(CO2)/n(C-atoms feedstock). The combined yield FA + CO2 was calculated by n(FA) + n(CO2)/n(C-atoms feedstock).
Inductive coupled plasma (ICP-OES)
The ICP-OES measurements were conducted using a Perkin Elmer Plasma 400 by dissolving ca. 20 mg of the HPA-n catalyst in 250 mL of double distilled water. For calibration on phosphorus, molybdenum and vanadium, ICP-standard solutions (1000 μg mL−1) were used.Nuclear magnetic resonance (NMR) spectroscopy
The NMR spectra were recorded using a Jeol ECX-400 MHz spectrometer (9.4 Tesla) at 293 K. The 31P NMR spectra were recorded at 161.98 MHz with 512 scans at a range of −7 to +5 ppm, resulting in a resolution of 0.24 Hz. The field frequency stabilization was locked to deuterium by placing a coaxial inner tube with 1 wt% H3PO4 in D2O into a 5 mm tube containing the sample. The 51V NMR spectra were measured with 2024 scans in a range of −580 to −460 ppm with an excitation frequency of 105.25 MHz and a resolution of 0.77 Hz. The field frequency stabilization was locked to deuterium by placing a coaxial inner tube with D2O into a 10 mm tube containing the sample.Optical spectroscopy
Infrared spectra of the solid catalysts were recorded using FT-IR spectrophotometer Shimadzu Prestige-21 in combination with a diamond crystal ATR unit (L.O.T., Golden Gate) between 4000 and 500 cm−1 region. Steady state UV-Vis measurements of the catalysts in hydrochloric aqueous solution were performed using a Specord S 600 UV-Vis spectrometer (Analytic Jena) at room temperature in a 10 × 10 mm quartz cuvette between 200 and 1000 nm.Electrochemistry
Electrochemical data were obtained by cyclic voltammetry and square wave voltammetry using a FRA 2 μAutolab Type III Potentiostat/Galvanostat (with impedance unit) (Metrohm). The usual three-electrode arrangement included a glassy carbon electrode as a working electrode, Pt wire as a counter electrode and a silver wire as a pseudo reference electrode, see ESI.† The different voltammetric measurements were carried out in argon saturated hydrochloric-aqueous solution in a potential range between −0.60 and +1.00 V.In situ UV-Vis electrochemistry
Spectroelectrochemical experiments were carried out using a PGSTAT 101 (Metrohm) and a Specord S 600 UV-Vis spectrometer (Analytic Jena). The measurements were performed in a quartz glass cuvette with an optical path length 1.0 mm in hydrochloric-aqueous solution under argon atmosphere. Light-transparent platinum gauze served as a working electrode, a silver wire as a reference electrode and a platinum wire as a counter electrode.Acknowledgements
The authors like to thank Dr Nicola Taccardi for performing the ICP measurements. Additionally, we have to thank Patrick Preuster and Stephanie Bajus for performing TGA analysis. The Energie Campus Nürnberg is gratefully acknowledged for financial support.Notes and references
- G. Huber, S. Iborra and A. Corma, Chem. Rev., 2006, 106, 4044 CrossRef CAS PubMed.
- D. Alonso, J. Bond and J. Dumesic, Green Chem., 2010, 12, 1493 RSC.
- J. Chheda, G. Huber and J. Dumesic, Angew. Chem., Int. Ed., 2007, 46, 7164 CrossRef CAS PubMed.
- R. Palkovits, K. Tajvidi, A. Ruppert and J. Procelewska, Chem. Commun., 2011, 47, 576 RSC.
- D. Klemm, B. Heublein, H. Fink and A. Bohn, Angew. Chem., Int. Ed., 2005, 44, 3358 CrossRef CAS PubMed.
- M. Holm and S. Saravanamurugan, Science, 2010, 328, 602 CrossRef CAS PubMed.
- P. Dhepe and A. Fukuoka, ChemSusChem, 2008, 1, 969 CrossRef CAS PubMed.
- C. Tuck, E. Pérez, I. Horváth, R. Sheldon and M. Poliakoff, Science, 2012, 337, 695 CrossRef CAS PubMed.
- J. Geboers, S. van de Vyver, K. Carpentier, P. Jacobs and B. Sels, Green Chem., 2011, 13(8), 2167 RSC.
- Y. Ogasawara, S. Itagaki, K. Yamaguchi and N. Mizuno, ChemSusChem, 2011, 4(4), 519 CrossRef CAS PubMed.
- B. Op de Beeck, J. Geboers, S. van de Vyver, J. Van Lishout, J. Snelders, W. Huijgen, C. Courtin, P. Jacobs and B. Sels, ChemSusChem, 2013, 6, 199 CrossRef CAS PubMed.
- J. Geboers, S. van de Vyver, K. Carpentier, K. de Blochouse, P. Jacobs and B. Sels, Chem. Commun., 2010, 46, 3577 RSC.
- L. Wang, C. L. Weller, D. D. Jones and M. A. Hanna, Biomass Bioenergy, 2008, 32, 573 CrossRef CAS PubMed.
- M. M. Yung, W. S. Jablonski and K. A. Magrini-Bair, Energy Fuels, 2009, 23, 1874 CrossRef CAS.
- A. A. Petersen, F. Vogel, R. P. Lachance, M. Froling, J. M. Antal and J. W. Tester, Energy Environ. Sci., 2008, 1, 32 Search PubMed.
- L. J. Guo, Y. J. Lu, X. M. Zhang, C. M. Ji, Y. Guan and A. X. Pei, Catal. Today, 2007, 129, 275 CrossRef CAS PubMed.
- R. R. Davda, J. W. Shabaker, B. W. Huber, R. D. Cortright and J. A. Dumesic, Appl. Catal., B, 2005, 56, 171 CrossRef CAS PubMed.
- B. M. Kabyemela, T. Adschiri, R. M. Malaluan and K. Arai, Ind. Eng. Chem. Res., 1999, 38, 2888 CrossRef CAS.
- A. Kruse and A. Gawlik, Ind. Eng. Chem. Res., 2002, 42, 267 CrossRef.
- S. van de Vyver, J. Geboers, P. Jacobs and B. Sels, ChemCatChem, 2011, 3, 82 CrossRef CAS.
- H. Kobayashi, H. Ohta and A. Fukuoka, Catal. Sci. Technol., 2012, 2, 869 CAS.
- J. Geboers, S. van de Vyver, R. Ooms, B. Op de Beeck, P. Jacobs and B. Sels, Catal. Sci. Technol., 2011, 1, 714 Search PubMed.
- H. Kobayashi and A. Fukuoka, Green Chem., 2013, 15, 1740 RSC.
- R. Wölfel, N. Taccardi, A. Bösmann and P. Wasserscheid, Green Chem., 2011, 13, 2759 RSC.
- J. Albert, R. Wölfel, A. Bösmann and P. Wasserscheid, Energy Environ. Sci., 2012, 5, 7956 CAS.
- W. Reutemann and H. Kieczka, in Ullmann's Encyclopedia of Industrial Chemistry, Wiley-VCH Verlag GmbH & Co. KGaA, Weinheim, 2005 DOI:10.1002/14356007.a12_013.
- F. S. Dickson, J. Bakker and A. Kitai, “Acedic Acid” in Chemical Economics Handbook, 1982 Search PubMed.
- W. Leitner, Angew. Chem., 1995, 107, 2391 CrossRef.
- N. Taccardi, D. Assenbaum, M. E. M. Berger, A. Bösmann, F. Enzenberger, R. Wölfel, S. Neuendorf, V. Goeke, N. Schödel, H. J. Maass, H. Kistenmacher and P. Wasserscheid, Green Chem., 2010, 12, 1150 RSC.
- G. Mc Ginnis, S. Prince, C. Biermann and J. Lowrimore, Carbohydr. Res., 1984, 128, 51 CrossRef CAS.
- K. Niemelä, Biomass, 1988, 15, 223 CrossRef.
- D. Yu, M. Aihara and M. Antal, Energy Fuels, 1993, 7, 574 CrossRef CAS.
- F. Jin, J. Yun, G. Li, A. Kishita, K. Tohji and H. Enomoto, Green Chem., 2008, 10, 612 RSC.
- J. Li, D. J. Ding, Q. X. Guo and Y. Fu, ChemSusChem, 2012, 5, 1313 CrossRef CAS PubMed.
- A. Boddien, F. Gärtner, R. Jackstell, H. Junge, A. Spannenberg, W. Baumann, R. Ludwig and M. Beller, Angew. Chem., 2010, 122, 9177 CrossRef.
- A. Boddien, D. Mellmann, F. Gärtner, R. Jackstell, H. Junge, P. Dyson, G. Laurenczy, R. Ludwig and M. Beller, Science, 2011, 333, 1733 CrossRef CAS PubMed.
- M. Jitaru, J. Univ. Chem. Technol. Metall., 2007, 4, 333 Search PubMed.
- S. Enthaler, J. von Langermann and T. Schmidt, Energy Environ. Sci., 2010, 3, 1207 CAS.
- A. Boddien, B. Loges, H. Junge and M. Beller, ChemSusChem, 2008, 1, 751 CrossRef CAS PubMed.
- C. Federsel, A. Boddien, R. Jackstell, R. Jennerjahn, R. Dyson, R. Scopellitti, G. Laurenczy and M. Beller, Angew. Chem., Int. Ed., 2010, 49, 9777 CrossRef CAS PubMed.
- S. Fukuzumi, T. Kobayashi and T. Suenobu, J. Am. Chem. Soc., 2010, 132, 1496–1497 CrossRef CAS PubMed.
- A. M. Khenkin and R. Neumann, J. Am. Chem. Soc., 2008, 130, 14474 CrossRef CAS PubMed.
- I. Kozhevnikov, Chem. Rev., 1998, 98, 171 CrossRef CAS PubMed.
- F. Joó, ChemSusChem, 2008, 1, 805 CrossRef PubMed.
- M. Pope and A. Müller, Angew. Chem., Int. Ed. Engl., 1991, 30, 34 CrossRef.
- N. Mizuno and M. Misono, Chem. Rev., 1998, 98, 199 CrossRef CAS PubMed.
- D. Long, R. Tsunashima and L. Cronin, Angew. Chem., Int. Ed., 2010, 49, 1736 CrossRef CAS PubMed.
- C. Streb, Dalton Trans., 2012, 41, 1651 RSC.
- W. Deng, Q. Zhang and Y. Wang, Dalton Trans., 2012, 41, 9817 RSC.
- A. Shatalov, D. Evtuguin and P. Neto, Carbohydr. Polym., 2000, 43, 23 CrossRef CAS.
- E. G. Zhizhina, V. F. Odyakov, M. V. Simonova and K. I. Matveev, Kinet. Catal., 2005, 46, 345 CrossRef.
- D. V. Evtuguin, C. P. Neto, J. rocha and J. D. Pedrosa de Jesus, Appl. Catal., A., 1998, 167, 123 CrossRef CAS.
- G. A. Tsigdinos and C. J. Hallada, Inorg. Chem., 1968, 7, 437 CrossRef CAS.
- J. H. Grate, J. Mol. Catal. A: Chem., 1996, 114, 93 CrossRef CAS.
- V. F. Odyakov, E. G. Zhizhina, R. I. Maksimovskaya and K. I. Matveev, Russ. J. Inorg. Chem., 1998, 43, 1338 Search PubMed.
- I. G. Kolesik, E. G. Zhizhina and K. I. Matveev, J. Mol. Catal. A: Chem., 2000, 153, 147 CrossRef.
- V. F. Odyakov and E. G. Zhizhina, React. Kinet. Catal. Lett., 2008, 95(1), 21 CrossRef CAS.
- H. G. Jerschkewitz, E. Alsdorf h. Fichtner, W. Hanke, K. Jancke and G. Öhlmann, Z. Anorg. Allg. Chem., 1985, 526, 73 CrossRef CAS.
- P. Souchay, F. Chauveau and P. Courtin, Bull. Soc. Chim. Fr., 1968, 6, 2384 Search PubMed.
- L. Pettersson, I. Andersson, J. Grate and A. Selling, Inorg. Chem., 1994, 33, 982 CAS.
- O. A. Kholdeeva, A. V. Golovin, R. I. Maksimovskaya and I. V. Kozhevnikov, J. Mol. Catal., 1992, 75, 235 CrossRef CAS.
- M. A. Fedotov and R. I. Maksimovskaya, J. Struct. Chem. Engl. Trans., 2006, 47, 952 CrossRef CAS.
- X. K. Li, J. Zhao, W. J. Ji, Z. B. Zhang, Y. Chen, C. T. Au, S. Han and H. Hibst, J. Catal., 2006, 237, 58 CrossRef CAS PubMed.
- J. E. Molinari, L. Nakka, T. Kim and I. E. Wachs, ACS Catal., 2011, 1, 1536 CrossRef CAS.
- C. Rocchiccioli-Deltcheff and M. Fournier, J. Chem. Soc., Faraday Trans., 1991, 87(24), 3913 RSC.
- P. Villabrille, G. Romanelli, P. Vázquez and C. Cáceres, Appl. Catal., A, 2004, 270, 101 CrossRef CAS PubMed.
- B. B. Bardin and R. J. Davis, Appl. Catal., A, 1999, 185, 283 CrossRef CAS.
- K. T. Venkateswara Rao, P. S. N. Rao, P. Nagaraju, P. S. Sai Prasad and N. Lingaiah, J. Mol. Catal. A: Chem., 2009, 303, 84 CrossRef PubMed.
- I. Kozhevnikov, J. Mol. Catal. A: Chem., 1997, 117, 151 CrossRef CAS.
- D. P. Smith and M. T. Pope, Inorg. Chem., 1973, 20(2), 331 CrossRef.
- I. Kozhevnikov and K. I. Matveev, Appl. Catal., 1983, 5, 135 CrossRef CAS.
- V. F. Odyakov, L. I. Kuznetsova and K. I. Matveev, Zh. Neorg. Khim., 1978, 23, 457 CAS.
- K. R. Murmann and K. C. Giese, Inorg. Chem., 1978, 17(5), 1160 CrossRef.
- A. M. Khenkin, A. Rosenberger and R. Neumann, J. Catal., 1999, 182, 82 CrossRef CAS.
- S. Tangestaninejad, V. Mirkhani, M. Moghadam, I. Mohammadpoor-Baltork, E. Shams and H. Salavati, Ultrason. Sonochem., 2008, 15, 438 CrossRef CAS PubMed.
- I. Kitazumi, Y. Nakashami and S. Himeno, J. Chromatogr., A, 2001, 939, 123 CrossRef CAS.
- J. K. Lee, J. Melsheimer, S. Berndt, G. Mestl, R. Schlögl and K. Köhler, Appl. Catal., A, 2001, 214, 125 CrossRef CAS.
- J. Arichi, M. Eternot and B. Louis, Catal. Today, 2008, 138, 117 CrossRef CAS PubMed.
Footnote |
| † Electronic supplementary information (ESI) available: NMR, UV-Vis and electrochemical spectra recorded from the different HPA-complexes. See DOI: 10.1039/c3gc41320a |
| This journal is © The Royal Society of Chemistry 2014 |


