 Open Access Article
 This Open Access Article is licensed under a
 Creative Commons Attribution 3.0 Unported Licence
How fast can a Peierls–Mott insulator be melted?
C.
Sohrt
,
A.
Stange
,
M.
Bauer
and
K.
Rossnagel
*
Institut für Experimentelle und Angewandte Physik, Christian-Albrechts-Universität zu Kiel, D–24098 Kiel, Germany
First published on 7th May 2014
Abstract
Time- and angle-resolved extreme ultraviolet photoemission spectroscopy is used to directly determine the momentum-dependent electronic structure dynamics in the layered Peierls–Mott insulators 1T-TaS2 and 1T-TaSe2 on the sub-300 fs time scale. Extracted spectroscopic order parameters display a global two-time-scale dynamics indicating a quasi-instantaneous loss of the electronic orders and a subsequent coherent suppression of the lattice distortion on a time scale related to the frequency of the charge-density–wave amplitude mode. After one half-cycle of coherent amplitude-mode vibration, a crossover state between insulator and metal with partially filled-in and partially closed Mott and Peierls gaps is reached. The results are discussed within the wider context of electronic order quenching in complex materials.
I. Introduction
Complex materials, in which electron–electron and electron–lattice interactions are strong, exhibit some of the most intriguing phenomena in the quantum world, including (high-temperature) superconductivity, metal–insulator transitions, and ordering phenomena involving charge, orbital, spin, and lattice degrees of freedom.1 Most of our knowledge and microscopic understanding of complex materials and their phenomena has been obtained from experimental and theoretical techniques that are applied in or near equilibrium. The non-equilibrium dynamics of complex materials, by contrast, is much less understood, yet powerful techniques and impressive results are emerging.2–13The most important experimental approach to the non-equilibrium regime is by techniques that combine two ultrashort pulses: one for pump excitation of the material and the other as a time-delayed probe. For pumping, near-infrared laser pulses are most commonly used. For probing, photon pulses in the THz to hard X-ray spectral range and electron pulses with energies of a few 10 keV are now almost routinely applied. Thus, many powerful and complementary techniques have been implemented, including time-resolved optical and photoemission spectroscopy14,15 as well as time-resolved X-ray and electron diffraction.16
With effective temporal resolutions of a few 10 fs, these techniques offer a new perspective on complex materials because they can resolve electron and lattice dynamics at or close to the fundamental time scales of electronic processes and ionic motion in solids. The direct dynamical information can be used to temporally dissect complex phases and identify—via temporal discrimination—the dominant degrees of freedom, order parameters, or interactions.17 In particular, due to their distinct characteristic time scales, it is almost straightforward to separate electron–electron from electron–phonon interaction effects and coherent from incoherent phonon processes. These capabilities can provide novel insights not only into complex phases but also into thermally accessible phase transitions.3–5,9,12 Moreover, pump–probe techniques can be used to investigate whether and to what extent phase transitions can be coherently controlled2,6,11 and novel or “hidden” phases can be created that are not thermally accessible.7,13
While there are now various experimental techniques available and many different complex materials have been studied, a few central recurrent questions have emerged in the field, namely: how fast and how are symmetry-broken states melted and restored? What is the nature of transient non-equilibrium states? And what can non-equilibrium dynamics teach us about the nature and origin of complex equilibrium phases?
In this work, we address these questions for a paradigmatic example, the layered Peierls–Mott insulators 1T-TaX2 (X = S or Se), in which a large-amplitude charge-density wave (CDW) brings on a Mott transition, i.e., electron–phonon and electron–electron interaction are simultaneously strong.18–20 The materials serve as a good reference because the ground state is sufficiently complex and generic, rather well understood, and its experimental signatures are strong. 1T-TaS2, in particular, has been extensively studied with time-resolved methods.5,13,17,21–27 Yet, the fundamental question about the speed and mechanism of the quenching of the combined Peierls–Mott-state after femtosecond laser excitation has not been investigated in depth.
Here, we use time- and angle-resolved photoemission spectroscopy (trARPES) with extreme ultraviolet (XUV) pulses from high-harmonic generation (HHG)9 to track the ultrafast quenching dynamics in 1T-TaX2 (X = S or Se). Time-resolved XUV-ARPES is the ideal tool because it combines the high time resolution needed to resolve electron dynamics with the high momentum resolution and coverage needed to probe “spectroscopic order parameters” at different momenta in the electronic structure. Our focus is on the early stages (<300 fs) of the dynamics, i.e., on the suppression rather than the reformation of electronic and lattice order.
Our results reveal a global two-time-scale dynamics of spectral weight and order-parameter transients indicating a quasi-instantaneous loss of Mott and CDW charge order and a subsequent coherent suppression of CDW lattice order on the time scale of the CDW amplitude mode. The resulting transient non-equilibrium state is characterized by filled-in and partially closed gaps at a relaxed periodic lattice distortion. The results are consistent with an explanation of the equilibrium Peierls–Mott state in 1T-TaX2 (X = S or Se) in terms of a linear cause-and-effect relationship where the Peierls distortion controls the critical parameters of the Mott transition. More generally, the present work provides evidence for a phenomenological hierarchy of the time scales of electronic order-parameter quenching.
II. Materials
1T-TaS2 and 1T-TaSe2 are isostructural layered compounds consisting of X–Ta–X (X = S and Se) sandwiches.28 Each atomic layer is hexagonally-packed, the coordination around each Ta atom is approximately octahedral, and the interaction between adjacent sandwiches is weak giving rise to highly anisotropic properties. Correspondingly, the electronic structure near the Fermi energy (EF) is quasi-two-dimensional. In 1T-TaS2, the band structure is made up of completely filled S 3p valence bands and a partially (nominally d1) filled Ta 5d band. The Fermi surface has elliptical electron pockets centered on the edges of the hexagonal Brillouin zone [Fig. 1(a)].19,29 The band structure and Fermi surface of 1T-TaSe2 are similar to the ones of 1T-TaS2, except that the hybridization between the Se 4p and Ta 5d orbitals is significantly stronger, possibly even resulting in a Fermi-level crossing of the uppermost Se 4p valence band.30,31 | ||
Fig. 1 Characteristic aspects of the lattice and electronic structure of 1T-TaS2 in connection with the commensurate  charge-density wave. (a) Brillouin zones in the normal (thick solid lines) and reconstructed (thin dashed lines) phases. The unreconstructed Ta 5d Fermi surface has elliptical pockets. Possible nesting vectors are indicated. (b) Unit cell of the periodic lattice distortion (thick lines) and “Star-of-David” clusters (thin lines) in the Ta plane. Arrows indicate the displacements of the Ta atoms from their original positions. (c) Simulated reconstructed band structure (left) and folded-out band structure (right) with Umklapp bands generated by translation through the reciprocal lattice vectors of the reconstructed phase. The spectral weight carried by the electronic states is indicated by the line thickness. (d) Measured ARPES band structure in the commensurate (left) and incommensurate (right) charge-density–wave phase (data recorded with hν = 96 eV at the indicated temperatures). Characteristic spectral signatures are labeled. Downward pointing arrows along the top axis denote the momenta at which previous trARPES measurements were performed.17,22,23,27 charge-density wave. (a) Brillouin zones in the normal (thick solid lines) and reconstructed (thin dashed lines) phases. The unreconstructed Ta 5d Fermi surface has elliptical pockets. Possible nesting vectors are indicated. (b) Unit cell of the periodic lattice distortion (thick lines) and “Star-of-David” clusters (thin lines) in the Ta plane. Arrows indicate the displacements of the Ta atoms from their original positions. (c) Simulated reconstructed band structure (left) and folded-out band structure (right) with Umklapp bands generated by translation through the reciprocal lattice vectors of the reconstructed phase. The spectral weight carried by the electronic states is indicated by the line thickness. (d) Measured ARPES band structure in the commensurate (left) and incommensurate (right) charge-density–wave phase (data recorded with hν = 96 eV at the indicated temperatures). Characteristic spectral signatures are labeled. Downward pointing arrows along the top axis denote the momenta at which previous trARPES measurements were performed.17,22,23,27 | ||
The elliptical Fermi-surface pockets are prone to nesting [arrows in Fig. 1(a)] which in both compounds promotes the formation of an incommensurate CDW (ICCDW) considerably above room temperature. At lower temperatures, the ICCDW transforms into a commensurate one, in 1T-TaS2via an intermediate nearly commensurate CDW phase. The corresponding transition temperatures are still high: ≈180–220 K for 1T-TaS2 and ≈470 K for 1T-TaSe2.28 Intriguingly, the appearance of the commensurate CDW (CCDW) is accompanied by a Mott transition in both compounds. However, transport and ARPES results indicate that only 1T-TaS2 becomes an insulator, whereas 1T-TaSe2 remains metallic.28,31 For 1T-TaSe2, it has been argued that the Mott transition is a surface effect.32,33
Our focus in this work is on the Peierls–Mott ground state. Fig. 1(b) depicts the characteristic periodic lattice distortion (PLD) in the Ta plane that comes along with the formation of the  CCDW. The basic motif is a “Star-of-David” cluster consisting of a central Ta atom surrounded by two concentric 6-Ta-atom rings that are contracted towards the center.34 The concomitant modulation of the conduction electron density involves electron transfer from the outer ring towards the inner atoms. The PLD and CDW amplitudes are remarkably large: ≈7% of the in-plane lattice constant34 and ≈0.5 electron per Ta atom,35 respectively.
Accordingly, the Ta 5d electronic structure is strongly reconstructed in the CCDW phase. As shown in Fig. 1(c) for the case of 1T-TaS2, the occupied part of the band structure is split into submanifolds: there are two low-lying three-band submanifolds each filled with six electrons and one distinct and narrow band at EF hosting the “13th” electron. Since this band has a small width <100 meV and is nominally half-filled, it is susceptible to a Mott–Hubbard transition.19 In the Mott state, the electrons are expected to localize preferentially on the central atom of the Star-of-David cluster.18,19 ARPES results have generally confirmed the CCDW-induced reconstruction of the band structure and the opening of the Mott gap predicted by theory.20,36–38Fig. 1(c) and (d) particularly show how well a simple tight-binding model can capture the spectral weight redistribution measured by ARPES.20
The static ARPES data of 1T-TaS2 shown in Fig. 1(d) (ref. 17 and 20) set the stage for the time-resolved experiments. There are three different types of spectral gaps that lend themselves as spectroscopic order parameters: the Mott gap ΔMott around Γ indicated by the spectral weight suppression between the lower Hubbard band (LHB) and EF, the CCDW gaps ΔCCDW,1 and ΔCCDW,2 corresponding to the breaks in the band dispersion at about  and
and  , and the nesting-induced ICCDW gap ΔICCDW that opens in the vicinity of the K–M–K line and projects into the CCDW phase.20 Complementary spectroscopic order parameters are the amounts of “coherent” spectral weight that are transferred from the gapped regions to the three submanifolds denoted LHB, B1, and B2 in Fig. 1(d). We note that momentum resolution and full Brillouin-zone coverage are essential to probe the various spectral signatures.
Previous time-resolved UV- and XUV-ARPES studies on the ultrafast quenching dynamics of the Peierls–Mott state in 1T-TaS2 were performed under moderate to strong excitation, with absorbed pump fluences ranging from 0.135 to 2.2 mJ cm−2.17,22,23,27 Spectroscopic order-parameter transients with single rise times were recorded at selected momenta. The focus was mostly on the time constants and not so much on the magnitude of relative intensity changes. Specifically, it was shown that ΔMott and ΔCCDW,1 are filled in on an electronic (<30 fs) time scale, while simultaneously the intensity of the LHB is suppressed.17,22,23,27 On the other hand, it was shown that a partial closing of ΔICCDW and intensity changes in the B1 manifold take place on a vibrational (≈200 fs) time scale related to the frequency of the CDW amplitude mode.17,27 1T-TaSe2 has so far not been investigated by trARPES. Yet, the material may be the better suited one because of a larger LHB distance to EF (ΔMott) and reduced complexity due to the absence of the nearly commensurate CDW phase.
III. Experiment
The trARPES experiments were performed in a pump–probe scheme with an experimental setup sketched in Fig. 2.39 The fundamental laser pulses were generated by a Ti:sapphire laser (KMLabs, Griffin) and amplified via a multipass configuration (KMLabs, Dragon) pumped by a Nd:YAG laser (Lee Laser, LDP-200MQG). The laser system was operated at a repetition rate of 8.2 kHz and delivered near-infrared (NIR) pulses at a photon energy of hν = 1.57 eV (λ = 790 nm) with 1 mJ pulse energy and 32 fs (FWHM) pulse duration. The laser output was split into pump and probe beams using a 10/90 beam splitter.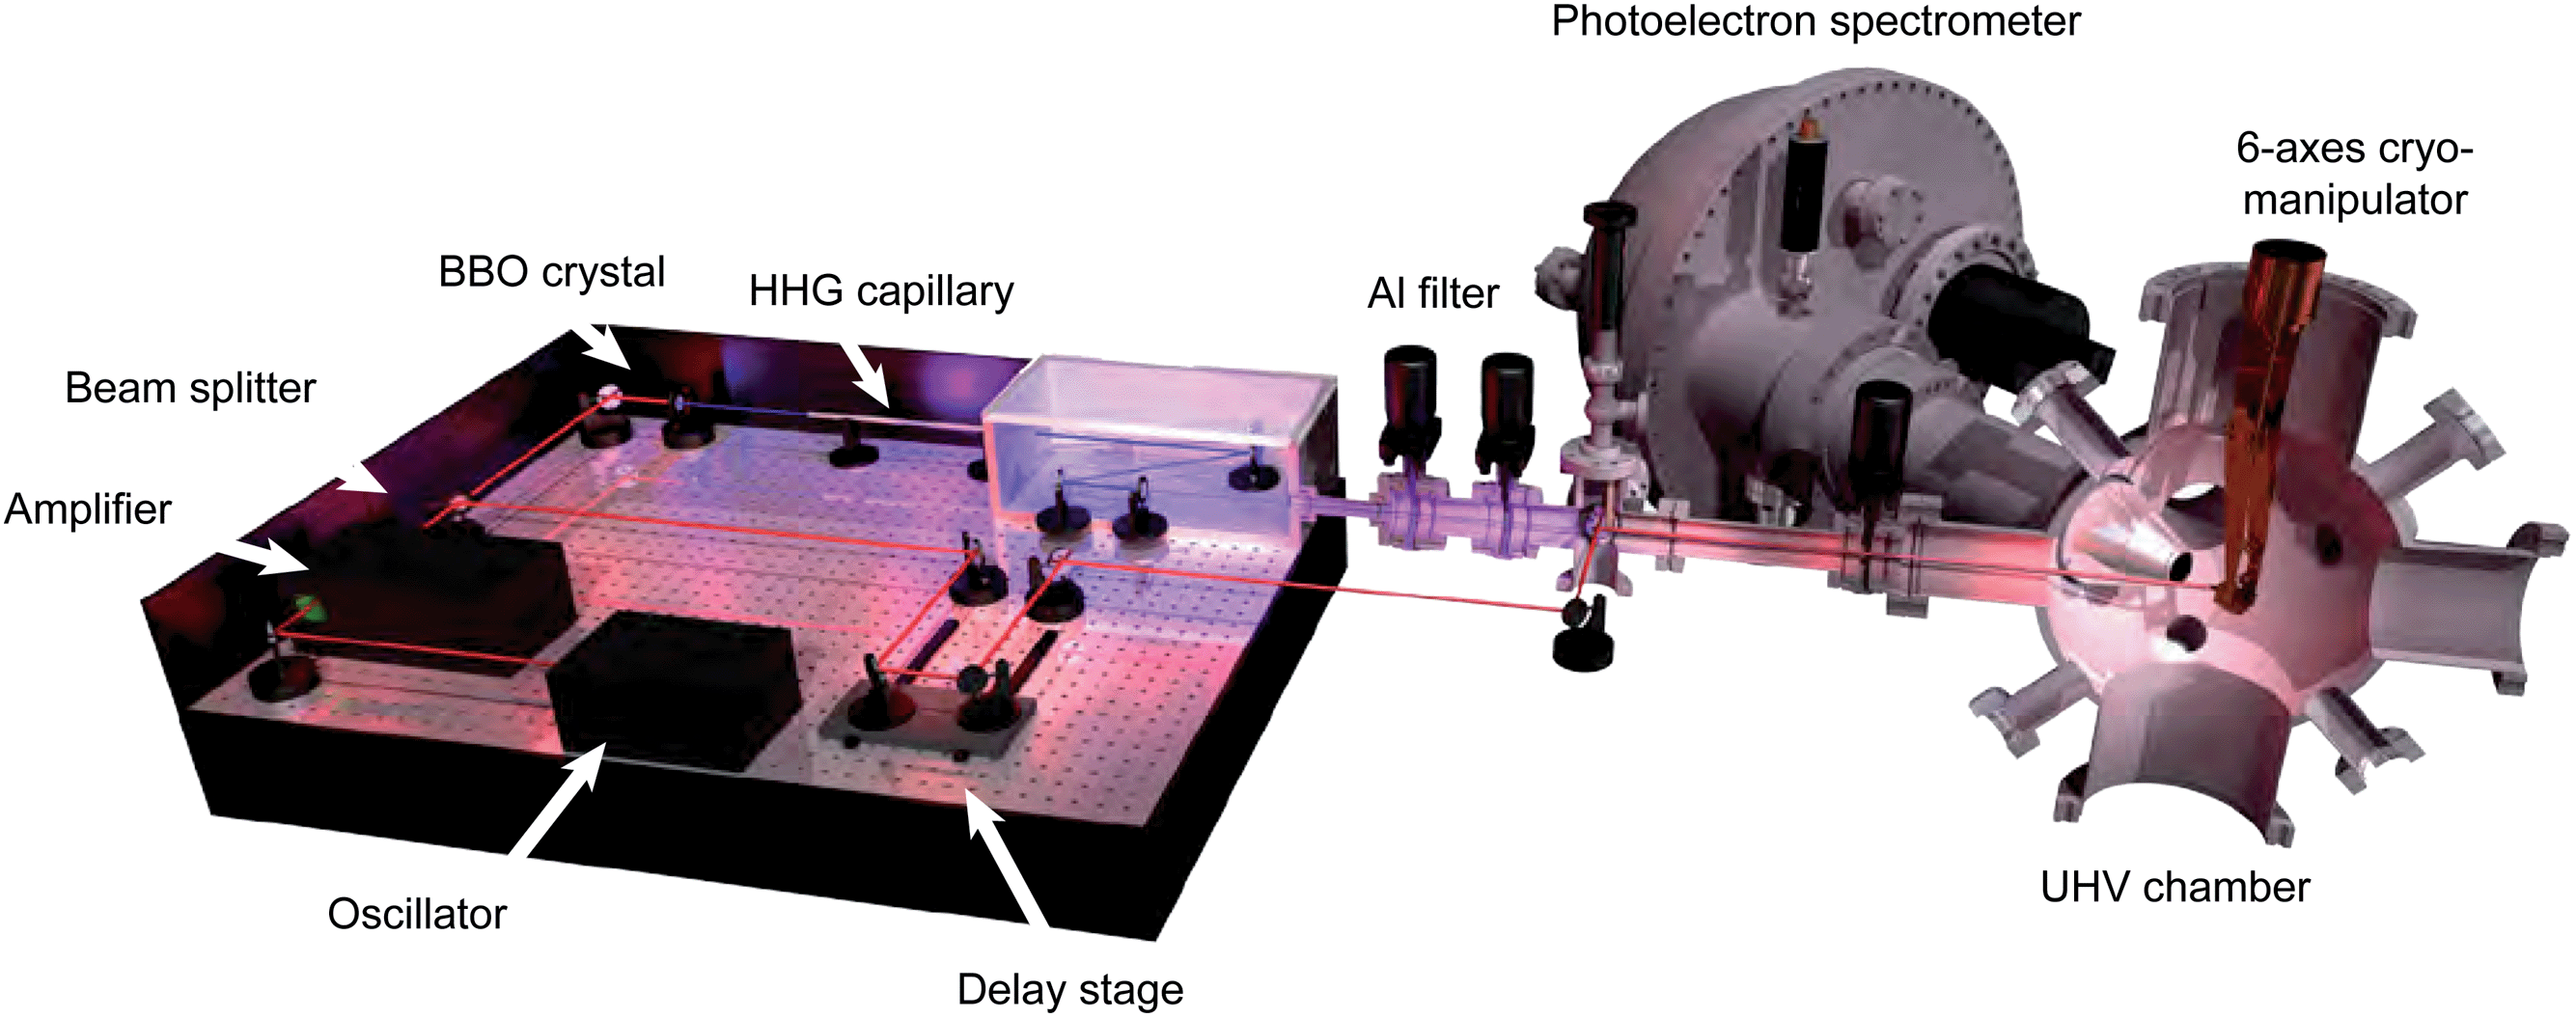 | ||
| Fig. 2 Schematic illustration of the experimental setup for time-resolved high-harmonic-generation-based XUV-ARPES. Key components are labeled. For details, see text. | ||
For photoexcitation of the samples, the fundamental of the laser was used in s-polarization. The pump intensity was adjusted using a variable neutral density filter in the pump line. The diameter of the pump beam at the sample was about 300 μm (FWHM).
The probe pulses were generated in two steps. The fundamental beam first passed a 200 μm thick beta-barium borate (BBO) crystal. The resulting second harmonic (hν = 3.14 eV, λ = 395 nm) was then focused into an argon-filled commercial high-harmonic-generation (HHG) source (KMLabs, XUUS).40 The delivered XUV pulses had a near-Gaussian beam profile, as verified by a beam profile analysis using an image intensifier. A 300 nm thick aluminum filter was used to block the residual fundamental of the laser transmitted through the HHG source. The XUV radiation was focused with a gold-coated toroidal mirror to a diameter of about 170 μm (FWHM) at the sample position, as estimated from the results of ray-tracing simulations. The factor-of-two reduction of spot size compared to the pump beam ensured that a homogeneously excited surface region was probed.
The 14th harmonic (hν = 22.1 eV) of the fundamental was used for the time-resolved measurements.41 The spectral width of the XUV pulses was measured to less than 170 meV employing a grating spectrometer. The temporal width was estimated from NIR–XUV cross-correlation measurements on the conduction-band population dynamics in a 1T-TiSe2 sample. The quantitative analysis of the intensity transients yielded an upper limit for the XUV pulse duration of 13 fs. The probe pulses were p-polarized.
Photoemission spectra were recorded at a base pressure of 3 × 10⁻¹⁰ mbar with a commercial hemispherical electron spectrometer (SPECS, Phoibos 150) equipped with a 2D detection unit for parallel measurement of energy and momentum of the emitted electrons. The total energy resolution achieved in the present study was about 260 meV, determined from Fermi-edge spectra of a polycrystalline gold sample. The angular resolution of the experiment was estimated to 1.5°.
1T-TaS2 and 1T-TaSe2 single crystals were grown from high-purity elements by chemical vapor transport using iodine as transport agent.42 Prior to the trARPES experiments, the sample quality was checked by electrical transport as well as high-resolution ARPES and XPS measurements. In the trARPES experiments, the samples were cleaved under ultrahigh vacuum conditions at room temperature using a scotch-tape method. During the trARPES measurements, the equilibrium sample temperature was 100 K.
IV. Results
The central results of our comparative trARPES study of the Peierls–Mott dynamics in 1T-TaS2 and 1T-TaSe2 are summarized in Fig. 3 and 4. Fig. 3 displays energy–momentum maps (top row) and energy–distribution curves (bottom row) collected at selected pump–probe delays near the center of the Brillouin zone of 1T-TaS2 (left column) and near the zone center and the zone edge of 1T-TaSe2 (right columns). Fig. 4 has the same column layout as Fig. 3 and shows the detailed time dependence of characteristic energy–distribution curves (top row) and order-parameter transients (bottom row). The electronic structure dynamics of 1T-TaS2 near the Brillouin-zone edge has previously been reported in ref. 17. It is not shown here because it is almost identical to the one of 1T-TaSe2.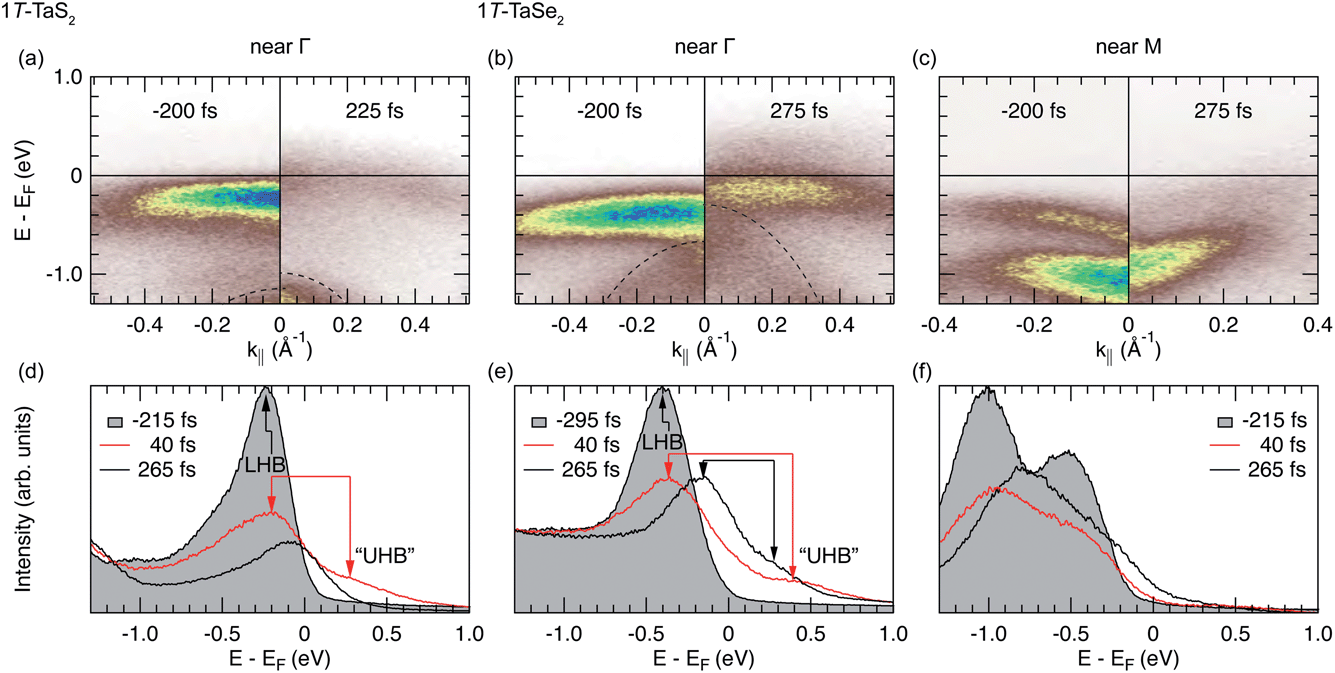 | ||
| Fig. 3 ARPES snapshots of the electronic structure dynamics in 1T-TaS2 near Γ (left column) and in 1T-TaSe2 near Γ (middle column) and M (right column) (T = 100 K, Fabs = 3.5 mJ cm−2, hνprobe = 22.1 eV). (a–c) Band maps before and after pumping acquired (a), (b) along the Γ–M line and (c) along the M–K line. Dashed lines in (a) and (b) are guides to the eye for the dispersion of the top of the chalcogen valence band. (d–e) Momentum-integrated energy–distribution curves at selected pump–probe delays, as obtained from band maps of the same data sets that the maps in (a–c) were taken from. | ||
 | ||
| Fig. 4 Time-dependent spectral weight dynamics in 1T-TaS2 near Γ (left column) and in 1T-TaSe2 near Γ (middle column) and M (right column) (T = 100 K, hνprobe = 22.1 eV). (a–c) Momentum-integrated energy–distribution curves as a function of pump–probe delay (Fabs = 3.5 mJ cm−2). Black dots track the time dependence of the center of mass of the spectral weight distribution. (d–e) Photoemission intensity averaged over energy intervals connected with the spectral gaps at EF (upper panels) and the photoemission peaks (lower panels) (Fabs = 1.7–5.2 mJ cm−2). For each spectrum, the averaged intensities were divided by the total intensity in the spectral region of the Ta 5d band and normalized to the intensity of the corresponding photoemission peak before time zero. The energy integration intervals used are indicated by boxes in (a–c). | ||
The unpumped energy–momentum maps of 1T-TaS2 and 1T-TaSe2 acquired near Γ show the weakly dispersive LHB in excellent agreement with static ARPES results [left panels of Fig. 3(a) and (b), cf.Fig. 1(d)]. A notable difference between the two compounds is the larger LHB distance to EF (by ≈200 meV) in 1T-TaSe2. Another expected difference is the significantly reduced separation between the LHB and the (faintly visible) top of the chalcogen valence band: in 1T-TaS2 there is a clear LHB-S 3p gap, while the LHB and the Se 4p band in 1T-TaSe2 appear to overlap [dashed lines in Fig. 3(a) and (b)].
The time-selected Γ-point spectra depicted in Fig. 3(d) and (e) reveal the qualitatively similar dynamics of the LHB in the two compounds. At pump–probe delays ≲40 fs, the spectral weight carried by the LHB is quasi-instantaneously suppressed and transferred to higher energies; the spectral weight gap at EF (ΔMott) is (incoherently) filled in and (coherent) band states above EF become populated as indicated by a distinct shoulder in the high-energy spectral tail [red spectra in Fig. 3(d) and (e)]. We note that at the rather limited energy resolution of our experiment we find no evidence for the emergence of a mid-gap resonance as reported in ref. 23.
We tentatively attribute the band states above EF to the upper Hubbard band (UHB). However, for 1T-TaS2 in equilibrium it is known that the UHB may overlap with other unoccupied Ta 5d bands.24 The LHB–UHB separation (i.e., the Hubbard U) is about 510 meV in 1T-TaS2, in agreement with previous trARPES results,23 and about 790 meV in 1T-TaSe2, which is about a factor of two larger than the value proposed in a scanning tunneling spectroscopy study.33
After the initial quench, on a time scale of ≈250 fs that roughly corresponds to one half-cycle of the CDW amplitude-mode oscillation in these materials,43 the suppressed LHB shifts towards EF, thereby (partially) closing the spectral weight gap at EF [right panels of Fig. 3(a) and (b) and black spectra in Fig. 3(d) and (e)]. Remarkably, in the case of 1T-TaSe2, the signature of the UHB, i.e., the shoulder in the high-energy tail, is still present at the longer time scale. It appears to have shifted to lower energies, suggesting that the LHB–UHB gap has been reduced to about 430 meV. However, we note that electron temperature changes at a fixed Hubbard-U may lead to a similar effect.24
The unpumped energy–momentum map of 1T-TaSe2 acquired along the Brillouin-zone edge shows the characteristic V-like dispersion of the lowest Ta 5d submanifold B2 about the M point. It also shows a weak sign of dispersion away from EF at the point where the gap opens [left panel of Fig. 3(c), cf.Fig. 1(c) and (d)]. The large (nesting-induced) spectral gap ΔICCDW is readily apparent. Inside the gap, a CDW-induced band belonging to the B1 submanifold is observed. This “shadow” band is significantly more intense than the static ARPES data of 1T-TaS2 in Fig. 1(d) would suggest. Possible reasons are electronic structure differences between the two compounds or a matrix-element effect due to the different photon energy used.
Upon photoexcitation, the spectral weight carried by the B1 and B2 bands is quasi-instantaneously suppressed and the previously split bands merge into one spectral feature [red spectrum in Fig. 3(f)]. On the longer time scale, this feature shifts towards EF and its dispersion straightens out, but a clear spectral gap remains [right panel of Fig. 3(c) and black spectrum in Fig. 3(f)].
Fig. 4 presents the full temporal evolution of the spectral weight dynamics as a function of material and momentum. The data shown in Fig. 4(a)–(c) were obtained from time-resolved energy–momentum maps similar to those depicted in the top row of Fig. 3. The spectra were averaged over momentum intervals of ≈0.8 Å−1 to improve the statistics of the extracted photoemission intensity transients that are shown in Fig. 4(d)–(f). The photoemission intensity transients represent the temporal evolution of the spectral weight in energy intervals that correspond to the spectral (gap, peak) combinations (ΔMott, LHB) [Fig. 4(d) and (e)] and (ΔICCDW, B2) [Fig. 4(f)].
The energy–time maps in Fig. 4(a)–(c) vividly illustrate the general, i.e., material- and momentum-independent, two-step dynamics: a quasi-instantaneous suppression of spectral weight is followed by a continuous spectral weight shift towards EF within 195–280 fs. The fast process occurs on a sub-vibrational (electronic) time scale on the order of the temporal resolution of the experiment; the time constant of the slower component agrees with measured half-cycle times of the CDW amplitude mode (203–224 fs in 1T-TaS2 (ref. 21–23, 43 and 44) and 222–265 fs in 1T-TaSe2 (ref. 43)), consistent with a displacive excitation of a coherent vibration of that mode.
All spectroscopic order-parameter transients shown in Fig. 4(d)–(f) also clearly display the two-time-scale dynamics. Initially, spectral weight is promptly transferred from the spectral peaks to the spectral gap regions resulting in the sharp (sub-40 fs) intensity drops and rises, respectively. Subsequently, the intensity changes reflect the shifting of the spectral peaks. The intensity changes become slower and the maximum intensity gains and losses are reached after one half-cycle oscillation of the amplitude mode. When the excitation density is increased, these half-cycle durations become longer, indicating a softening of the CDW amplitude mode. The fast component of the dynamics, on the other hand, remains within the resolution limit.
The peak intensity transients in the lower panels of Fig. 4(d)–(f) additionally display systematic excitation density-dependent amplitude changes. Upon stronger excitation, the amplitude of the amplitude-mode oscillation becomes larger resulting in larger peak shifts out of the fixed energy windows and thus larger spectral weight losses. This behavior is expected and consistent with the fact that the PLD is not completely suppressed, even for the high excitation densities applied here.
The amplitude of the fast, electronic component is more dependent on momentum than on fluence. Near M, where only CDW dynamics is probed, the intensity of the B2 peak promptly drops by about 10%, independent of the fluence. By contrast, near Γ, where mostly Mott dynamics is probed, the initial relative intensity losses of the LHB are larger and wider spread, about 20–35%. Remarkably, the 20% intensity quench in 1T-TaS2 at the lowest fluence of 1.7 mJ cm−2 agrees with the value reported in ref. 22 and 23 where the absorbed fluence was more than one order of magnitude lower. We attribute both intensity quenches, the one of the LHB near Γ and the one of the B2 band near M, to the loss of coherent spectral weight resulting from the suppression of charge order of the Mott component and the CDW component, respectively.
Our results thus confirm the general scenario that has emerged from previous trARPES work according to which the charge and lattice orders are suppressed on their own distinct time scales.17,22,23,27 However, novel important aspects are added to that scenario here, namely, the global character of the two-time-scale dynamics and the possible change of the Hubbard U in response to the coherent amplitude-mode oscillation.
V. Discussion
Fig. 5 shows a simple density-of-states scheme that summarizes our trARPES results on the ultrafast electronic structure dynamics in 1T-TaX2 (X = S and Se). After femtosecond laser excitation, the strongly reconstructed band structure with clear Peierls and Mott gaps [Fig. 5(a)] is melted on two distinct time scales via two distinct non-equilibrium states. The photoexcited state at t ≲ 40 fs is characterized by filled-in Mott and Peierls gaps and subbands carrying less coherent spectral weight [Fig. 5(b)]. The charge orders associated with Mott localization and CCDW formation are suppressed, whereas the PLD is still frozen. The state is highly non-thermal: neither the electron–phonon system nor the electron system itself will be thermalized. The second state, attained at t ≈ 200 fs, also is a crossover state between insulator and metal [Fig. 5(c)]. However, now the gaps are not only filled-in, but they are partially closed. The lattice order had time to relax coherently so that in addition to the quenched charge orders the PLD will be partially suppressed. The electrons could be expected to have thermalized, but the electron temperature will be vastly higher than the lattice temperature. | ||
| Fig. 5 Schematic representation of the ultrafast electronic structure dynamics in 1T-TaX2 (X = S or Se) as seen by trARPES. (a) Peierls–Mott ground state where the density of states below EF exhibits three distinct peaks separated by CDW-induced gaps. The peaks directly below and above EF are the lower and upper Hubbard band peak, respectively. The gap at EF is the Mott gap. (b) Non-equilibrium state immediately following photoexcitation. Density-of-states peaks are suppressed and gaps are partially filled in. (c) Non-equilibrium state after about one half-cycle of a coherent amplitude-mode oscillation. Density-of-states peaks are shifted towards EF and gaps are partially closed. | ||
These results readily provide answers to the three general questions raised in the introduction. First, regarding the speed limit and mechanism of the Peierls–Mott-state melting investigated here, we can conclude that the Peierls–Mott state as a whole—displaying strongly coupled charge and lattice orders—cannot be melted faster than the ions can move coherently. The speed limit for the quenching of this state is thus set by the duration of the relevant lattice vibrational mode. This mode is the CDW amplitude mode. In other words, the bottleneck of the melting process is the coherent breathing motion of the Star-of-David clusters [Fig. 1(b)] that is triggered by the femtosecond laser excitation.
Second, as to the nature of the transient non-equilibrium states, we find that from a spectroscopic viewpoint the crossover state at t ≈ 200 fs appears similar to an equilibrium strong-coupling CDW state above the mean-field transition temperature: both states are characterized by smeared, partially closed, but persistent energy gaps (“pseudogaps”). However, the nature of these states is very different. In the non-equilibrium case, we have a hot, disordered electron system decoupled from a coherently fluctuating, but still long-range ordered lattice distortion. The equilibrium state, by contrast, exhibits strongly coupled, but fluctuating short-range electronic and lattice orders.20,45
Third, concerning the implications on the equilibrium ground state, we can conclude that the trARPES results are generally consistent with the model described in Sec. II. The Peierls–Mott transition in 1T-TaX2 (X = S or Se) is not a chicken-and-egg problem. It is the CCDW distortion that drives the Mott transition by controlling the degree of localization on the 13th Ta atom in the center of the Star-of-David cluster.18,19 Our results may provide direct evidence for this linear cause-and-effect relationship in that they seem to indicate a reduction of the Hubbard U following the coherent reduction of the PLD amplitude. We note that a vibrational modulation of the Hubbard U has recently also been demonstrated in a time-resolved optical spectroscopy study on an organic Mott insulator.46
Finally, we place our results in the wider context of ultrafast photo-induced melting of electronic orders. Fig. 6 presents an overview of measured gap quenching times obtained by time-resolved optical and photoemission spectroscopy from a variety of materials comprising superconductors, CDW systems, and Mott insulators. The data are compiled from ref. 8–10, 17, 27 and 47–51 and plotted as a function of excitation density. The quenching times for 1T-TaSe2 determined in this work are included. The higher sensitivity of time-resolved optical spectroscopy compared to trARPES is immediately seen in the generally lower excitation densities employed in the optical spectroscopy studies.
 | ||
| Fig. 6 Quenching times of electronic order parameters as a function of excitation density, as measured by time-resolved optical and photoemission spectroscopy for various superconductors, charge-density–wave systems, and Mott insulators. Data compiled from ref. 8–10, 17, 27 and 47–51. The results of this work are highlighted by ellipses. | ||
The plot reveals a phenomenological temporal hierarchy that reflects the distinct characteristic time scales of different processes dominating in the destruction of the three different forms of electronic order.
The quenching times of superconducting states are the slowest, in the range of 0.4–10 ps. This is because the energy transfer from the photo-excited hot carriers to the superconducting condensate is generally inefficient and incoherent. The hot carriers generate a dense population of high-energy (“2Δ”) phonons and these phonons subsequently provide the dominant inelastic scattering channel for Cooper-pair breaking.48 The quenching time is thus related to an empirical pair-breaking rate.
In CDW systems, as has also been shown in this work, there are two distinct quenching time scales: a slow, vibrational one of about 100–400 fs, and a fast, electronic one on the order of 20–100 fs. The two time scales reflect the fact that a CDW has two components: a lattice component, the PLD, and an electronic component, the periodic modulation of the conduction-electron density. The relevant collective mode mapping the PLD onto the undistorted lattice is the CDW amplitude mode, and indeed for all systems shown the measured lattice quenching time corresponds well to the half-cycle time of the amplitude mode. Collective electron behavior, on the other hand, is generally related to the plasma frequency. The plasma frequency may therefore be expected to set the time scale on which the electronic component of a CDW is suppressed.9 Layered CDW materials of the dichalcogenide family display plasmon energies between 40–140 meV (1T-TiSe2 (ref. 52)) and 1.05 eV (2H-TaSe2 (ref. 53)) which indeed spans a range of screening times of 4–100 fs. Nonetheless, it is fair to say that the connection between screening and CDW quenching is not yet well established experimentally.
Lastly, Mott-gap quenching appears to be connected with the fastest rise times of about 20–40 fs. Effectively it will be even faster as typical experimental time resolutions are limited to a few 10 fs. The ultrafast collapse of the Mott gap proceeds via the buildup of coherent or incoherent mid-gap states22–24 and the time scale is commonly associated with the fundamental electron hopping rate as given by the bandwidth W.8,17,27 However, as suggested in Fig. 5(c), one can also imagine a scenario in which a coherent lattice vibration modulates the parameters U and W such that the system is driven into the metallic regime. The quenching dynamics would then exhibit a slower, vibrational component, similar to the case of a CDW.
Collectively, the data of Fig. 6 corroborate a central motivation for time-resolved studies: the possibility to discriminate fundamental electronic and phononic processes in the time domain. They also show that there is room at the bottom for improved time resolution. The true time scales of the fast electronic processes have not yet been measured.
VI. Conclusion
In summary, time-resolved NIR pump-XUV probe ARPES has allowed us to study the non-equilibrium dynamics of the isoelectronic Peierls–Mott states of 1T-TaS2 and 1T-TaSe2 in the strong excitation regime. Femtosecond laser excitation in the mJ cm−2 range suppresses the coupled electron-lattice orders on two distinct time scales. The two charge orders due to Mott localization and the electronic component of the CDW, respectively, are quenched on a resolution-limited electronic time scale, possibly connected with hopping and screening processes. The lattice component of the CDW order, on the other hand, is coherently diminished on a vibrational time scale corresponding to the half-cycle time of the CDW amplitude mode. The Peierls–Mott state is not melted completely, even at the high excitation densities applied. The transient non-equilibrium state is a crossover state between insulator and metal. The Mott and Peierls gaps remain pseudo-gapped; they are filled-in and only partially closed. Overall, the results are consistent with an equilibrium phase-transition mechanism in which the CDW is the driver of the Mott transition. Moreover, the experimentally observed global two-time-scale dynamics fits into a general phenomenological hierarchy of the time scales involved in the quenching dynamics of electronically ordered states.So, how fast can a Peierls–Mott insulator be melted? The bottleneck of the photo-induced melting process is the suppression of the PLD and the fastest way to get through this bottleneck is coherent lattice relaxation along the coordinate of the CDW amplitude mode. The period of the amplitude-mode oscillation (or a fraction thereof) thus defines the speed limit of the melting process. The bottleneck time scale for 1T-TaS2 and 1T-TaSe2 directly determined here is ≈200–300 fs.
Two immediate questions emerge from the presented trARPES results: can the Peierls–Mott state in 1T-TaS2 and 1T-TaSe2 be completely melted non-thermally? And does the (resolution-limited) quenching of the two different electronic orders happen on two different time scales? Both problems provide a challenge for trARPES experiments. The first one requires the use of even higher excitation densities than the ones applied here; the second one calls for sub-10 fs time resolution. In both directions, the price to be paid will be spectral resolution—because of pump-induced space–charge broadening and the time–bandwidth product, respectively. Yet, the strong spectroscopic signatures, specifically the large separation of the LHB from EF in 1T-TaSe2, may make these experiments feasible.
Acknowledgements
This work was supported by the DFG via grant BA 2177/9-1 and by the BMBF via grant 05K10FK4.References
- E. Dagotto, Science, 2005, 309, 257 CrossRef CAS PubMed.
- M. Rini, R. Tobey, N. Dean, J. Itatani, Y. Tomioka, Y. Tokura, R. W. Schoenlein and A. Cavalleri, Nature, 2007, 449, 72 CrossRef CAS PubMed.
- F. Schmitt, P. S. Kirchmann, U. Bovensiepen, R. G. Moore, L. Rettig, M. Krenz, J.-H. Chu, N. Ru, L. Perfetti, D. H. Lu, M. Wolf, I. R. Fisher and Z.-X. Shen, Science, 2008, 321, 1649 CrossRef CAS PubMed.
- R. Yusupov, T. Mertelj, V. V. Kabanov, S. Brazovskii, P. Kusar, J.-H. Chu, I. R. Fisher and D. Mihailovic, Nat. Phys., 2010, 6, 681 CrossRef CAS.
- M. Eichberger, H. Schäfer, M. Krumova, M. Beyer, J. Demsar, H. Berger, G. Moriena, G. Sciaini and R. J. D. Miller, Nature, 2010, 468, 799 CrossRef CAS PubMed.
- D. Fausti, R. I. Tobey, N. Dean, S. Kaiser, A. Dienst, M. C. Hoffmann, S. Pyon, T. Takayama, H. Takagi and A. Cavalleri, Science, 2011, 331, 189 CrossRef CAS PubMed.
- H. Ichikawa, S. Nozawa, T. Sato, A. Tomita, K. Ichiyanagi, M. Chollet, L. Guerin, N. Dean, A. Cavalleri, S. Adachi, T. Arima, H. Sawa, Y. Ogimoto, M. Nakamura, R. Tamaki, K. Miyano and S. Koshihara, Nat. Mater., 2011, 10, 101 CrossRef CAS PubMed.
- S. Wall, D. Brida, S. R. Clark, H. P. Ehrke, D. Jaksch, A. Ardavan, S. Bonora, H. Uemura, Y. Takahashi, T. Hasegawa, H. Okamoto, G. Cerullo and A. Cavalleri, Nat. Phys., 2011, 7, 114 CrossRef CAS.
- T. Rohwer, S. Hellmann, M. Wiesenmayer, C. Sohrt, A. Stange, B. Slomski, A. Carr, Y. Liu, L. Miaja Avila, M. Kalläne, S. Mathias, L. Kipp, K. Rossnagel and M. Bauer, Nature, 2011, 471, 490 CrossRef CAS PubMed.
- C. L. Smallwood, J. P. Hinton, C. Jozwiak, W. Zhang, J. D. Koralek, H. Eisaki, D.-H. Lee, J. Orenstein and A. Lanzara, Science, 2012, 336, 1137 CrossRef CAS PubMed.
- K. W. Kim, A. Pashkin, H. Schäfer, M. Beyer, M. Porer, T. Wolf, C. Bernhard, J. Demsar, R. Huber and A. Leitenstorfer, Nat. Mater., 2012, 11, 497 CrossRef CAS PubMed.
- S. de Jong, R. Kukreja, C. Trabant, N. Pontius, C. F. Chang, T. Kachel, M. Beye, F. Sorgenfrei, C. H. Back, B. Bräuer, W. F. Schlotter, J. J. Turner, O. Krupin, M. Doehler, D. Zhu, M. A. Hossain, A. O. Scherz, D. Fausti, F. Novelli, M. Esposito, W. S. Lee, Y. D. Chuang, D. H. Lu, R. G. Moore, M. Yi, M. Trigo, P. Kirchmann, L. Pathey, M. S. Golden, M. Buchholz, P. Metcalf, F. Parmigiani, W. Wurth, A. Föhlisch, C. Schüßler-Langeheine and H. A. Dürr, Nat. Mater., 2013, 12, 882 CrossRef CAS PubMed.
- L. Stojchevska, I. Vaskivskyi, T. Mertelj, P. Kusar, D. Svetin, S. Brazovskii and D. Mihailovic, Science, 2014, 344, 177 CrossRef CAS PubMed.
- D. J. Hilton, R. P. Prasankumar, S. A. Trugman, A. J. Taylor and A. D. Averitt, J. Phys. Soc. Jpn., 2006, 75, 011006 CrossRef.
- U. Bovensiepen and P. S. Kirchmann, Laser Photonics Rev., 2012, 6, 589 CrossRef PubMed.
- R. J. D. Miller, Science, 2014, 343, 1108 CrossRef CAS PubMed.
- S. Hellmann, T. Rohwer, M. Kalläne, K. Hanff, C. Sohrt, A. Stange, A. Carr, M. M. Murnane, H. C. Kapteyn, L. Kipp, M. Bauer and K. Rossnagel, Nat. Commun., 2012, 3, 1069 CrossRef CAS PubMed.
- P. Fazekas and E. Tosatti, Philos. Mag. B, 1979, 39, 229 CAS.
- K. Rossnagel and N. V. Smith, Phys. Rev. B: Condens. Matter Mater. Phys., 2006, 73, 073106 CrossRef.
- K. Rossnagel, J. Phys.: Condens. Matter, 2011, 23, 213001 CrossRef CAS PubMed.
- J. Demsar, L. Forró, H. Berger and D. Mihailovic, Phys. Rev. B: Condens. Matter, 2002, 66, 041101(R) CrossRef.
- L. Perfetti, P. A. Loukakos, M. Lisowski, U. Bovensiepen, H. Berger, S. Biermann, P. S. Cornaglia, A. Georges and M. Wolf, Phys. Rev. Lett., 2006, 97, 067402 CrossRef CAS.
- L. Perfetti, P. A. Loukakos, M. Lisowski, U. Bovensiepen, M. Wolf, H. Berger, S. Biermann and A. Georges, New J. Phys., 2008, 10, 053019 CrossRef.
- J. K. Freericks, H. R. Krishnamurthy, Y. Ge, A. Y. Liu and T. Pruschke, Phys. Status Solidi B, 2009, 246, 948 CrossRef CAS PubMed.
- S. Hellmann, M. Beye, C. Sohrt, T. Rohwer, F. Sorgenfrei, H. Redlin, M. Kalläne, M. Marczynski-Bühlow, F. Hennies, M. Bauer, A. Föhlisch, L. Kipp, W. Wurth and K. Rossnagel, Phys. Rev. Lett., 2010, 105, 187401 CrossRef CAS.
- N. Dean, J. C. Petersen, D. Fausti, R. I. Tobey, S. Kaiser, L. V. Gasparov, H. Berger and A. Cavalleri, Phys. Rev. Lett., 2011, 106, 016401 CrossRef CAS.
- J. C. Petersen, S. Kaiser, N. Dean, A. Simoncig, H. Y. Liu, A. L. Cavalieri, C. Cacho, I. C. E. Turcu, E. Springate, F. Frassetto, L. Poletto, S. S. Dhesi, H. Berger and A. Cavalleri, Phys. Rev. Lett., 2011, 107, 177402 CrossRef CAS.
- J. A. Wilson, F. J. Di Salvo and S. Mahajan, Adv. Phys., 1975, 24, 117 CrossRef CAS.
- M. Bovet, D. Popović, F. Clerc, C. Koitzsch, U. Probst, E. Bucher, H. Berger, D. Naumović and P. Aebi, Phys. Rev. B: Condens. Matter Mater. Phys., 2004, 69, 125117 CrossRef.
- F. Clerc, M. Bovet, H. Berger, L. Despont, C. Koitzsch, O. Gallus, L. Patthey, M. Shi, J. Krempasky, M. G. Garnier and P. Aebi, J. Phys.: Condens. Matter, 2004, 16, 3271 CrossRef CAS.
- R. Ang, Y. Miyata, E. Ieki, K. Nakayama, T. Sato, Y. Liu, W. J. Lu, Y. P. Sun and T. Takahashi, Phys. Rev. B: Condens. Matter Mater. Phys., 2013, 88, 115145 CrossRef.
- L. Perfetti, A. Georges, S. Florens, S. Biermann, S. Mitrovic, H. Berger, Y. Tomm, H. Höchst and M. Grioni, Phys. Rev. Lett., 2003, 90, 166401 CrossRef CAS.
- S. Colonna, F. Ronci, A. Cricenti, L. Perfetti, H. Berger and M. Grioni, Phys. Rev. Lett., 2005, 94, 036405 CrossRef.
- R. Brouwer and F. Jellinek, Phys. B, 1980, 99, 51 CAS.
- M. Eibschutz, Phys. Rev. B: Condens. Matter, 1992, 45, 10914 CrossRef CAS.
- B. Dardel, M. Grioni, D. Malterre, P. Weibel, Y. Baer and F. Lévy, Phys. Rev. B: Condens. Matter, 1992, 45, 1462(R) CrossRef.
- L. Perfetti, T. A. Gloor, F. Mila, H. Berger and M. Grioni, Phys. Rev. B: Condens. Matter Mater. Phys., 2005, 71, 153101 CrossRef.
- R. Ang, Y. Tanaka, E. Ieki, K. Nakayama, T. Sato, L. J. Li, W. J. Lu, Y. P. Sun and T. Takahashi, Phys. Rev. Lett., 2012, 109, 176403 CrossRef CAS.
- S. Mathias, L. Miaja-Avila, M. M. Murnane, H. Kapteyn, M. Aeschlimann and M. Bauer, Rev. Sci. Instrum., 2007, 78, 083105 CrossRef CAS PubMed.
- A. Rundquist, C. G. Durfee III, Z. Chang, C. Herne, S. Backus, M. M. Murnane and H. C. Kapteyn, Science, 1998, 280, 1412 CrossRef.
- S. Eich, A. Stange, A. V. Carr, J. Urbancic, T. Popmintchev, M. Wiesenmayer, K. Jansen, A. Ruffing, S. Jakobs, T. Rohwer, S. Hellman, C. Chen, P. Matyba, L. Kipp, K. Rossnagel, M. Bauer, M. M. Murnane, H. C. Kapteyn, S. Mathias and M. Aeschlimann, J. Electron Spectrosc. Relat. Phenom., 2014 DOI:10.1016/j.elspec.2014.04.013.
- F. J. Di Salvo, R. G. Maines, J. V. Waszczak and E. Schwall, Solid State Commun., 1974, 14, 497 CrossRef CAS.
- S. Sugai, Phys. Status Solidi B, 1985, 129, 13 CrossRef CAS PubMed.
- T. Onozaki, Y. Toda, S. Tanda and R. Morita, Jpn. J. Appl. Phys., 2007, 46, 870 CrossRef CAS.
- W. L. McMillan, Phys. Rev. B: Solid State, 1977, 16, 643 CrossRef CAS.
- S. Kaiser, S. R. Clark, D. Nicoletti, G. Cotugno, R. I. Tobey, N. Dean, S. Lupi, H. Okamoto, T. Hasegawa, D. Jaksch and A. Cavalleri, Sci. Rep., 2014, 4, 3823 CAS.
- L. Stojchevska, P. Kusar, T. Mertelj, V. V. Kabanov, Y. Toda, X. Yao and D. Mihailovic, Phys. Rev. B: Condens. Matter Mater. Phys., 2011, 84, 180507(R) CrossRef.
- M. Beck, M. Klammer, S. Lang, P. Leiderer, V. V. Kabanov, G. N. Gol'tsman and J. Demsar, Phys. Rev. Lett., 2011, 107, 177007 CrossRef CAS.
- A. Tomeljak, H. Schäfer, D. Städter, M. Beyer, K. Biljakovic and J. Demsar, Phys. Rev. Lett., 2009, 102, 066404 CrossRef CAS.
- F. Schmitt, P. S. Kirchmann, U. Bovensiepen, R. G. Moore, J.-H. Chu, D. H. Lu, L. Rettig, M. Wolf, I. R. Fisher and Z.-X. Shen, New J. Phys., 2011, 13, 063022 CrossRef.
- H. Okamoto, T. Miyagoe, K. Kobayashi, H. Uemura, H. Nishioka, H. Matsuzaki, A. Sawa and Y. Tokura, Phys. Rev. B: Condens. Matter Mater. Phys., 2011, 83, 125102 CrossRef.
- G. Li, W. Z. Hu, D. Qian, D. Hsieh, M. Z. Hasan, E. Morosan, R. J. Cava and N. L. Wang, Phys. Rev. Lett., 2007, 99, 027404 CrossRef CAS.
- A. König, R. Schuster, M. Knupfer, B. Büchner and H. Berger, Phys. Rev. B: Condens. Matter Mater. Phys., 2013, 87, 195119 CrossRef.
| This journal is © The Royal Society of Chemistry 2014 |