
Identification of TiO2 nanoparticles using La and Ce as labels: application to the evaluation of surface contamination during the handling of nanosized matter†
Virginia Gomeza, Alberto Clementea, Silvia Irusta*ab, Francisco Balasab and Jesus Santamaria*ab
aDepartment of Chemical Engineering, Nanoscience Institute of Aragon (INA), University of Zaragoza, 50018 Zaragoza, Spain. E-mail: sirusta@unizar.es; jesus.santamaria@unizar.es
bNetworking Research Center on Bioengineering, Biomaterials and Nanomedicine, CIBER-BBN, 50018 Zaragoza, Spain
First published on 31st July 2014
Abstract
Distinguishing nanomaterials of interest from background nanosized matter already present in the sampling environment is a challenging task. In this study, we propose the use of rare earth elements (REEs) as high-sensitivity labels to identify and to monitor their fate following manipulation. The REE labels were added during the synthesis of TiO2 nanoparticles with hydrodynamic sizes of 15 nm. The REE-labelled nanomaterials allow the monitoring of nanoparticle aerosols formed during handling of nanoparticulate materials in a glove box. The deposition of the labelled TiO2 nanoparticles on working surfaces could be verified by electron microscopy and surface analysis, using the presence of lanthanide elements as an identification label. The total amount of TiO2 nanoparticles in the deposited material could be quantified by a procedure based on wiping the deposition area followed by digestion of the collected matter and analysis by flame emission spectrometry.
Nano impactThis paper describes two main results that will be of general interest; first, and more important, the labeling of TiO2 nanoparticles using rare earth elements has been accomplished for the high-sensitivity identification and monitoring of nanomaterials upon manipulation and use. The method produces labeled materials that have similar behavior and properties in both aerosol and liquid phase to those observed for conventional TiO2 nanoparticles. Second, the study clearly shows that the emission of nanoparticulate matter upon handling in simulated scenarios contaminates nearby areas that could, in turn, be a source of exposure for subsequent dermal and inhalation uptake. This is of special interest because it shows the fundamental importance of real-time, particle monitoring for exposure assessment in adequate testing environments. |
Introduction
Airborne nanosized matter is ubiquitous in the air we breathe, not only in research1 and industrial locations,2 but also in natural environments.3,4 Nanoparticles may also be generated in the context of common daily life activities, such as soldering or using metal utensils.5,6 However, in recent years we have witnessed a growing interest regarding the possibility of adverse effects of nanomaterials in human health.7,8 Of especial concern are the so-called engineered nanomaterials (ENMs), new synthetic nanomaterials to which there has been scant or no previous exposure. Indeed, many toxicity studies are under way using ENMs9–11 under carefully controlled laboratory conditions. For instance, Abid et al.12 used europium-doped gadolinium oxide nanoparticles to study the deposition, clearance and translocation of nanoparticles in a mouse lung. However, in any real-life exposure assessment, the concentration of ENMs under consideration will have to be determined, which is a challenging task.13 The main difficulty is related to the fact that the proportion of ENMs in relation to background nanosized matter is likely to be extremely low (in the ppm range or lower), and therefore direct observation by usual techniques such as electron microscopy can generally be ruled out as a method to quantify exposure. Hence, alternative means of identification and discrimination of ENMs is needed. One possibility is labelling the ENMs using specific tags that are not present in the sampling environment. A variety of labelling techniques have been used, which generally involve granting additional specific properties to the target nanomaterials (Table 1). Some authors have used labelled nanoparticles to avoid interferences during the assessment of toxicity to specific nanomaterials.14–18 In addition, fluorescent dyes,19–21 radioactive tracers22–24 or stable isotopes25,26 have been used to trace nanoparticles under several conditions. Other identification techniques exploit the enhanced properties of matter on the nanoscale, such as the catalytic properties of some types of nanomaterials.27,28 The selection of a label must take into account the application scenario, i.e., the label should not interfere with the aspect to be studied. In this respect, the modification of the substrates by different markers may lead to different behaviour of the nanomaterials (see for instance ref. 25). Moreover, some labelling methods, such as radioactive labelling, raise concerns upon disposal and waste treatment and may require expensive facilities for performing the labelling and identification procedures.| Material | Labelling/identification | Analysis technique | References |
|---|---|---|---|
| a Offline.b Online. | |||
| TiO2 NPs | Radiolabelling: proton irradiation with a cyclotrona | — | 30 |
| Several ENMs | Radiolabelling: ion-beam or neutron irradiationa | — | 31 |
| Ag, Co/Co3O4, and CeO2 | Radiolabelling: neutron activation | γ-ray spectrometry | 18 |
| ZnO | Stable isotopea | ICP-MS | 16 |
| ZnO | Stable isotopea | CARS, STEM-EDX, MC-ICP-MS | 19 |
| Pt, Ni, Pd, Fe2O3 ENPs | Catalyticb | SMPS, BET, TEM, and catalytic FTIR | 20 |
| Pd and Ni | Catalyticb | CAAM | 21 and 22 |
| Carboxyl-modified polystyrene | Fluorescence | Confocal microscopy and flow cytometry | 13 |
| Carbon nanofibers (CNFs) | Non-labelleda | Thermal-optical analysis for carbon | 43 |
In this work we have used REEs (La and Ce ions) to label TiO2 nanoparticles. In order to include the REE in the nanoparticle structure and to minimize the impact on relevant properties (such as particle size distribution, surface charge, specific area and pore structure) we have used a modified sol–gel procedure in which REE addition is integrated into the synthesis process. TiO2 was selected in view of its wide range of applications, which increases the potential for unintended release and exposure29 and also because of the enormous variety of commercial presentations and functionalizations.13 The inclusion of lanthanide ions, namely, cerium and lanthanum, in REE/Ti ratios of up to 0.03 could be effectively traced using analytical and microscopic techniques under different conditions. As a proof of concept of the use of REE labelling, the contamination of work surfaces by labelled TiO2 nanoparticles after manipulation in the laboratory was quantitatively assessed. Pouring powder between two beakers was used because it has been addressed as a potential source of nanoparticle emission in laboratory environments,32 and it is a very common laboratory operation.
Experimental
Synthesis of REE-labelled TiO2 nanoparticles
The synthesis process has been described elsewhere.33 Briefly, 2 mL of titanium(IV) isopropoxide (Sigma-Aldrich, 97%) and 30 mL of ethanol (EtOH, Panreac, analytical grade) were mixed under magnetic stirring. An amount of 3 mL of acetic acid (AcOH, Panreac) was added after 5 min. Samples with REE/Ti atomic ratios of 0, 0.005, 0.01 and 0.03 have been obtained by adding stoichiometric amounts of cerium(III) nitrate (Ce(NO3)3·6H2O) and lanthanum(III) nitrate (La(NO3)3·6H2O) to the solution under stirring. After 5 min, 5 mL of deionized water was added and the mixture was poured into an autoclave, which was sealed and heated up to 120 °C for 15 min in a microwave oven (Ethos Plus). The final solid powder was isolated by centrifugation, thoroughly washed with EtOH several times and dried at 80 °C for 24 h.Characterization of REE-labelled TiO2 nanoparticles
The size, morphology, composition and distribution of lanthanides in the TiO2 nanoparticles were analysed by means of scanning electron microscopy coupled with energy-dispersive X-ray analysis (SEM-EDX, FEI-F Inspect and INCA PentaFETx3) and transmission electron microscopy (TEM, Tecnai T20). Statistical size-distribution histograms were obtained from TEM images using ImageJ (N > 75). The crystal structure, purity and crystal degree of the TiO2 nanoparticles were determined by X-ray diffraction (XRD) using a Rigaku/Max System RU 300 diffractometer. UV-visible spectra of the samples were recorded on a Jasco V-670 spectrophotometer. The hydrodynamic nanoparticle size and ζ-potential in water were determined by dynamic light scattering (DLS) with Brookhaven Instruments 90Plus. For the measurement of ζ-potential, the phase analysis light scattering (ZetaPALS) configuration was chosen, and 1 mg mL−1 suspensions were prepared in Milli-Q (Millipore) water. KOH or HNO3 solutions were added to analyse pH influence. The surface areas were measured by N2 adsorption at 77 K using a Micromeritics TriStar analyser (Micromeritics, Norcross, GA). Samples were outgassed at 26.7 Pa and 623 K for 6 h before performing adsorption experiments. Surface area was determined using the BET model applied to the range of relative pressures from 0.025 to 0.25. Mesopore size distributions were determined using the BJH data reduction scheme in the desorption branch of the isotherms. The chemical composition of REE-labelled TiO2 nanoparticles was determined by inductively coupled plasma-optical emission spectroscopy (ICP-OES, ACTIVA-S, Horiba Jobin Yvon). X-ray photoelectron spectroscopy (XPS) was performed with an Axis Ultra DLD spectrometer (Kratos Tech). The samples were mounted on a sample rod placed in the pretreatment chamber of the spectrometer and then evacuated at room temperature. The spectra were excited by a monochromatized AlKα source at 1486.6 eV and subsequently run at 12 kV and 10 mA. Survey spectrum was measured at 160 eV pass energy and for the individual peak regions, spectra were recorded with a pass energy of 20 eV. Analysis of the peaks was performed with the CasaXPS software using a weighted sum of Lorentzian and Gaussian component curves after Shirley background subtraction. The binding energies were referenced to the internal C1s standard at 284.9 eV.Monitoring of REE-TiO2 nanoparticles during handling procedures
The experimental setup was located inside an acrylic glove box chamber (61 × 61 × 71 cm3) that provides an isolated work environment. The relative humidity and temperature inside the chamber were measured during the experiments (30–45% RH and 22–25 °C).Two types of experiments were performed to monitor airborne particles and nanoparticle deposition during nanopowder manipulation. The transfer of 500 mg of Ce–TiO2 nanoparticles between two 100 mL beakers by gently pouring from one to another was used as a potential contamination source.
During the first type of experiments, particle emission was studied by sampling the air around the beaker to measure the particle number concentration in the air with an optical particle counter (OPC) from Grimm at 1.2 L min−1. In addition, released airborne matter was sampled through TEM grids placed on a polycarbonate filter inside a 47 mm diameter stainless steel filter holder at a flow rate of 0.3 L min−1. The morphology and shape of collected particles were observed and analysed by TEM and STEM-EDX using a Tecnai F30 microscope (FEI). In this case, the air of the chamber was purged with filtered clean air before the experiment to avoid interference of ambient particles. The rest of the experiments were performed in the presence of ambient air.
In addition, nanoparticle deposition on the working surfaces of the glove box was studied. Specific identification as well as qualitative and quantitative measurements was performed. The glove box was thoroughly cleaned before each experiment and the same pouring process was carried out without gas phase sampling to avoid disturbing the deposition process.
The deposition of airborne particles onto the working area was qualitatively analysed after handling REE-labelled TiO2 nanoparticulate powders in a delimited working surface (30 × 30 cm2). First, four 1 cm2 pieces of carbon tape were placed on the base of the handling chamber at 10 cm and 20 cm from the manipulation point. A mass of 500 mg of Ce-labelled TiO2 powder was then poured once from a 100 mL glass beaker to another. The shape and morphology of the contamination particles that settled on the tape surface were carefully verified by using scanning electron microscopy and energy dispersive X-ray spectroscopy (FESEM, Inspect form FEI).
Quantitative analysis of the deposited nanoparticulate matter was performed according to the OSHA standardized procedure (ID-125G) for sampling lead and other surface-deposited metals.39 Briefly, sealed disposable wipes (Ghost Wipes made by cross-linked polyvinyl alcohol, Reference 225–2414) were pre-moistened with deionized water and subsequently used for wiping the 30 × 30 cm2 area in concentric squares of decreasing sizes while applying firm pressure. This process was repeated twice after folding the wipe in half. Wipes were then dissolved in hot water and submitted to centrifugation at 10![[thin space (1/6-em)]](https://www.rsc.org/images/entities/char_2009.gif) 000 rpm for 5 min. The collected matter was further digested and analysed by ICP-OES to determine the concentration of Ce. A scheme of the method is shown in the ESI† (Fig. S2).
000 rpm for 5 min. The collected matter was further digested and analysed by ICP-OES to determine the concentration of Ce. A scheme of the method is shown in the ESI† (Fig. S2).
In order to test the efficiency of the procedure, a known amount of Ce-labelled TiO2 nanoparticles was dispersed in water, deposited and allowed to dry on the testing surface. This process was repeated three times and the recovery percentage was estimated to be 75 ± 6%.
Finally, three samples of the deposited particulated matter were collected from the 30 × 30 cm2 area after a handling process of 500 mg of cerium-doped nanoparticles and its cerium content was subsequently analyzed.
Results and discussion
Labelling and identification
The use of REEs to label TiO2 nanoparticles induced changes in their visual appearance. The addition of cerium during synthesis produced a yellow colour on the solid, which became more intense as the nominal content of cerium increased.34 This feature could be noticed as a shift to higher wavelengths in the visible absorption of samples for Ce-labelled TiO2 (Fig. 1). Similar behaviour was detected for La-labelled materials, although the effect was less marked. Incorporation of metals in TiO2 nanoparticles might affect the final properties of the material above a certain doping level. However, the high sensitivity of the technique developed means that the amount of added Ce and La needed for labelling is very low. Indeed, the amount of Ce and La added to the TiO2 nanoparticles in this work was low enough to avoid any modification of the structural characteristics of the solids, and only a slight coloration could be noticed at the highest loadings. For most commercial applications, this slight coloration will not have any significant effect on the final colour of a material containing labelled TiO2 nanoparticles. | ||
| Fig. 1 UV/vis spectra of (a) Ce–TiO2 and (b) La–TiO2 nanoparticles. | ||
Structural analysis using XRD indicated that nanoparticles showed the tetragonal structure of anatase regardless of the inclusion of lanthanide ions (Fig. 2). Separate phases of the REE as CeO2 or La2O3 could not be detected in the XRD patterns. The particle size of REE-labelled TiO2 nanoparticles calculated using the Debye–Scherrer equation (Table 2) was very similar to that of unlabelled TiO2; only a small decrease (11–16%) could be noticed when REE ions were incorporated at the highest concentrations. This may be caused by the influence of REE ions on the growth of nanoparticles by affecting the degree of hydration of the surface.35
 | ||
| Fig. 2 Powder XRD patterns of Ce–TiO2 and La–TiO2 nanoparticulate solids. Red circles: position of anatase maxima. | ||
| Material | Nominal Ln/Ti ratio | Crystal grain sizea [nm] | Surface areab [m2 g−1] | O/Tic | REE/Tic |
|---|---|---|---|---|---|
| a Estimated using the Debye–Scherrer equation for the XRD (101) maximum of the TiO2 anatase structure.b Calculated using the BET procedure in the N2 adsorption data at 77 K in the interval of relative pressures P/P0 from 0.025 to 0.25.c Calculated from XPS measurements. | |||||
| TiO2 | — | 6.92 | 239 | 2.5 | — |
| Ce05–TiO2 | 0.005 | 6.55 | — | 2.6 | 0.010 |
| Ce1–TiO2 | 0.01 | 6.98 | — | 2.9 | 0.025 |
| Ce3–TiO2 | 0.03 | 6.22 | 215 | 3.0 | 0.066 |
| La05–TiO2 | 0.005 | 6.84 | — | 2.8 | 0.014 |
| La1–TiO2 | 0.01 | 7.06 | — | 2.6 | 0.025 |
| La3–TiO2 | 0.03 | 5.92 | 246 | 2.7 | 0.038 |
The labelling with La produced only a small increase in the specific surface area (from 239 to 246 m2 g−1 for the highest La concentration) while the Ce-labelled nanoparticles reached only 215 m2 g−1 (Table 2, Fig. 3).
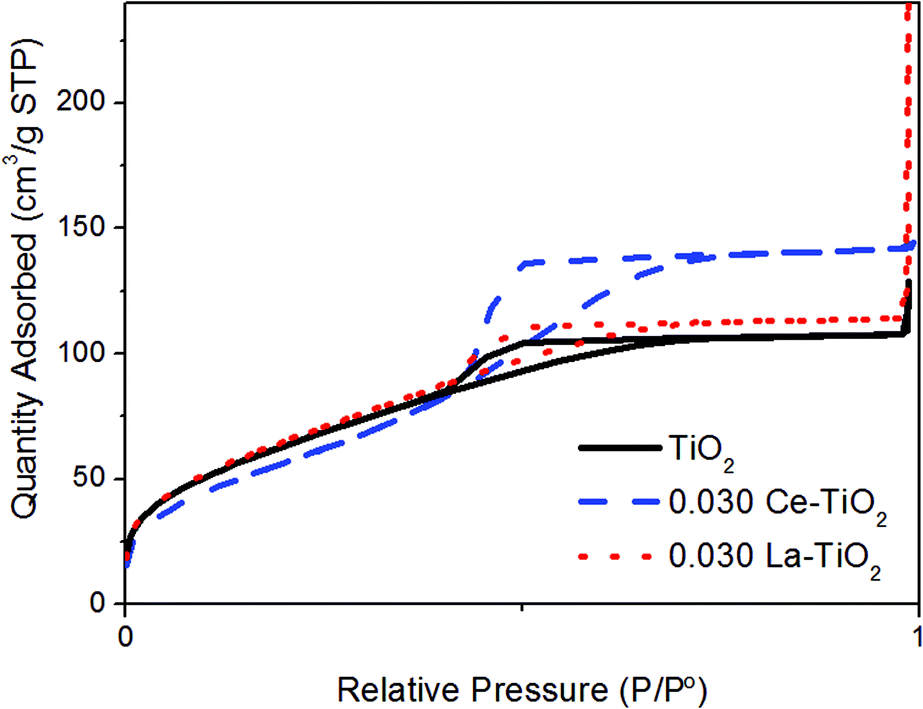 | ||
| Fig. 3 Nitrogen adsorption–desorption isotherms at 77 K of Ce- and La-labelled TiO2 nanoparticulate powders with a REE/Ti ratio of 0.03. | ||
The porosity of TiO2 nanoparticles could also be ascertained using high-resolution TEM, which showed an ordered array of mesopores on the surface of the nanoparticles obtained using this synthesis method (Fig. 4). Further surface analysis using XPS showed spectral bands attributed to Ti, O, C and Ce or La elements (data not shown). A closer examination of the Ce3d or La3d signals around 900 eV and 850 eV, respectively, showed the doublet 3d5/2 and 3d3/2 lines (Fig. 5), whose intensity increased as the content of the REE was increased during synthesis. The REE/Ti atomic ratios were estimated from the spectra of individual regions (Table 2), and their values were significantly higher than the ratios estimated from the proportions used during synthesis. This suggests a preferential concentration of lanthanide ions on the surfaces of individual particles or among the interfaces of the agglomerates, as was reported elsewhere.33 Other authors report that REE ions could occupy the interstitial octahedral sites in the anatase structure as was reported for similarly doped TiO2 nanomaterials with large contents of lanthanide ions (REE/TI ratio up to 0.3.)36
 | ||
| Fig. 4 High-resolution STEM micrographs of (a) TiO2 nanoparticles showing the array of mesopores and (c) REE-TiO2 doped nanoparticles; (b, d) magnifications of rectangular areas shown in (a) and (c) respectively. | ||
 | ||
| Fig. 5 XPS spectra of a) La3d and b) Ce3d bands on the Ln-labelled TiO2 nanomaterials. | ||
Since the synthesis procedure combines a sol–gel process followed by fast microwave heating, mainly non-aggregated TiO2 nanoparticles were obtained especially for the REE-doped material, as shown by DLS measurements. A narrow particle size distribution can be observed for all of the tested materials (Fig. 6), with hydrodynamic particle sizes of 10–40 nm for REE-TiO2 while it was slightly higher for TiO2. The slightly lower hydrodynamic radius of the doped material could be due to a small change in the concentration of OH superficial groups due to the presence of Re–O–Ti bonds.37 The surface charge of the REE-labelled nanoparticles was between −35 and 35 mV, with isoelectric points around pH 5, similar to that measured for TiO2.
 | ||
| Fig. 6 Variation of the ζ-potential vs. pH (a, b) and hydrodynamic particle sizes measured from a pH 3 dispersion using DLS (c, d) of REE-labelled TiO2 nanomaterials. | ||
Electron microscopy analysis confirmed that REE-labelled TiO2 nanoparticles display homogenous and regular shapes, similar to those found for unlabelled TiO2 (Fig. 7 and 8). Their prismatic shape is common for anatase nanostructures obtained using similar hydrothermal synthesis.38 The sizes obtained from the TEM images for most of the primary particles of both undoped and REE-doped TiO2 are in the 10–20 nm range.
 | ||
| Fig. 7 SEM and TEM images of TiO2 (a, b) and 0.030 Ce–TiO2 (c, d) while those of 0.030 La–TiO2 (e, f) are given as insets. | ||
 | ||
| Fig. 8 Statistical size distribution (N >75) of the nanoparticles observed in the TEM images of TiO2 (a), 0.030 Ce–TiO2 (b) and 0.030 La–TiO2 (c). | ||
Quantification of surface deposition
To demonstrate the monitoring capabilities afforded by REE labelling a simple assessment of surface contamination by nanoparticles was attempted. To this end, nanoparticle deposition as a consequence of a simple powder manipulation process (transferring nanoparticles between two beakers) was studied in a controlled environment (glove chamber) to ensure test repeatability and to avoid exposure (Fig. 9).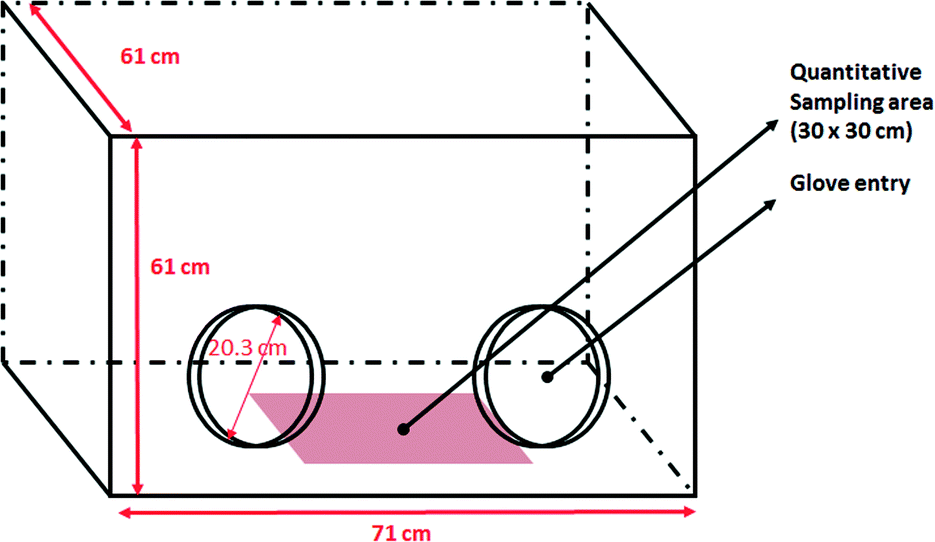 | ||
| Fig. 9 Glove box and sampling area used for the quantitative analysis of surface deposition of labelled TiO2 nanoparticles during handling. | ||
The manipulation of Ce-labelled TiO2 nanoparticles under such conditions led to a peak particle number concentration in the chamber after handling (Fig. S1 in the ESI†).The airborne particles collected in the air around the sampling area formed agglomerates with sizes of a few hundred nanometers (Fig. 10), and STEM-EDX analysis confirmed the presence of cerium along with titanium in the collected particles (Fig. 10b). This could confirm that the released matter could be effectively monitored using the cerium label in the TiO2 nanoparticles. Similar results were obtained using La-labelled nanoparticles (Fig. S3 in the ESI†).
 | ||
| Fig. 10 (a) STEM dark-field images of airborne matter collected by filtering the air around the manipulation area at 0.3 L min−1 through a Cu grid during the manipulation of Ce-labelled TiO2 nanoparticulate powders; (b) magnification of the rectangular area marked in (a), together with the EDX spectral analysis of the visualized area. | ||
Particle agglomerates of a similar structure but with larger sizes (mean diameters below 10 μm) were found within a distance of 10 cm from the release point (Fig. 11), which indicated that large aggregates settled by gravitational force on the testing area after manipulation. This strongly suggests the contamination of the working area by nanoparticle aggregates in the micron range. The fact that the contamination is in the form of aggregates rather than individual nanoparticles does not exclude toxicity, since nanoparticle aggregates still have a considerably higher surface area than bulk particles of the same size, and therefore surface reactivity and cell toxicity are expected to be higher.39,40 Thus, Ce and La (see the ESI†) labelling is effective in demonstrating surface contamination as a consequence of the handling of nanosized TiO2 powders. Other elements (e.g. Si) could also be detected, which is attributed to cross-contamination with environmental airborne matter (Fig. 11d and e). However, Ce and La are practically absent from environmental particles, and therefore they are effective as selective tags to identify objective nanomaterials.
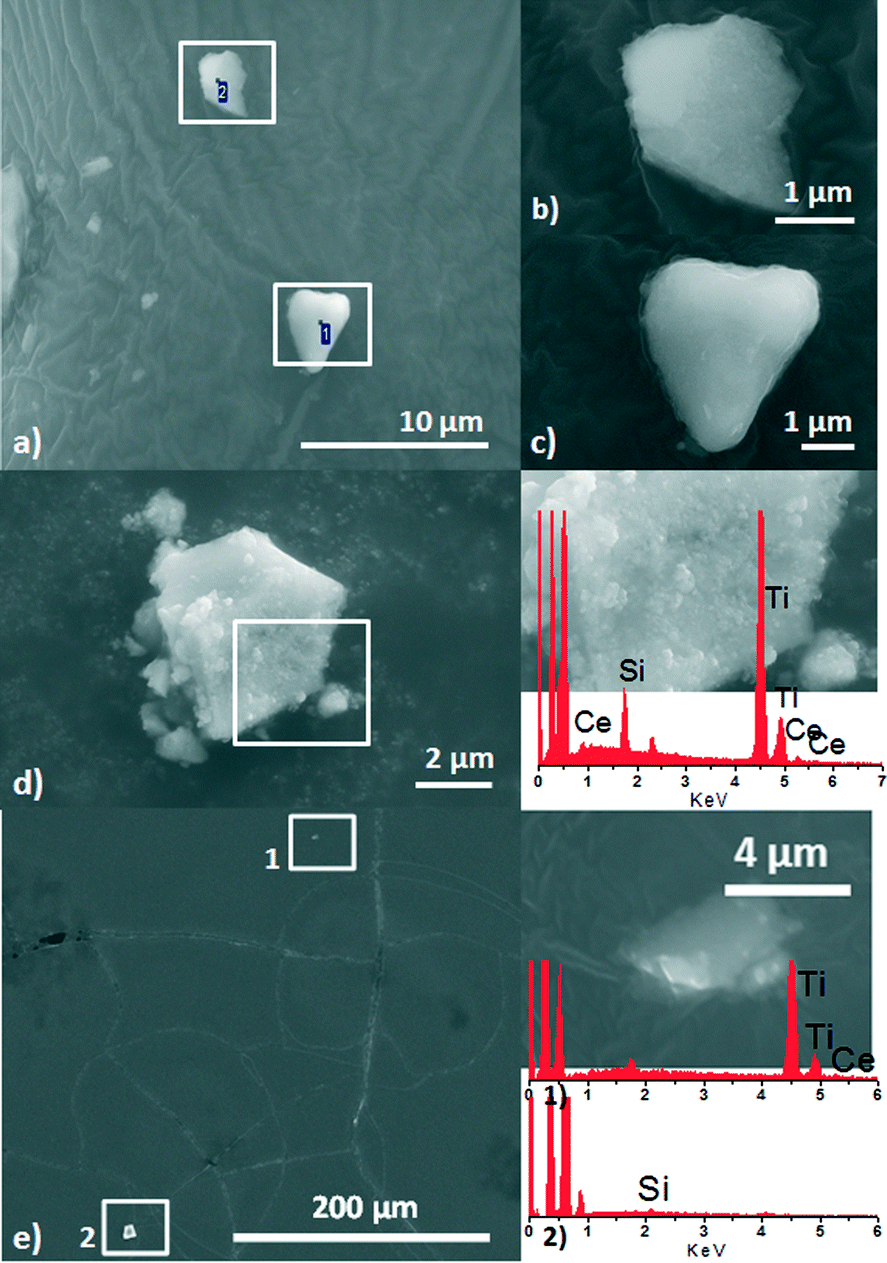 | ||
| Fig. 11 (a) SEM image of particles that settled on carbon tape placed 10 cm away from the source during the manipulation of TiO2 nanoparticulate powders; (b, c) magnification of areas marked with 2 and 1 in (a); (d) high-magnification image of a particle deposited on carbon showing at right a close-up of the aggregates collected together with the EDX spectral analysis of the visualized area; (e) survey SEM image to display the approximate distance between collected nanoparticles, showing at right a high-magnification image of the area marked with 1 in (e) (insets show the EDX spectral analysis of the areas marked as 1 and 2). | ||
Analytical determination of the deposited mass of nanoparticles
As we have shown, REE labelling is effective in discriminating individual nanoparticles and aggregates from those in the background. However, quantification of surface contamination by electron microscopy analysis of individual nanoparticles would be impractical in terms of time and cost. Therefore, we also attempted a quantitative estimation of surface contamination by chemical analysis of the REE labels after collecting and digesting the solid material deposited on the area under study.The deposition of toxic metals in the surroundings of working areas has been analysed by a wiping procedure of the testing area followed by complete dissolution of the wipes together with the collected solid particles. The chemical analysis of such dissolution using flame-based optical spectrometry indicated the content of each REE label on the testing area.41 This procedure is used by organizations such as the OSHA42 in studies of exposure levels and threshold limit values for different metals. In our case, we have monitored the concentration of the lanthanide labels. A simple mass balance can then be used to quantify the contamination by nanoparticles in terms of mass of particle per unit of surface area. Lanthanides not only are absent from the unlabelled nanoparticles (and from most of the environmental material), but also very low limits of detection (LoD) can be achieved by common analytical techniques such as ICP-OES, allowing a sensitive estimation of surface contamination. In addition, lanthanide atoms present spectra with numerous emission lines giving multiple opportunities to reduce potential interferences. In this work, the LOD obtained for Ce-labelled nanoparticles was as low as 0.0168 mg of Ce per liter when measured at a wavelength of 413.4 nm. The capacity of this procedure for quantifying lanthanides was tested by evenly spreading a known amount of Ce-labelled TiO2 nanoparticulate samples with a nominal Ce/Ti atomic ratio of 0.03 over a selected working area. The area was then subjected to the analytical wiping procedure described for metals and repeated three times (see the ESI† for details). The results of the ICP-OES analysis of the digested wipes indicated that the Ce/Ti ratio of the deposited solid was 0.0269 ± 0.0022, slightly lower than that of the dispersed material, probably due to background contamination. The percentage of material recovered from the surface was 75 ± 6%. The results obtained after pouring 500 mg of Ce-labelled TiO2 powder between two beakers showed that the amount of nanoparticles deposited on the surface close to the operation was 0.14 ± 0.06 mg, corresponding to a surface contamination of 155.6 μg cm−2 in the considered area of study.
Conclusions
Trace amounts of lanthanide ions could be easily incorporated into interstitial and surface sites of the anatase structure of TiO2 nanoparticles. This procedure led to the synthesis of labelled TiO2 nanoparticles with structures and properties similar to those of undoped nanoparticles. The use of lanthanides (Ce and La) as labels was selected in view of the negligible concentrations of these REEs in background nanoparticles. Doping with Ce and La also favoured a high degree of sensitivity due to the low limits of detection found under testing conditions. This allowed the identification and quantification of the amount of deposited labelled matter onto working areas after common handling operations. Consequently, this method could be effectively applied to determine the presence of labelled ENMs around working areas and therefore to reduce potential exposure risks to engineered nanomaterials. In addition, the sensitivity of the method opens up possibilities of application for monitoring the release of nanosized matter in different industrial and environmental scenarios.Notes and references
- F. Balas, M. Arruebo, J. Urrutia and J. Santamaria, Nat. Nanotechnol., 2010, 5, 93–96 CrossRef CAS PubMed.
- P. Van Broekhuizen, W. Van Veelen, W.-H. Streekstra, P. Schulte and L. Reijnders, Ann. Occup. Hyg., 2012, 56, 515–524 Search PubMed.
- S. J. Klaine, P. J. J. Alvarez, G. E. Batley, T. F. Fernandes, R. D. Handy, D. Y. Lyon, S. Mahendra, M. J. McLaughlin and J. R. Lead, Environ. Toxicol. Chem., 2008, 27, 1825–1851 CrossRef CAS.
- K. D. Grieger, I. Linkov, S. F. Hansen and A. Baun, Nanotoxicology, 2012, 6, 196–212 CrossRef PubMed.
- V. Gomez, S. Irusta, F. Balas and J. Santamaria, J. Hazard. Mater., 2013, 257, 84–89 CrossRef PubMed.
- R. D. Glover, J. M. Miller and J. E. Hutchison, ACS Nano, 2011, 5, 8950–8957 CrossRef CAS PubMed.
- N. Lewinski, V. Colvin and R. Drezek, Small, 2008, 4, 26–49 CrossRef CAS PubMed.
- A. D. Maynard, R. J. Aitken, T. Butz, V. Colvin, K. Donaldson, G. Oberdorster, M. A. Philbert, J. Ryan, A. Seaton, V. Stone, S. S. Tinkle, L. Tran, N. J. Walker and D. B. Warheit, Nature, 2006, 444, 267–269 CrossRef CAS PubMed.
- W. Wohlleben, S. Brill, M. W. Meier, M. Mertler, G. Cox, S. Hirth, B. von Vacano, V. Strauss, S. Treumann, K. Wiench, L. Ma-Hock and R. Landsiedel, Small, 2011, 7, 2384–2395 CrossRef CAS PubMed.
- D. Sekar, M. L. Falcioni, G. Barucca and G. Falcioni, Environ. Toxicol., 2014, 29, 117–127 CrossRef CAS PubMed.
- H. Wang, L.-J. Du, Z.-M. Song and X.-X. Chen, Nanomedicine, 2013, 8, 2007–2025 CrossRef CAS PubMed.
- A. D. Abid, D. S. Anderson, G. K. Das, L. S. Van Winkle and I. M. Kennedy, Part. Fibre Toxicol., 2013, 10 Search PubMed.
- N. Lubick, Environ. Sci. Technol., 2009, 43, 6446–6447 CrossRef CAS.
- M. Ono-Ogasawara, F. Serita and M. Takaya, J. Nanopart. Res., 2009, 11, 1651–1659 CrossRef CAS.
- T. M. Peters, S. Elzey, R. Johnson, H. Park, V. H. Grassian, T. Maher and P. O'Shaughnessy, J. Occup. Environ. Hyg., 2009, 6, 73–81 CrossRef CAS PubMed.
- P. Kumar, P. Fennell and A. Robins, J. Nanopart. Res., 2010, 12, 1523–1530 CrossRef CAS PubMed.
- K. Aschberger, C. Micheletti, B. Sokull-Klüttgen and F. M. Christensen, Environ. Int., 2011, 37, 1143–1156 CrossRef CAS PubMed.
- T. Kuhlbusch, C. Asbach, H. Fissan, D. Göhler and M. Stintz, Part. Fibre Toxicol., 2011, 8, 22 CrossRef PubMed.
- T. Dos Santos, J. Varela, I. Lynch, A. Salvati and K. A. Dawson, Small, 2011, 7, 3341–3349 CrossRef CAS PubMed.
- C. Kirchner, T. Liedl, S. Kudera, T. Pellegrino, A. Muñoz Javier, H. E. Gaub, S. Stölzle, N. Fertig and W. J. Parak, Nano Lett., 2004, 5, 331–338 CrossRef PubMed.
- I. L. Medintz, H. T. Uyeda, E. R. Goldman and H. Mattoussi, Nat. Mater., 2005, 4, 435–446 CrossRef CAS PubMed.
- D. H. Oughton, T. Hertel-Aas, E. Pellicer, E. Mendoza and E. J. Joner, Environ. Toxicol. Chem., 2008, 27, 1883–1887 CrossRef CAS.
- H. Hong, Y. Zhang, J. Sun and W. Cai, Nano Today, 2009, 4, 399–413 CrossRef CAS PubMed.
- N. Gibson, U. Holzwarth, K. Abbas, F. Simonelli, J. Kozempel, I. Cydzik, G. Cotogno, A. Bulgheroni, D. Gilliland, J. Ponti, F. Franchini, P. Marmorato, H. Stamm, W. Kreyling, A. Wenk, M. Semmler-Behnke, S. Buono, L. Maciocco and N. Burgio, Arch. Toxicol., 2011, 85, 751–773 CrossRef CAS PubMed.
- A. D. Dybowska, M.-N. Croteau, S. K. Misra, D. Berhanu, S. N. Luoma, P. Christian, P. O'Brien and E. Valsami-Jones, Environ. Pollut., 2011, 159, 266–273 CrossRef CAS PubMed.
- F. Larner, Y. Dogra, A. Dybowska, J. Fabrega, B. Stolpe, L. J. Bridgestock, R. Goodhead, D. J. Weiss, J. Moger, J. R. Lead, E. Valsami-Jones, C. R. Tyler, T. S. Galloway and M. Rehkämper, Environ. Sci. Technol., 2012, 46, 12137–12145 CrossRef CAS PubMed.
- N. Neubauer, M. Seipenbusch and G. Kasper, Ann. Occup. Hyg., 2013, 57, 842–852 CrossRef CAS PubMed.
- N. Neubauer, F. Weis, A. Binder, M. Seipenbusch and G. Kasper, J. Phys.: Conf. Ser., 2011, 304, 012011 CrossRef.
- F. Gottschalk and B. Nowack, J. Environ. Monit., 2011, 13, 1145–1155 RSC.
- K. Abbas, I. Cydzik, R. Torchio, M. Farina, E. Forti, N. Gibson, U. Holzwarth, F. Simonelli and W. Kreyling, J. Nanopart. Res., 2010, 12, 2435–2443 CrossRef CAS.
- U. Holzwarth, A. Bulgheroni, N. Gibson, J. Kozempel, G. Cotogno, K. Abbas, F. Simonelli and I. Cydzik, J. Nanopart. Res., 2012, 14, 1–15 CrossRef.
- V. Gomez, S. Irusta, F. Balas, N. Navascues and J. Santamaria, J. Hazard. Mater., 2013, 256, 84–89 CrossRef PubMed.
- V. Gomez, A. M. Balu, J. C. Serrano-Ruiz, S. Irusta, D. D. Dionysiou, R. Luque and J. Santamaría, Appl. Catal., A, 2012, 47–53 CrossRef CAS PubMed.
- V. Štengl, S. Bakardjieva and N. Murafa, Mater. Chem. Phys., 2009, 114, 217–226 CrossRef PubMed.
- M. Fernández-García, X. Wang, C. Belver, J. C. Hanson and J. A. Rodriguez, J. Phys. Chem. C, 2006, 111, 674–682 CrossRef.
- J. Xu, Y. Ao, D. Fu and C. Yuan, Colloids Surf., A, 2009, 334, 107–111 CrossRef CAS PubMed.
- J. Reszczyńska, T. Grzyb, J. W. Sobczak, W. Lisowski, M. Gazda, B. Ohtani and A. Zaleska, Appl. Surf. Sci., 2014, 307, 333–345 CrossRef PubMed.
- Sawanta S. Mali, Hyungjin Kim, Chang Su Shim, Pramod S. Patil, Jin Hyeok Kim and C. K. Hong, Sci. Rep., 2013, 3, 3004 Search PubMed.
- R. I. M. Justin, M. Zook, Laurie E. Locascio, Melissa D. Halter and John T. Elliott, Nanotoxicology, 2011, 5, 517–530 CrossRef PubMed.
- A. Albanese and W. C. W. Chan, ACS Nano, 2011, 5, 5478–5489 CrossRef CAS PubMed.
- K. Ashley, G. Braybrooke, S. D. Jahn, M. J. Brisson and K. T. White, J. Occup. Environ. Hyg., 2009, 6, D97–100 CrossRef PubMed.
- K. Ashley, T. J. Wise, D. Marlow, A. Agrawal, J. P. Cronin, L. Adams, E. Ashley and P. A. Lee, Anal. Methods, 2011, 3, 1906–1909 RSC.
- L. F. Mazzuckelli, M. Methner, M. E. Birch, D. E. Evans, B. K. Ku, K. Crouch and M. D. Hoover, Identification and Characterization of Potential Sources of Worker Exposure to Carbon Nanofibers During Polymer Composite Laboratory Operations, J. Occup. Environ. Hyg., 2007, 4(12), D125–D130 CrossRef PubMed.
Footnote |
| † Electronic supplementary information (ESI) available. See DOI: 10.1039/c4en00060a |
| This journal is © The Royal Society of Chemistry 2014 |