High adsorption capacity for dye removal by CuZn hydroxyl double salts†
Shiyao
Zhu
,
Shihui
Jiao
,
Ziwei
Liu
,
Guangsheng
Pang
* and
Shouhua
Feng
State Key Laboratory of Inorganic Synthesis and Preparative Chemistry, College of Chemistry, Jilin University, Changchun 130012, PR China. E-mail: panggs@jlu.edu.cn; Fax: +86 431 85168624
First published on 27th February 2014
Abstract
CuZn hydroxyl double salts (CuZn–HDS) were prepared using the same synthesis method of LHZS by adding a copper source. When tested as adsorbents for methyl orange (MO) removal, CuZn–HDS exhibited better performance than layered hydroxyl zinc salt (LHZS). CuZn-1 had a surface area of 33.8 m2 g−1 and displayed a maximum adsorption capacity of 847 mg g−1 for MO, which made it a potentially attractive adsorbent in water purification. The adsorption process followed a pseudo-second-order kinetic model, and the adsorption isotherm has been satisfactorily fitted using the Langmuir model. The adsorption mechanism for MO on CuZn-1 was also investigated.
Nano impactEnvironmental pollution is increasingly serious due to dye wastewater emissions. Many dyes are toxic and bring about a serious hazard to aquatic organisms as well as human health. Adsorption is an efficient way to remove dyes especially when they are non-biodegradable. In our paper, CuZn hydroxyl double salts (CuZn–HDS) have been synthesized and used as adsorbent materials in water purification. CuZn-1 with Cu/Zn molar ratio of 2.47![[thin space (1/6-em)]](https://www.rsc.org/images/entities/char_2009.gif) : :![[thin space (1/6-em)]](https://www.rsc.org/images/entities/char_2009.gif) 1 exhibited a multivalve flower-like structure constructed with stacked nanoplates. The thickness of the nanoplates was 10–20 nm which indicated that CuZn-1 was a nanomaterial. CuZn-1 displayed a maximum adsorption capacity of 847 mg g−1 for methyl orange, which makes it a potential adsorbent for removal of dye pollutants from wastewater. 1 exhibited a multivalve flower-like structure constructed with stacked nanoplates. The thickness of the nanoplates was 10–20 nm which indicated that CuZn-1 was a nanomaterial. CuZn-1 displayed a maximum adsorption capacity of 847 mg g−1 for methyl orange, which makes it a potential adsorbent for removal of dye pollutants from wastewater.
|
Introduction
The effluent discharged by many industries, such as dyestuffs, plastics, and textiles, contains a considerable amount of dyes. Environmental pollution is increasingly serious due to the dye wastewater emissions. It is recognized that public perception of water quality is greatly influenced by the colour. Colour is often the first characteristic of such wastewater to be noticed. The presence of very small amounts of dyes in water is highly visible and undesirable.1 The presence of dye in water interferes with light penetration and thus reduces the photosynthesis of aquatic plants which destroys aquatic ecosystems.2 Many dyes are toxic, even carcinogenic and mutagenic such as azo dyes, and this brings about a serious hazard to aquatic organisms as well as human health.3Wastewater containing dyes is difficult to remove because most dyes are resistant to biological degradation. Various conventional technologies, such as photocatalytic degradation,4 adsorption on activated carbon,5 bacterial action,6 and electrochemical degradation7 have been developed to remove dyes from wastewater. Among the numerous techniques, adsorption is an efficient way to remove dyes especially when they are non-biodegradable, and thus this method has found wide applications.8,9
Many adsorbents are used to remove dyes from wastewater, such as activated carbons,8 clays,10 zeolites,11 and chitosan.12 Among the different adsorbents, layered materials with interlamellar reactivity are promising adsorbents for the removal of dyes.13 Layered double hydroxides (LDH), also known as anionic clays or hydrotalcite like compounds, have been widely reported in biotechnology, catalysis, and environmental application.14–16 The general formula can be described as [M2+1−xM3+x(OH)2](Am−)x/m·nH2O, where M2+ and M3+ are metal cations, and Am− is an anion. The structure of LDH is a derivative of brucite with M(OH)6 octahedra, and partial substitution of M3+ for M2+ induces positively-charged host layers, which are balanced by the interlayer anions. A large surface area, ease of preparation, exchangeable interlayer anions, compositional flexibilities, and low cost make LDH an attractive candidate for adsorbents to selectively remove anionic pollutants.17–21
In addition to the well-known layered double hydroxides (LDH), divalent metals hydroxides or hydroxyl double salts (HDS) can also be classified as anionic clays.22 One of them is related to the structure of zinc hydroxide nitrate with the formula Zn5(OH)8(NO3)2·2H2O.23 Three fifths of Zn2+ are located in the center of the octahedron made by six OH groups, and two fifths of Zn2+ are positioned just above and below the vacancy sites, forming a tetrahedron coordinated by three OH ligands and one water molecule. Another one is derived from the structure of brucite, in which some OH groups are replaced by another anion. The general formula of this family can be written as [M1−x2+Me1+x2+(OH)3(1−y)]A(1+3y)/nn−⋅zH2O, where M2+ and Me2+ are divalent metal cations such as Co2+, Zn2+, Ni2+, Cu2+, etc. and An− represents anions such as NO3−, Cl−, CO32−, etc.24 Such compounds deserve much attention owing to their potential applications in anion exchange and intercalation.25–27 However, there is little research on the application of these materials as adsorbents.
In this work, we demonstrate the facile synthesis of 3D hierarchical materials with different Cu/Zn molar ratios via a solution method. When tested as adsorbent materials in water purification, the prepared CuZn–HDS samples showed better adsorption performance than LHZS for MO removal. The adsorption isotherm, kinetics and mechanism of MO on CuZn–HDS were also discussed.
Experimental section
Materials synthesis
Zn(CH3COO)2·2H2O, Cu(CH3COO)2·2H2O, and KOH were of analytical grade and used as received without further purification. In a typical procedure, 2.195 g Zn(CH3COO)2·2H2O (0.01 mol), 1.997 g Cu(CH3COO)2·2H2O (0.01 mol), and 100 ml absolute ethanol were added into a 250 ml round flask. The solution was refluxed for 1 h at 80 °C under magnetic stirring. The refluxed solution was cooled down to room temperature naturally for the subsequent experiment. 100 ml KOH ethanol solution (0.15 mol L−1) was added into the refluxed solution. The resulting mixture was sonicated for 1 h in an ice water bath, and a transparent colloid appeared. A precipitate was obtained after adding water (10, 60, and 80 ml) and incubating at room temperature for 2 days, and washed with distilled water and ethanol for twice, respectively, then dried at room temperature. The products obtained by adding 10, 60, and 80 ml water into 20 ml of the colloid were denoted as CuZn-1, CuZn-2, and CuZn-3, respectively.For comparison, LHZS was prepared by only using Zn(CH3COO)2·2H2O (0.01 mol) as the metal ion source and adding 10 ml deionized water into 20 ml colloid.
Characterization
The X-ray diffraction patterns (XRD) of all samples were obtained using a Rigaku D/MAX 2550 V/PC diffractometer with graphite-filtered Cu Kα radiation (λ = 1.5418 Å). Elemental analysis was carried out by using an OPTIMA 3300DV ICP spectrometer and a vario Micro CHN analyzer. Field emission scanning electron microscopic (SEM) images were obtained using a HITACHI SU8020 electron microscope. Thermogravimetry-differential thermal analysis (TG-DTA) was carried out using a NETZSCH STA 449C thermal analyzer in nitrogen at a heating rate of 10 °C min−1. Infrared (IR) spectra were measured with a WQF-510A IR spectrometer in the range of 400–4000 cm−1. N2 adsorption–desorption isotherms at 77 K were obtained using an ASAP 2420 system. Specific surface areas were evaluated with the multipoint Brunauer–Emmett–Teller (BET) method. Prior to the measurements, samples were outgassed at 100 °C under vacuum for 6 h.Adsorption experiments
0.02 g HDS was added into 200 ml MO solution (50 mg L−1) and stirred at 25 °C for 24 h. The suspensions were separated by filtering to get the supernatant. Absorbance was tested by a UV-2450 UV-vis spectrophotometer at 464.5 nm.To investigate the adsorption kinetics, the suspensions were extracted at time points 15, 30, 45, 60, 90, and 120 min. The removal efficiency (RE, %) and adsorption capacity qe (mg g−1) at equilibrium and qt (mg g−1) at time t (min) were calculated by eqn (1)–(3), respectively:
 | (1) |
 | (2) |
 | (3) |
Each experiment was repeated at least three times. The typical experimental error is lower than 5% for all the experimental results.
Results and discussion
Elemental analysis results of CuZn–HDS samples are shown in Table 1. The Cu/Zn molar ratios were 2.47, 5.88, and 7.41 in CuZn-1, CuZn-2, and CuZn-3, respectively, which indicated that the reaction was not stoichiometric.| Zn (%) | Cu (%) | C (%) | H (%) | Chemical formula | |
|---|---|---|---|---|---|
| CuZn-1 | 13.36 | 32.50 | 13.55 | 3.177 | Zn0.57Cu1.43(OH)2.43(CH3COO)1.57·0.84H2O |
| CuZn-2 | 7.375 | 42.19 | 32.37 | 4.626 | Zn0.29Cu1.71(OH)0.50(CH3COO)3.50·0.50H2O |
| CuZn-3 | 4.950 | 35.64 | 19.96 | 3.604 | Zn0.24Cu1.76(OH)1.37(CH3COO)2.63·1.07H2O |
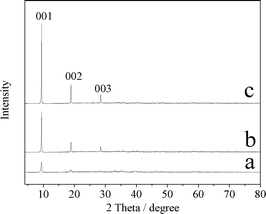
Fig. 1 shows the XRD patterns of CuZn-1, CuZn-2, and CuZn-3. With the increasing of the Cu/Zn molar ratios, the intensity of the diffraction peaks increased. The peak at 2θ = 9.47° suggested an interlayer d-spacing of 0.934 nm corresponding to the (001) diffraction of the lamellar phase. The peak at 2θ = 18.96° could be assigned to its second-order reflection. The main peaks of the CuZn–HDS samples (001, 002, 003) were similar to those of Cu2(OH)3(CH3COO)·H2O, in which the acetate anions were located in the interlayer and were coordinated directly to the Cu2+ cations through one oxygen atom.28 In the case of CuZn–HDS, the acetate anions should be directly coordinated to the Zn2+ or Cu2+ ions in the lamellar structures.
Fig. 2 shows SEM images of CuZn-1, CuZn-2, and CuZn-3. When adding water into the colloid, Cu2+ and Zn2+ ions formed CuZn HDS crystal nuclei, which provided the necessary heterogeneous nucleation sites. When the amount of water was less (10 ml), the saturation of the solution was high and CuZn HDS crystal nuclei would form nanoplates first. With extension of the crystallization time, these nanoplates would self-assemble into flower-like nanostructures. When the amount of water was higher (60 ml or 80 ml), the saturation of the solution was low. The precipitation of CuZn HDS crystal nuclei would result in condensed microstructures. The image of CuZn-1 (Fig. 2a) exhibited a multivalve flower-like structure constructed of stacked nanoplates with a thickness of 10–20 nm. The center part of flower-like nanostructure was a stack of well-aligned and oriented nanoplates and appeared as a condensed particle, which resulted in sharp peaks in the XRD pattern (Fig. 1a). CuZn-2 (Fig. 2b) and CuZn-3 (Fig. 2c) exhibited an olive-like condensed morphology.
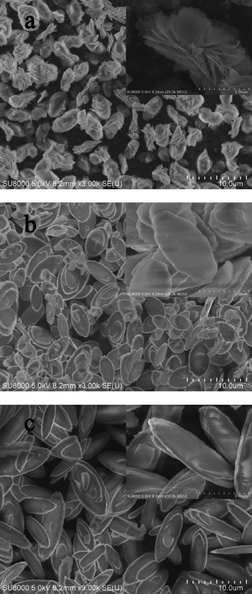 | ||
| Fig. 2 SEM images of a) CuZn-1, b) CuZn-2, and c) CuZn-3. The inset is a magnification of the image. | ||
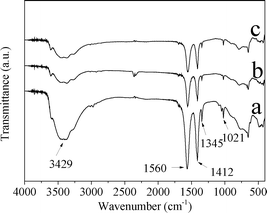
Fig. 3 shows the IR spectra of CuZn-1, CuZn-2, and CuZn-3. The IR spectra confirmed the presence of acetate ions in the CuZn–HDS. At a higher wavenumber range, the broad absorption band at 3429 cm−1 was due to the O–H stretching vibration of the hydroxyl groups and water. The absorption bands at 1345 cm−1 and 1021 cm−1 corresponded to the deformation and rocking modes of the methyl group, respectively.29 The carboxylate ions displayed two absorption bands at 1560 cm−1 and 1412 cm−1 resulting from the antisymmetric COO− stretching vibration (νa(COO−)) and the symmetric COO− stretching vibration (νs(COO−)) modes, respectively.29,30 At a lower wavenumber range, the bands below 1000 cm−1 were due to lattice vibrations involving the metal–oxygen bonds.
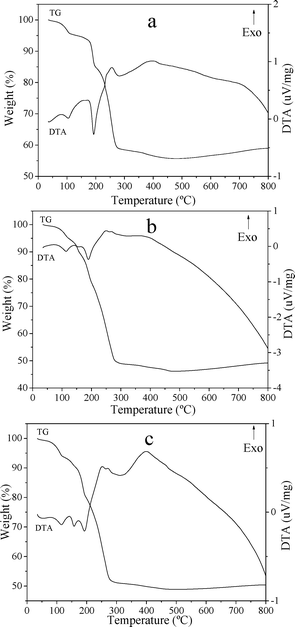
The TG-DTA curves of CuZn-1, CuZn-2, and CuZn-3 are shown in Fig. 4. It is well-known that the HDS lose weight generally in two main stages: (i) dehydration of interlamellar water molecules and (ii) dehydroxylation of the double hydroxide layers and destruction of the material.31 The first gradual weight loss step with a weak endothermic peak at 104 °C for CuZn-1 was due to release of the water adsorbed onto the layers. For CuZn-2 and CuZn-3, the endothermic peaks were at 114 °C. The second weight loss was accompanied by endothermic peak, which occurred around 190 °C for CuZn-1 and CuZn-2, was attributed to dehydration and dehydroxylation of the layers. For CuZn-3, the second weight loss with an endothermic peak was divided into two steps around 158 °C and 193 °C. The last weight loss occurring at higher temperature with exothermic peaks around 256 °C and 400 °C for all of the three samples might be interpreted to the loss of acetate and the decomposition of the layered structure. The net losses of CuZn-1 (44.31%), CuZn-2 (53.86%), and CuZn-3 (51.13%) were matched with the proposed formula.
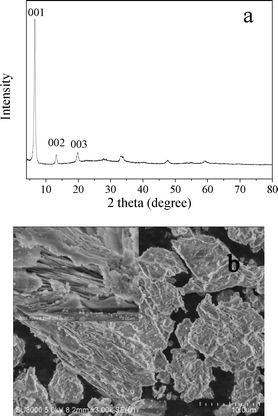
The XRD pattern and SEM image of LHZS are shown in Fig. 5. The diffraction pattern (Fig. 5a) was similar to XRD pattern of Zn5(OH)8(CH3COO)2·2H2O as reported in ref. 32. The most intense (001) peak at 2θ = 6.6° correspondeds to an interlayer d-spacing of 1.34 nm. The peaks at 2θ = 13.2° and 19.9° could be assigned to its second- and third-order reflections, respectively. The SEM image (Fig. 5b) indicated a layer-structure for LHZS.
The IR spectrum of LHZS is given in Fig. S1,† which was similar with that of CuZn–HDS (Fig. 3). The IR spectrum confirmed the presence of acetate ions in LHZS. The absorption bands at 1338 cm−1 and 1020 cm−1 correspond to the deformation and rocking modes of the methyl group, respectively. The carboxylate ions displayed two absorption bands at 1552 cm−1 and 1395 cm−1 resulting from νa(COO−) and νs(COO−) modes, respectively.
The TG-DTA curve of the LHZS is shown in Fig. S2.† The first weight loss step at 74 °C was mainly due to the release of the ethanol adsorbed onto the layers. As shown in Fig. 5b, the structure of LHZS was made of stacked nanoplates. LHZS was washed with ethanol, then dried at room temperature. There should be some ethanol residual between the stacked nanoplates. The second weight loss occurring around 130 °C was attributed to dehydration and dehydroxylation of the layers, accompanied by endothermic peaks. The last weight loss occurring at higher temperature between 220 °C and 470 °C corresponded to the loss of the acetate and the decomposition of the layered structure.
Adsorption capacity and the surface area of the samples are listed in Table 2. CuZn-1 showed the highest adsorption capacity for MO with a removal efficiency of 95.3%. The MO removal efficiencies of CuZn-2 and CuZn-3 were 63.7% and 35.8%, respectively. Whereas LHZS showed the lowest adsorption capacity with a removal efficiency of 5.5%. This was due to the poor structural and chemical stability of LHZS, which was confirmed by the XRD pattern (Fig. 6a) and SEM image of the sample (Fig. 7a) after MO adsorption. The adsorption performance of MO on HDS improved while copper ions were introduced. It is well-known that the adsorption capacity of the adsorbents is related to their surface area.33 The surface area of the samples was investigated by using nitrogen adsorption–desorption isotherms. The nitrogen adsorption–desorption isotherms of all the samples are shown in Fig. S3,† which has the characteristic features of a type IV isotherm. The surface area of CuZn-1 was 33.8 m2 g−1 due to the multivalve flower-like nanostructure with stacked nanoplatelets (Fig. 2a). However, the surface areas of CuZn-2 and CuZn-3 were only ca. 6 m2 g−1 due to their olive-like condensed morphology (Fig. 2b and c). Consequently, CuZn-1 possessing the highest surface area had the highest adsorption capacity for MO.
| Sample | Cu/Zn ratio | Removal efficiency (%) | Adsorption capacity (mg g−1) | Surface area (m2 g−1) |
|---|---|---|---|---|
| LHZS | 0 | 5.5 | 27.6 | 26.3 |
| CuZn-1 | 2.47![[thin space (1/6-em)]](https://www.rsc.org/images/entities/char_2009.gif) : :![[thin space (1/6-em)]](https://www.rsc.org/images/entities/char_2009.gif) 1 1 |
95.3 | 476 | 33.8 |
| CuZn-2 | 5.88![[thin space (1/6-em)]](https://www.rsc.org/images/entities/char_2009.gif) : :![[thin space (1/6-em)]](https://www.rsc.org/images/entities/char_2009.gif) 1 1 |
63.7 | 318 | 6.5 |
| CuZn-3 | 7.41![[thin space (1/6-em)]](https://www.rsc.org/images/entities/char_2009.gif) : :![[thin space (1/6-em)]](https://www.rsc.org/images/entities/char_2009.gif) 1 1 |
35.8 | 179 | 6.0 |
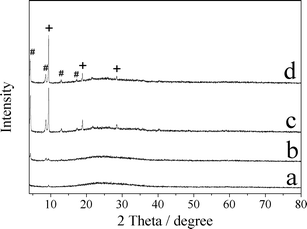 | ||
| Fig. 6 XRD patterns of a) LHZS, b) CuZn-1, c) CuZn-2, and d) CuZn-3 after MO adsorption (# represents d-spacing of 2.027 nm, + represents d-spacing of 0.936 nm). | ||
 | ||
| Fig. 7 SEM images of a) LHZS, b) CuZn-1, c) CuZn-2, and d) CuZn-3 after MO adsorption, the inset is a magnification of the image. | ||
The XRD patterns and SEM images of samples after MO adsorption are shown in Fig. 6 and 7. It was found that the XRD peaks of LHZS disappeared after adsorption (Fig. 6a) and the morphology of LHZS was also changed (Fig. 7a), which indicated that LHZS was unstable in aqueous solution. The XRD patterns of the CuZn–HDS samples after MO adsorption (Fig. 6b–d) confirmed the formation of bilamellar phase. One of the d-spacings of 0.936 nm was consistent with the d-spacing of CuZn–HDS. The other one of 2.027 nm suggested that partial MO was intercalated into the interlayer of CuZn–HDS due to the dimension of the long axis of MO (1.31 nm).34 It was noticed that the intensities of the characteristic diffraction peaks for HDS were weakened after adsorption, indicating that the adsorption behavior of MO on CuZn–HDS influenced the crystallinity of HDS. Due to relatively poor crystallization of CuZn-1 compared with that of CuZn-2 and CuZn-3, the crystallization of CuZn-1 after adsorption was poor. Although the crystallinity of CuZn-1 was poor, the main XRD peak at 2θ = 9.44° was obvious and confirmed that the layer structure was retained after adsorption; another XRD peak at 2θ = 4.36° suggested the formation of a new d-spacing after adsorption. After adsorption of MO, the diffraction peaks of the CuZn HDS remained but had weakened, which indicated that the original layer structure still existed. The morphology of CuZn–HDS samples (Fig. 7b–d) had no significant changes before and after adsorption.
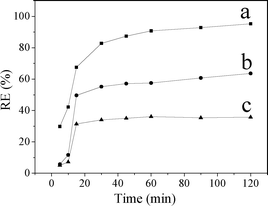
Fig. 8 shows that the removal efficiency of MO increased with time. The adsorption of MO on CuZn–HDS samples increased sharply within the first 15 min, then it rose slowly. The fast MO removal rate in the beginning was attributed to the rapid diffusion of MO from the solution to the external surfaces of CuZn–HDS. The subsequent slow adsorption process was attributed to the MO ion exchange into the interlayer of CuZn–HDS which was confirmed by the XRD patterns of CuZn–HDS after adsorption (Fig. 6). It can be seen that the surface adsorption and the interlayer ion exchange occurred concurrently during the adsorption process. This also explained why CuZn-2 and CuZn-3 had similar surface area but different adsorption capacity (Table 2). CuZn-2 and CuZn-3 had different compositions, as well as a different amount of exchangeable acetate groups, which had an influence on the adsorption capacity.
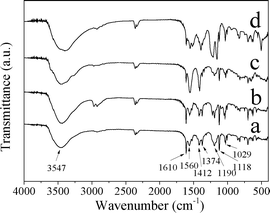
Fig. 9 shows the IR spectra of CuZn-1, CuZn-2, and CuZn-3 after MO adsorption. The IR results confirmed that MO was adsorbed on CuZn–HDS. Compared with the IR spectra of MO and CuZn–HDS before MO adsorption, MO absorption bands appeared after adsorption. For all the three samples after adsorption, the absorption band at 1610 cm−1 was assigned to the C![[double bond, length as m-dash]](https://www.rsc.org/images/entities/char_e001.gif) C stretching vibration of the benzene ring, and absorption band at 1118 cm−1 belonged to the stretching vibration of the 1,4 substituent in the benzene ring. The absorption band at 1374 and 1190 cm−1 belonged to the C–N stretching vibration. The absorption band at 1029 cm−1 corresponds to the vibration of the –SO3− group.35
C stretching vibration of the benzene ring, and absorption band at 1118 cm−1 belonged to the stretching vibration of the 1,4 substituent in the benzene ring. The absorption band at 1374 and 1190 cm−1 belonged to the C–N stretching vibration. The absorption band at 1029 cm−1 corresponds to the vibration of the –SO3− group.35
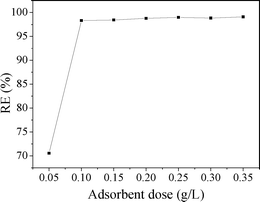
The adsorption behavior of MO onto CuZn-1 was further investigated due to the high adsorption capacity of CuZn-1. Adsorbent dose is an important parameter because it determines the adsorption capacity of an adsorbent for a given initial concentration of the adsorbate. The relationship of CuZn-1 dose and the adsorption of MO is shown in Fig. 10. The removal efficiency of MO increased from 70.6 to 98.3% with CuZn-1 dose increasing from 0.05 to 0.1 g L−1. The external surfaces of CuZn-1 and interlayer exchangeable ions increased when the CuZn-1 dose increased, which were beneficial for MO removal. However, there was only a small change of MO removal efficiency when CuZn-1 dose was over 0.1 g L−1.
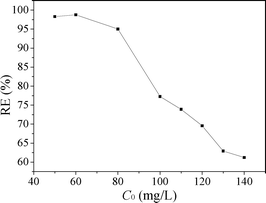
Fig. 11 shows the effect of initial MO concentration on the adsorption of MO. When the initial concentration of MO increased from 0.05 to 0.14 g L−1, the removal efficiency of MO decreased from 98.3 to 61.2%. Due to the amount of available adsorption sites for MO was fixed for a fixed CuZn-1 dose, CuZn-1 could adsorb almost the same amount of MO. Thus, the removal efficiency of MO decreased with an increase in initial MO concentration.
The adsorption capacity at different equilibrium concentrations can be illustrated by the adsorption isotherms. The equilibrium adsorption data obtained in this work were analyzed using Langmuir and Freundlich isotherm models. The linear forms of the Langmuir and Freundlich isotherms are expressed by eqn (4) and (5), respectively:
 | (4) |
 | (5) |
The Langmuir isotherm equation is based on the assumption that there are a definite and energetically equivalent number of adsorption sites on the adsorbent surface. This model supposes that the adsorption sites are homogeneous with each site accommodating one molecule only, the adsorption has a monolayer coverage, and there is no interaction among adsorbed molecules. The Freundlich isotherm is an empirical model based on adsorption on the heterogeneous surfaces and is not restricted to the formation of a monolayer.
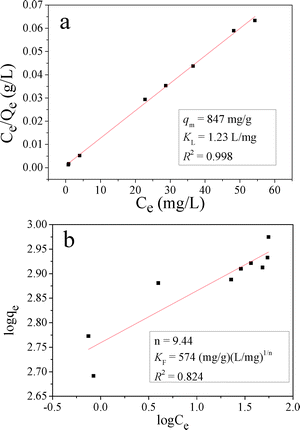
The Langmuir and Freundlich isotherms for MO adsorption on CnZn-1 are shown in Fig. 12 and their calculated parameters are inserted. It was observed that the Langmuir isotherm model could fit the experiment equilibrium data better than the Freundlich isotherm model on the basis of the correlation coefficient (R2). The calculated qm was 847 mg g−1. The qm value of CnZn-1 was compared with the reported values as shown in Table 3. It was found that the adsorption capacity of CuZn-1 in this report was equivalent to the highest value in the literature, which makes it useful as a potential efficient adsorbent for dyes from aqueous solutions.
The kinetics of adsorption is one of the most important characteristics which defines the adsorption efficiency. To investigate the mechanism of adsorption, a pseudo-first-order model (eqn (6)) and pseudo-second-order model (eqn (7)) are tested.
 | (6) |
 | (7) |
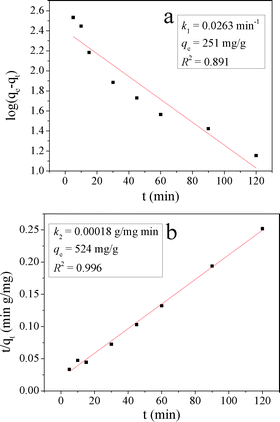
The kinetic models are illustrated in Fig. 13 and their kinetic parameters are inserted. As shown in Fig. 13b, the pseudo-second-order model had a better correlation coefficient. The qe value calculated with this model was close to the experimental value (qe = 476 mg g−1 in Table 2), indicating the applicability of this model to describe the adsorption process. It indicated that the rate limiting step was a chemical adsorption process between each adsorbate and the adsorbent.41
To identify the diffusion mechanism of the adsorption of MO on CuZn-1, the intraparticle diffusion model (eqn (8)) is also tested.
| qt = kit1/2 + c | (8) |
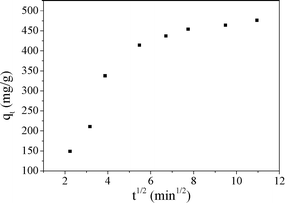
For this model, if the plot of qtversus t1/2 is linear and passes through the origin, then the intraparticle diffusion is the rate limiting step.43 When the plot does not pass through the origin, this indicates that the intraparticle diffusion is not only rate limiting step, but also other kinetic models may control the rate of adsorption, all of which may be operating simultaneously.21 From Fig. 14, it was found that the plot of intraparticle diffusion model was curved, which implied that the adsorption process was a rather complex process. The first portion was the instantaneous external surface adsorption. The second portion was the gradual adsorption stage when the adsorbates diffused gradually into the interior surfaces of the adsorbents and ion exchange happened, where intraparticle diffusion was the rate limiting step. This result was consistent with the result of the pseudo-second-order model. Both of them indicated that the rate limiting step was an ion exchange reaction, which was also a chemical adsorption process. The third portion was the final equilibrium stage where the intraparticle diffusion started to slow down owing to saturation of the majority of the adsorption sites. These results were consistent with studies of fluoride removal by calcined Li/Mg LDH44 and adsorption of MO on Fe3O4/ZnCr LDH.38
Conclusions
In summary, we have synthesized CuZn–HDS and LHZS via a solution method. Compared with the bad adsorption performance of LHZS, the adsorption performance of CuZn–HDS had been improved greatly. CuZn-1 with 3D flower-like morphology showed a relatively high surface area and displayed the maximum adsorption capacity of 847 mg g−1 for MO. Adsorption isotherm was fitted according to the Langmuir model, which indicated that adsorption sites were homogeneous with each site accommodating one molecule only and there was no interaction among the adsorbed molecules. The adsorption process followed the pseudo-second-order kinetic model, which suggested that the rate limiting step was a chemical adsorption process. The plot of the intraparticle diffusion model was not linear, which implied that the adsorption process was a complex process. The surface adsorption and the interlayer ion exchange occurred concurrently. The high adsorption capacity of CuZn–HDS reported here demonstrates that an important role for these materials as potential adsorbents for the removal of pollutants from wastewater.Acknowledgements
This work was supported by the National Natural Science Foundation of China (no. 21071058).Notes and references
- T. Robinson, G. McMullan, R. Marchant and P. Nigam, Bioresour. Technol., 2001, 77, 247–255 CrossRef CAS.
- Z.-M. Ni, S.-J. Xia, L.-G. Wang, F.-F. Xing and G.-X. Pan, J. Colloid Interface Sci., 2007, 316, 284–291 CrossRef CAS PubMed.
- Y. C. Wong, Y. S. Szeto, W. H. Cheung and G. McKay, Process Biochem., 2004, 39, 695–704 CrossRef.
- Z. Xiong, L. L. Zhang, J. Ma and X. S. Zhao, Chem. Commun., 2010, 46, 6099–6101 RSC.
- Y. C. Sharma, Uma and S. N. Upadhyay, Energy Fuels, 2009, 23, 2983–2988 CrossRef CAS.
- R. Khan and U. Banerjee, in Biodegradation of Azo Dyes, ed. H. Atacag Erkurt, Springer, Berlin Heidelberg, 2010, pp. 73–84 Search PubMed.
- S. Prakash, A. M. Rajesh and V. K. Shahi, Chem. Eng. J., 2011, 168, 108–114 CrossRef CAS PubMed.
- X. Zhuang, Y. Wan, C. Feng, Y. Shen and D. Zhao, Chem. Mater., 2009, 21, 706–716 CrossRef CAS.
- M. Iram, C. Guo, Y. Guan, A. Ishfaq and H. Liu, J. Hazard. Mater., 2010, 181, 1039–1050 CrossRef CAS PubMed.
- M. Valix, W. H. Cheung and G. McKay, Langmuir, 2006, 22, 4574–4582 CrossRef CAS PubMed.
- G. Atun, G. Hisarlı, A. E. Kurtoğlu and N. Ayar, J. Hazard. Mater., 2011, 187, 562–573 CrossRef CAS PubMed.
- N. K. Lazaridis, G. Z. Kyzas, A. A. Vassiliou and D. N. Bikiaris, Langmuir, 2007, 23, 7634–7643 CrossRef CAS PubMed.
- G. Lagaly and S. Ziesmer, Adv. Colloid Interface Sci., 2003, 100–102, 105–128 CrossRef CAS.
- S. Bégu, A. Aubert-Pouëssel, R. Polexe, E. Leitmanova, D. A. Lerner, J.-M. Devoisselle and D. Tichit, Chem. Mater., 2009, 21, 2679–2687 CrossRef.
- C. U. G. Silva, Y. S. Bouizi, V. Fornés and H. García, J. Am. Chem. Soc., 2009, 131, 13833–13839 CrossRef PubMed.
- Q. Wang and D. O'Hare, Chem. Rev., 2012, 112, 4124–4155 CrossRef CAS PubMed.
- N. Benselka-Hadj Abdelkader, A. Bentouami, Z. Derriche, N. Bettahar and L. C. de Ménorval, Chem. Eng. J., 2011, 169, 231–238 CrossRef CAS PubMed.
- C. Chen, P. Gunawan and R. Xu, J. Mater. Chem., 2011, 21, 1218–1225 RSC.
- Y. Zhao, S. He, M. Wei, D. G. Evans and X. Duan, Chem. Commun., 2010, 46, 3031–3033 RSC.
- Y. Guo, Z. Zhu, Y. Qiu and J. Zhao, Chem. Eng. J., 2013, 219, 69–77 CrossRef CAS PubMed.
- A. Khenifi, Z. Derriche, C. Mousty, V. Prévot and C. Forano, Appl. Clay Sci., 2010, 47, 362–371 CrossRef CAS PubMed.
- J. T. Rajamathi, N. H. Raviraj, M. F. Ahmed and M. Rajamathi, Solid State Sci., 2009, 11, 2080–2085 CrossRef CAS PubMed.
- W. Stahlin and H. R. Oswald, Acta Crystallogr., Sect. B: Struct. Crystallogr. Cryst. Chem., 1970, 26, 860–863 CrossRef.
- R. Rojas, C. Barriga, M. Angeles Ulibarri, P. Malet and V. Rives, J. Mater. Chem., 2002, 12, 1071–1078 RSC.
- F. Delorme, A. Seron, M. Licheron, E. Veron, F. Giovannelli, C. Beny, V. Jean-Prost and D. Martineau, J. Solid State Chem., 2009, 182, 2350–2356 CrossRef CAS PubMed.
- T. Hara, M. Ishikawa, J. Sawada, N. Ichikuni and S. Shimazu, Green Chem., 2009, 11, 2034–2040 RSC.
- H. Morioka, H. Tagaya, M. Karasu, J. Kadokawa and K. Chiba, J. Mater. Res., 1998, 13, 848–851 CrossRef CAS.
- S. Yamanaka, T. Sako, K. Seki and M. Hattori, Solid State Ionics, 1992, 53, 527–533 CrossRef.
- A. S. Milev, G. S. K. Kannangara and M. A. Wilson, Langmuir, 2004, 20, 1888–1894 CrossRef CAS.
- L. Poul, N. Jouini and F. Fievet, Chem. Mater., 2000, 12, 3123–3132 CrossRef CAS.
- E. Kanezaki, Inorg. Chem., 1998, 37, 2588–2590 CrossRef CAS.
- H. Morioka, H. Tagaya, M. Karasu, J.-I. Kadokawa and K. Chiba, Inorg. Chem., 1999, 38, 4211–4216 CrossRef CAS.
- R. Hao, X. Xiao, X. Zuo, J. Nan and W. Zhang, J. Hazard. Mater., 2012, 209–210, 137–145 CrossRef CAS PubMed.
- J. Wang, X. Ren, X. Feng, S. Liu and D. Sun, J. Colloid Interface Sci., 2008, 318, 337–347 CrossRef CAS PubMed.
- S. Mandal, D. Tichit, D. A. Lerner and N. Marcotte, Langmuir, 2009, 25, 10980–10986 CrossRef CAS PubMed.
- P. Zhang, Q. An, J. Guo and C.-C. Wang, J. Colloid Interface Sci., 2013, 389, 10–15 CrossRef CAS PubMed.
- H. Fan, J. Zhu, J. Sun, S. Zhang and S. Ai, Chem.–Eur. J., 2013, 19, 2523–2530 CrossRef CAS PubMed.
- D. Chen, Y. Li, J. Zhang, W. Li, J. Zhou, L. Shao and G. Qian, J. Hazard. Mater., 2012, 243, 152–160 CrossRef CAS PubMed.
- H. Zaghouane-Boudiaf, M. Boutahala and L. Arab, Chem. Eng. J., 2012, 187, 142–149 CrossRef CAS PubMed.
- Y.-M. Zheng, N. Li and W.-D. Zhang, Colloids Surf., A, 2012, 415, 195–201 CrossRef CAS PubMed.
- F.-C. Wu, R.-L. Tseng, S.-C. Huang and R.-S. Juang, Chem. Eng. J., 2009, 151, 1–9 CrossRef CAS PubMed.
- V. K. Gupta, A. Mittal, R. Jain, M. Mathur and S. Sikarwar, J. Colloid Interface Sci., 2006, 303, 80–86 CrossRef CAS PubMed.
- Y. Yao, F. Xu, M. Chen, Z. Xu and Z. Zhu, Bioresour. Technol., 2010, 101, 3040–3046 CrossRef CAS PubMed.
- J. Zhou, Y. Cheng, J. Yu and G. Liu, J. Mater. Chem., 2011, 21, 19353–19361 RSC.
Footnote |
| † Electronic supplementary information (ESI) available: IR spectrum of LHZS, TG-DTA curve of LHZS, and N2 adsorption–desorption isotherms. See DOI: 10.1039/c3en00078h |
| This journal is © The Royal Society of Chemistry 2014 |

