 Open Access Article
 This Open Access Article is licensed under a Creative Commons Attribution-Non Commercial 3.0 Unported Licence
Energy positive domestic wastewater treatment: the roles of anaerobic and phototrophic technologies†
B. D.
Shoener
,
I. M.
Bradley
,
R. D.
Cusick
and
J. S.
Guest
*
University of Illinois at Urbana-Champaign – Civil & Environmental Engineering, 205 N. Mathews Avenue 3221 Newmark Civil Engineering Lab, Urbana, Illinois 61801, USA. E-mail: jsguest@illinois.edu
First published on 18th March 2014
Abstract
The negative energy balance of wastewater treatment could be reversed if anaerobic technologies were implemented for organic carbon oxidation and phototrophic technologies were utilized for nutrient recovery. To characterize the potential for energy positive wastewater treatment by anaerobic and phototrophic biotechnologies we performed a comprehensive literature review and analysis, focusing on energy production (as kJ per capita per day and as kJ m−3 of wastewater treated), energy consumption, and treatment efficacy. Anaerobic technologies included in this review were the anaerobic baffled reactor (ABR), anaerobic membrane bioreactor (AnMBR), anaerobic fluidized bed reactor (AFB), upflow anaerobic sludge blanket (UASB), anaerobic sequencing batch reactor (ASBR), microbial electrolysis cell (MEC), and microbial fuel cell (MFC). Phototrophic technologies included were the high rate algal pond (HRAP), photobioreactor (PBR), stirred tank reactor, waste stabilization pond (WSP), and algal turf scrubber (ATS). Average energy recovery efficiencies for anaerobic technologies ranged from 1.6% (MFC) to 47.5% (ABR). When including typical percent chemical oxygen demand (COD) removals by each technology, this range would equate to roughly 40–1200 kJ per capita per day or 110–3300 kJ m−3 of treated wastewater. The average bioenergy feedstock production by phototrophic technologies ranged from 1200–4700 kJ per capita per day or 3400–13![[thin space (1/6-em)]](https://www.rsc.org/images/entities/char_2009.gif) 000 kJ m−3 (exceeding anaerobic technologies and, at times, the energetic content of the influent organic carbon), with usable energy production dependent upon downstream conversion to fuels. Energy consumption analysis showed that energy positive anaerobic wastewater treatment by emerging technologies would require significant reductions of parasitic losses from mechanical mixing and gas sparging. Technology targets and critical barriers for energy-producing technologies are identified, and the role of integrated anaerobic and phototrophic bioprocesses in energy positive wastewater management is discussed.
000 kJ m−3 (exceeding anaerobic technologies and, at times, the energetic content of the influent organic carbon), with usable energy production dependent upon downstream conversion to fuels. Energy consumption analysis showed that energy positive anaerobic wastewater treatment by emerging technologies would require significant reductions of parasitic losses from mechanical mixing and gas sparging. Technology targets and critical barriers for energy-producing technologies are identified, and the role of integrated anaerobic and phototrophic bioprocesses in energy positive wastewater management is discussed.
 B. D. Shoener | Brian Shoener is a Jack Kent Cooke Foundation Graduate Scholar and M.S. student in Environmental Engineering at the University of Illinois at Urbana-Champaign. He holds dual B.S. degrees in Civil Engineering and Management for Engineers from Bucknell University. Brian's current research focuses on the advancement of anaerobic membrane bioreactor technology via quantitative sustainable design. More broadly, his interests are in process modeling and improving energy recovery from methanogenic wastewater treatment processes. |
 I. M. Bradley | Ian Bradley is a Deuchler Fellow and Ph.D. student in Environmental Engineering at the University of Illinois at Urbana-Champaign. He earned a B.S. degree in Industrial and Enterprise Systems Engineering and a M.S. degree in Civil and Environmental Engineering, both from the University of Illinois. Ian's current research focuses on algal growth for biofuel feedstock production in conjunction with wastewater treatment. He is interested in biological systems and process design for water and sanitation systems in the developed and developing world. |
 R. D. Cusick | Dr Cusick earned his B.S. in Environmental Engineering from the University of California, Riverside, holds an M.S. and Ph.D. in Environmental Engineering from the Pennsylvania State University and is now an Assistant Professor of Environmental Engineering at the University of Illinois at Urbana-Champaign. His research focuses the development of electrochemical technologies for nutrient and energy recovery from wastewater as well as natural and engineered salinity gradients. |
 J. S. Guest | Dr Guest is currently an Assistant Professor in the Department of Civil and Environmental Engineering at the University of Illinois at Urbana-Champaign. He holds B.S. and M.S. degrees in Civil Engineering from Bucknell University and Virginia Polytechnic Institute and State University, respectively, and a Ph.D. in Environmental Engineering from the University of Michigan. Dr Guest's interests center on biotechnology development for resource recovery from sanitation media, with particular emphasis on microalgae and methane-generating processes. His group works in developed and developing communities, and he currently serves as Thrust Leader for Sanitation and Resource Recovery for the Safe Global Water Institute. |
Environmental impactConventional wastewater treatment processes are energy-intensive and focus on removal of organics and nutrients rather than recovery. Re-envisioning wastewater as a renewable resource may enable energy positive treatment, creating economic incentives for increased access to sustainable sanitation in both developed and developing communities. To this end, anaerobic technologies can recover the chemical energy of organic carbon in wastewater as methane, hydrogen, and electricity. In a complementary fashion, phototrophic technologies could address a major limitation of anaerobic treatment (nutrient removal) while increasing the energetic potential of wastewater resources by leveraging nutrients for biomass growth and organic carbon storage. In this review we evaluate the strengths and weaknesses of these technologies and project a path toward energy positive wastewater treatment. |
1 Introduction
The sanitation industry is facing a confluence of events that are straining utility budgets1,2 and reducing their ability to provide reliable protection of public health and the aquatic environment.2 Critical challenges include rapid and localized population growth and decay;1,3–5 aging infrastructure;6 deterioration of surface waters resulting from excess nutrient (N and P) loading;7–10 and a reliance on expensive, energy-intensive11,12 treatment processes. These pressures are exacerbated by decreased resilience of ecosystems13–16 and increased variability in renewable freshwater resources17–19 resulting from climate change, with current energy-intensive approaches to wastewater treatment (consuming roughly 0.3–0.6 kW h m−3 of wastewater treated,20,21 or 3% of U.S. electricity demand12) further contributing to climate change via greenhouse gas emissions from electricity production.22,23 Ultimately, these stressors have intensified the need to address the water-energy nexus in wastewater management. Given that upgrades to U.S. infrastructure are expected to cost roughly $300 billion over the next 20 years,6 the industry has an unprecedented opportunity to re-envision wastewater streams as resource-rich sanitation media. In particular, treatment strategies enabling nutrient recovery as well as energy recovery and generation should be advanced, enabling resource positive sanitation – the management of wastewater as a renewable resource for nutrient recovery and net energy production24–26 that can have a net benefit for the environment27 – to gain traction at a broad scale.In response to these challenges, a great deal of research has been conducted on alternative wastewater treatment technologies that recover or produce energy during wastewater treatment. Most notably, anaerobic technologies can recover usable energy from organic carbon (typically measured as chemical oxygen demand, COD), and phototrophic technologies can increase the chemical energy of a wastewater through CO2 fixation during growth and carbon storage. In addition to the production of bioenergy products such as methane, hydrogen, or electricity,28–31 anaerobic processes are expected to be less energy intensive than aerobic processes due to a lack of aeration and a reduction in sludge wastage.32 Although published studies have analyzed the performance of one or a small number of anaerobic system designs,28,33–37 an in-depth comparison of technologies focusing on their potential in domestic wastewater management is still needed. The limited literature on anaerobic treatment of domestic wastewater is partially due to lower methane production, lower COD removal, and higher methane solubility, all of which stem from the fact that domestic wastewater is a relatively dilute resource stream.28 Ultimately, it is unclear whether the conversion of organic carbon to usable energy will be adequate for energy positive treatment using existing and emerging technologies.20,38
Beyond COD, nutrient (nitrogen, N; phosphorus, P) limits are becoming increasingly common across the U.S.39,40 In addition to high capital costs of wastewater treatment plant (WWTP) upgrades (e.g., $3.36–3.96 billion for the for plants discharging to the Chesapeake Bay watershed11), the addition of biological nutrient removal (BNR) incurs higher operational costs that create or exacerbate financial challenges for utilities.41 As an alternative to conventional BNR processes that leverage chemotrophic bacteria, phototrophic processes rely on light (typically sunlight) to promote growth and nutrient assimilation. As the phototrophs (including algae and cyanobacteria) take up inorganic carbon and grow, they also take up N and P from the wastewater and achieve nutrient recovery via assimilation. Studies have examined the potential for energy production using algae (e.g., ref. 42 and 43) and have even examined the potential for energy positive wastewater treatment,38 but such studies have been limited to single cultivation technologies. To our knowledge there has not been a comprehensive comparative assessment of existing and emerging phototrophic technologies as tools to enable energy positive domestic wastewater management. In fact, studies focusing on bioenergy feedstock production with phototrophs have been largely disjointed from the wastewater literature, often using high strength synthetic media for cultivation (e.g., ref. 44 and 45). The prospect of using phototrophs for nutrient recovery and/or bioenergy feedstock production holds significant promise, however, and warrants further discussion.
As researchers attempt to balance the potential gains in net energy production with performance and economic trade-offs of each technology, the range of configurations for anaerobic and phototrophic systems continues to grow. To better understand the status and relative potential of each configuration, we undertook a critical review of the literature to characterize the demonstrated energy production by and critical barriers to a range of anaerobic and phototrophic technologies that have the potential to contribute to energy positive wastewater management. Based on available data, we quantified the typical performance of technologies in terms of treatment efficacy and bioenergy (or bioenergy feedstock) production, including the production of methane, hydrogen gas, electricity, biocrude oil, biodiesel, and heat. Seeking a deeper understanding of the potential energy balance of each technology, we also quantified usable energy yield (based on downstream conversion of bioenergy feedstocks) and anticipated energy consumption (based on experimental conditions in published studies). To be considered energy positive, a wastewater treatment scheme was required to produce energy in excess of the energy required to operate the process while also discharging water that meets regulatory standards. Given these constraints, we identify technologies with the greatest potential to enable energy positive carbon, nitrogen, and phosphorus management and present operational and performance targets for anaerobic and phototrophic treatment technologies to improve their net energy balance.
2 Anaerobic systems
Anaerobic processes for bioenergy production are most commonly leveraged for industrial wastewater treatment or for solids management at domestic wastewater treatment facilities.32 Limited application of these systems stems from a perceived need for high organic loading rates and mesophilic temperatures.31 However, anaerobic technologies have been demonstrated at psychrophilic temperatures31,46,47 and have the potential to be applied more broadly for low-strength wastewater treatment.25 Anaerobic wastewater treatment processes can generally be categorized as suspended growth, sludge blanket, attached growth, membrane-based, or microbial electrochemical systems.32,48 The first step of COD degradation in anaerobic treatment systems is the fermentation of complex organic matter into long chain volatile fatty acids, carbon dioxide, and hydrogen by acidogenic microorganisms. Long chain fatty acids are then further fragmented into acetic acid and hydrogen. Methane (CH4) and hydrogen gas (H2) are possible bioenergy products from anaerobic systems. In methane-producing reactors, acetoclastic methanogens ferment acetic acid to methane and carbon dioxide and hydrogenotrophic methanogens convert hydrogen and carbon dioxide to methane.49 In microbial electrochemical technologies, exoelectrogenic bacteria oxidize acetate to carbon dioxide and produce electrical current transferring electrons to a conductive surface.50 The anaerobic systems considered in this review are described below.2.1 Suspended growth processes
Suspended growth processes are characterized by complete-mix conditions to prevent biomass from settling and to facilitate contact between the microorganisms and the wastewater. The most common processes include anaerobic sequencing batch reactors (ASBRs), completely-mixed anaerobic digesters, and the anaerobic contact process.32 Of these, only ASBR had adequate peer-reviewed data (i.e., >5 papers) on the treatment of domestic wastewater.2.2 Sludge blanket processes
Successful operation of anaerobic sludge blanket processes relies on the aggregation of organisms into diversely populated granules capable of settling.54 The granules form naturally from reactor operation and consist of a mixed population of bacteria and archaea that are able to carry out the overall fermentation and gas production from organic carbon substrates.55 The gas bubbles produced from methanogenesis help to fluidize the granules, enhancing mass transfer without mixing.55 Technologies with adequate (>5) peer-reviewed studies included the upflow anaerobic sludge blanket (UASB) and the anaerobic baffled reactor (ABR).2.3 Attached growth processes
Attached growth anaerobic technologies rely on packing material in the reactor to provide surfaces for biofilm formation. The primary characteristics that differentiate reactors within this category are the packing material type and degree of bed expansion.32 For example, the packed bed and fluidized bed configurations are operated at increasing upflow velocities, with fluidized bed being the highest. Because of the similarity of packed beds to the UASB and the availability of data for the fluidized system, only the anaerobic fluidized bed (AFB) was included.2.4 Membrane-based processes
Membranes have been used in water treatment for over half a century, and are becoming increasingly common in applications ranging from wastewater treatment to desalination.58 Microfiltration and ultrafiltration membranes are primarily used for particulate removal and can be arranged as flat sheets or hollow fibers.58 One of the main benefits of using membranes in biological treatment processes is the completely independent control of SRT and HRT; SRT values have been reported as high as 300 days, where biomass was only removed from the system during sampling.472.5 Microbial electrochemical technologies (METs)
METs (also referred to as bioelectrochemical systems, BES) leverage microorganisms capable of extracellular electron transfer29,59 to produce electrical energy from wastewater. Like all electrochemical technologies, such as fuel cells and batteries, METs are composed of an anode, where electrons for current are generated, and a cathode, where electrons are consumed. In METs, anaerobic bacteria naturally present in most wastewaters oxidize biodegradable organic matter and continuously transfer electrons to the anode.60 Electrons flow from the anode, through an external circuit, to a cathode, where electrical current is consumed in a reduction reaction.29 Current production in METs is dependent on the redox potential difference between organic matter oxidation at the anode (Eo = −0.32 V) and current consumption at the cathode.61 If the anode is more negative than the cathode, as in the case with oxygen reduction (Eo = 0.82 V) in a microbial fuel cell (MFC), electrical current production is spontaneous. If the cathode reaction occurs at a redox potential that is more negative than the anode, such as hydrogen production (Eo = −0.414 V) in a microbial electrolysis cell (MEC), then additional cell voltage must be applied to drive current production in the cell.29,62 Although a multitude of cathodic reactions (e.g., caustic production and hydrocarbon electro-synthesis48) have been paired with anodic oxidation of organic matter, the review will only focus on electricity and hydrogen production in METs.3 Phototrophic systems
Simple, passive phototrophic processes (cultivating algae and/or phototrophic bacteria) such as open ponds are commonly used to treat municipal and agricultural wastewaters.77 To date, the objective for these technologies tends to be nutrient (and often COD) removal from wastewater, rather than nutrient recovery or bioenergy feedstock production. Alternatively, more capital-intensive systems such as photobioreactors have been studied for phototroph cultivation, but this work has most often focused on bioenergy feedstock cultivation rather than wastewater treatment (e.g., ref. 78 and 79). Both types of systems predominantly operate with suspended cultures in open (e.g., ponds80) or closed systems (e.g., photobioreactors81) that allow for sunlight penetration and nutrient assimilation to promote growth and carbon storage before biomass is harvested.82 Alternative systems consist of attached or immobilized phototrophs for easier harvesting.83 Ultimately, the energetic benefit of phototrophic systems stems from the fact that they can increase the energetic content of wastewater through the conversion of light energy to chemical energy (as organic carbon). In order to evaluate the relative potential of phototrophic technologies in achieving energy positive municipal wastewater treatment, only published studies using actual wastewater as the growth medium have been included in the analysis.3.1 Suspended systems
Conventional phototrophic systems consist of suspended cultures that are operated in either continuous, batch, or semi-batch mode.84,85 The most common large-scale phototroph cultivation systems are waste stabilization ponds (WSPs),77 high rate algal ponds (HRAPs),80 stirred tank reactors,86 and tubular photobioreactors (PBRs).81,87 At laboratory-scale, a wider variety of reactor configurations have been evaluated, including flat panel (a.k.a., flat plate) and annular PBRs,78 as well as more basic well-mixed systems that are simply lit from overhead (these studies were classified as “Stirred Tank Reactors” for this review).883.2 Attached growth systems
The cost of biomass harvesting (including flocculation, centrifugation, and sedimentation82) remains a key barrier to the broad implementation of suspended growth algal systems.88 Although sedimentation is often the most inexpensive approach, it achieves low (50–90% (ref. 80 and 113)) biomass recoveries and is typically used when low value biomass is being removed from the system.114 Technologies that seek to achieve high percentages (>95%) of suspended biomass recovery for use as biofuel feedstock would add significantly to the cost of operation.80,115,116 As an alternative to suspended growth, attached growth systems restrict algal growth to physical structures resulting in aggregated biomass that either sloughs off the structures or can be removed through cleaning.117 While there are a number of different attached growth systems available (e.g., Algaewheel™ and other industrial solutions118 as well as various immobilized gel matrices119), the data necessary to perform the energetic analysis for most attached growth technologies was lacking. One exception was the algal turf scrubber (ATS), which has been the focus of a number of studies and which reported adequate data for its inclusion in this study.120,1214 Data analysis
4.1 Criteria for inclusion in this study
A comprehensive literature review was conducted on the technologies listed above, with a focus on studies demonstrating treatment of municipal-strength wastewaters (COD <500 g COD per m3). For phototrophic systems, comparison studies have found that synthetic wastewater, though displaying comparable nutrient removal rates, generates more biomass than wastewater-based studies85 and was thus excluded from this review. For methane producing systems, studies using synthetic wastewater with relevant COD concentrations were included because differences in performance (between synthetic and real wastewater) were not readily observed. For METs, all studies with influent COD <500 g COD per m3 used real wastewaters (i.e., all studies that used synthetic wastewater had COD values above 500 g COD per m3 and were thus excluded). Once relevant studies were identified, many were excluded from further analysis due to insufficient data that prevented the calculation of energy production normalized to contaminant removal. If a required value was not explicitly stated but prerequisite values were given, the unknown values were calculated (see Fig. S1 and S2 for inclusion/exclusion decision-making, ESI†). Ultimately, these data were used to report the effluent COD and energy (as kilojoules, kJ) recovered by anaerobic treatment as well as effluent N/P and energy produced by phototrophic technologies (Fig. 1).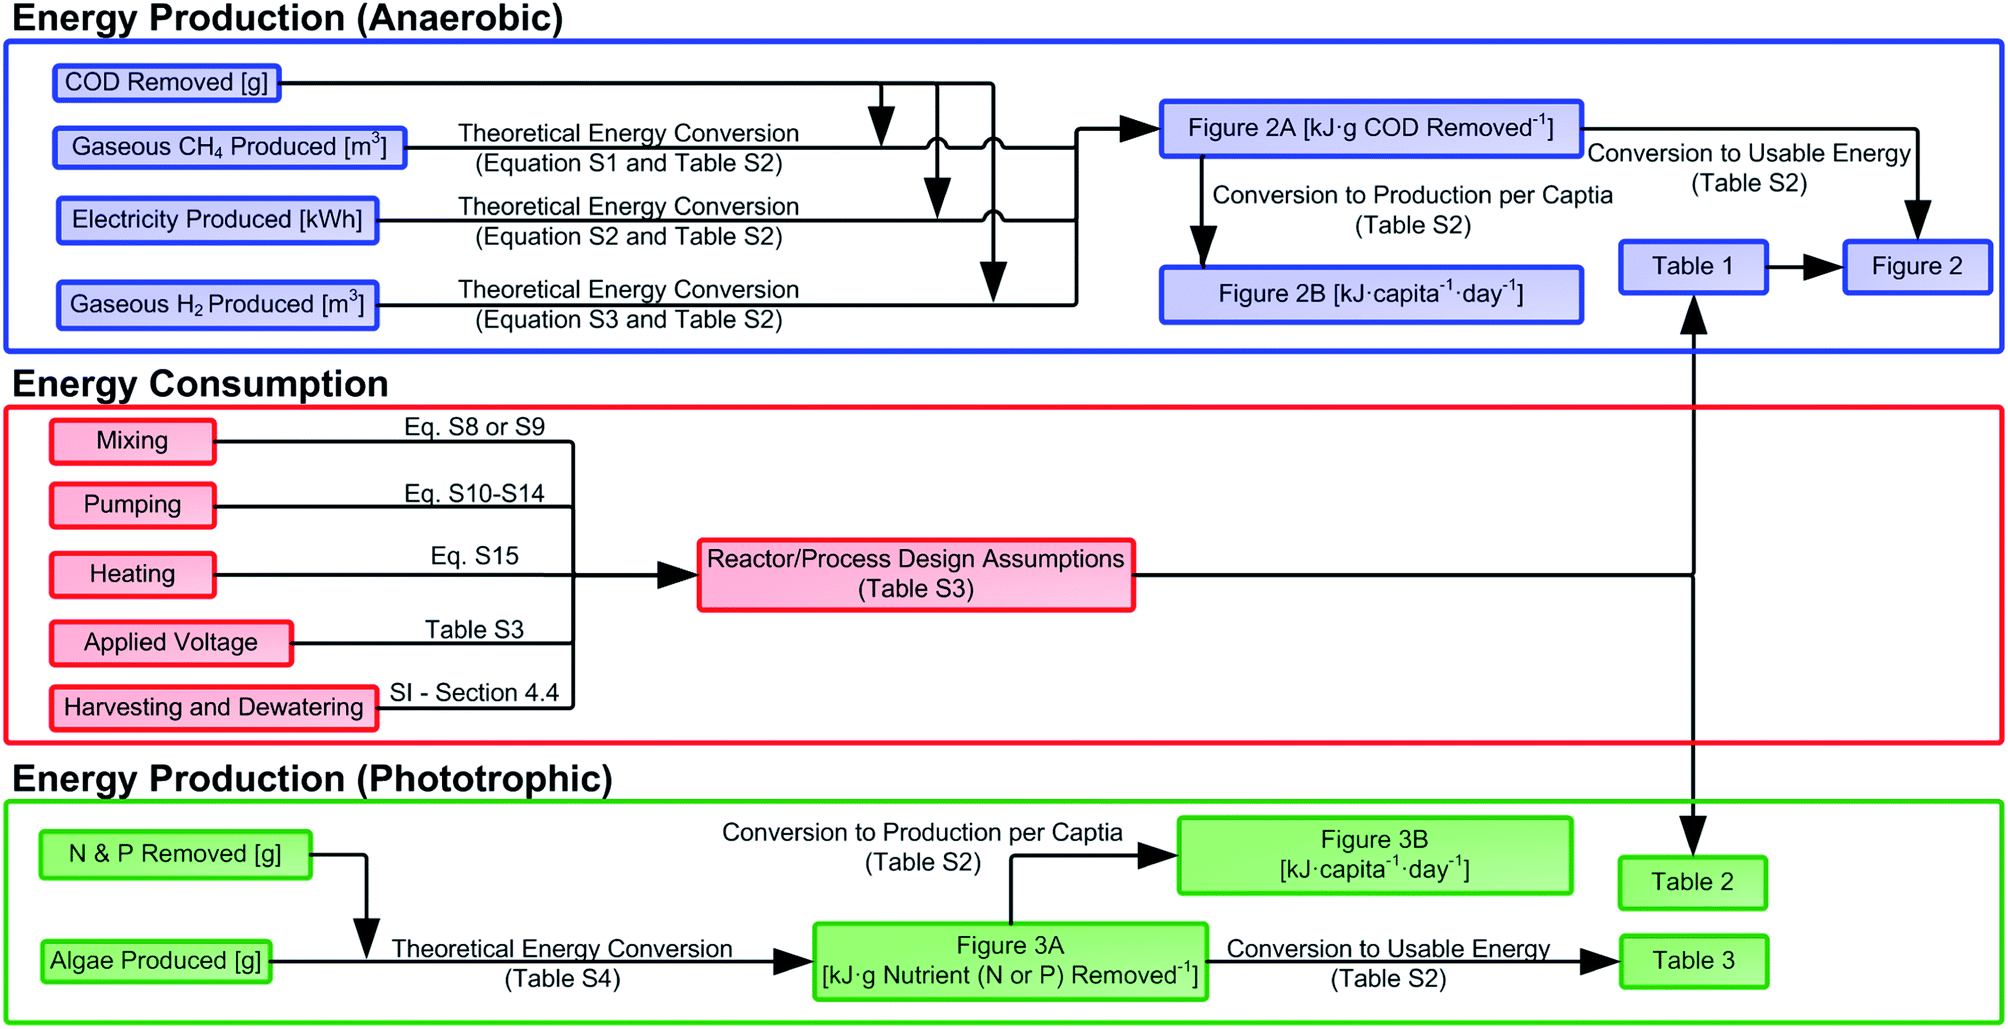 | ||
| Fig. 1 Flow chart showing the process of data acquisition and analysis used in the manuscript along with conversion factors and their location in the ESI.† | ||
4.2 Energetic analysis
In order to predict the production of usable energy from phototrophic biomass, the energy yield from four different conversion processes – hydrothermal liquefaction (HTL), transesterification, anaerobic digestion, and combustion – were also calculated. Although anaerobic digestion has a long history in the conversion of algal biomass to methane,108,109,134 direct combustion of algal biomass has been proposed as more energetically favorable than converting biomass to any biofuel.38,135 For the conversion of phototrophic biomass into liquid fuels, both transesterification and HTL were considered, with HTL representing an emerging process of interest to the algae-to-biodiesel community.136,137 HTL has been applied to wastewater-grown biomass (e.g., ref. 138 and 139), although energy balances have identified biomass harvesting and dewatering as key barriers to achieving energy positive systems.38 The list of assumptions and values used for these calculations can be found in Table S2 (ESI).†
4.3 Unit conversions and efficiency calculations
Data were normalized and reported in one of four ways: as energy per gram of pollutant removed, energy per capita, energy per cubic meter of wastewater treated, and as a percent of energetic potential recovered. Energetic data normalized to pollutant removal (kJ per gCOD, g N, or g P) was calculated directly from the published data sets included in the review. These data (in units of kJ per g pollutant removed) were then normalized to per capita values by multiplying (i) by the average percent removal of that pollutant by a given technology, and (ii) by the average daily per capita production of that pollutant (180 g COD; 13 g N; 2.1 g P141). Next, energy productions were also reported per cubic meter of wastewater treated by assuming a wastewater production rate of 0.36 m3 per person per day resulting in a wastewater composition of 500 g COD per m3, 36 g N per m3, 5.8 g P per m3. For efficiency calculations (e.g., percent of chemical energy recovered), COD was assumed to contain roughly 13.9 kJ per g COD,132 resulting in an influent energetic content of 7000 kJ m−3. This conversion factor is lower than more recent values reported in the literature (17.7–28.7 kJ per g COD142), but was used throughout the manuscript to provide a consistent framework for energy conversions. All energy values (in units of kJ) represent the energetic content of produced fuel (methane, hydrogen, or electricity) for anaerobic systems or produced biomass for phototrophic systems, unless otherwise noted (fuels are converted to electricity; biomass is converted to heat, methane, biodiesel, and biocrude oil).5 Results and discussion
In the review of the peer-reviewed literature a total of 225 anaerobic and 86 phototrophic papers were screened and assessed according to the inclusion criteria (Fig. S1 and S2†). Of the papers reporting on anaerobic technologies, only 32 met the necessary criteria for energetic and treatment analysis with a total of 122 experimental data sets (i.e., if the study reported multiple experimental conditions or replicates, all that met the inclusion criteria were included in this review). Published data on phototrophic technologies were less complete, with only 23 papers meeting the necessary criteria for treatment analysis with a total of 33 and 58 data sets for N and P removal, respectively. Of these papers, 13 had the necessary biomass productivity for energy analysis, resulting in 21 and 25 experimental data sets for energy production per g nutrient (N or P) removed (across 37 independent data sets). Furthermore, 9 of these 37 datasets were excluded because they reported greater than 50 g or 225 g of algal biomass grown per g N or g P removed, respectively, which was deemed to be outside the likely range of feasible biochemical compositions. Finally, WSPs were excluded from the energetic analysis due to a lack of biomass productivity data.5.1 Energetic analysis
The energetic analysis began by determining fuel (anaerobic) or bioenergy feedstock (phototrophic) production from each study and the associated caloric content (Section 5.1.1). Energy consumption (Section 5.1.2) of each technology was then estimated based on experimental conditions in published studies and on additional assumptions detailed in Section S4 of the ESI.† An energy balance between consumption and production was then detailed for anaerobic systems to estimate net energy given typical experimental conditions in order to identify key barriers to energy positive treatment (Section 5.2). An energy balance was excluded for phototrophic technologies because of the uncertainty associated with downstream conversion to usable fuels, but available data were leveraged to set targets for cultivation and downstream fuel conversion processes (discussed in Section 5.3). Lastly, we examined the dichotomy between emerging (energy production) and traditional (effluent quality) objectives for treatment technologies (Section 6).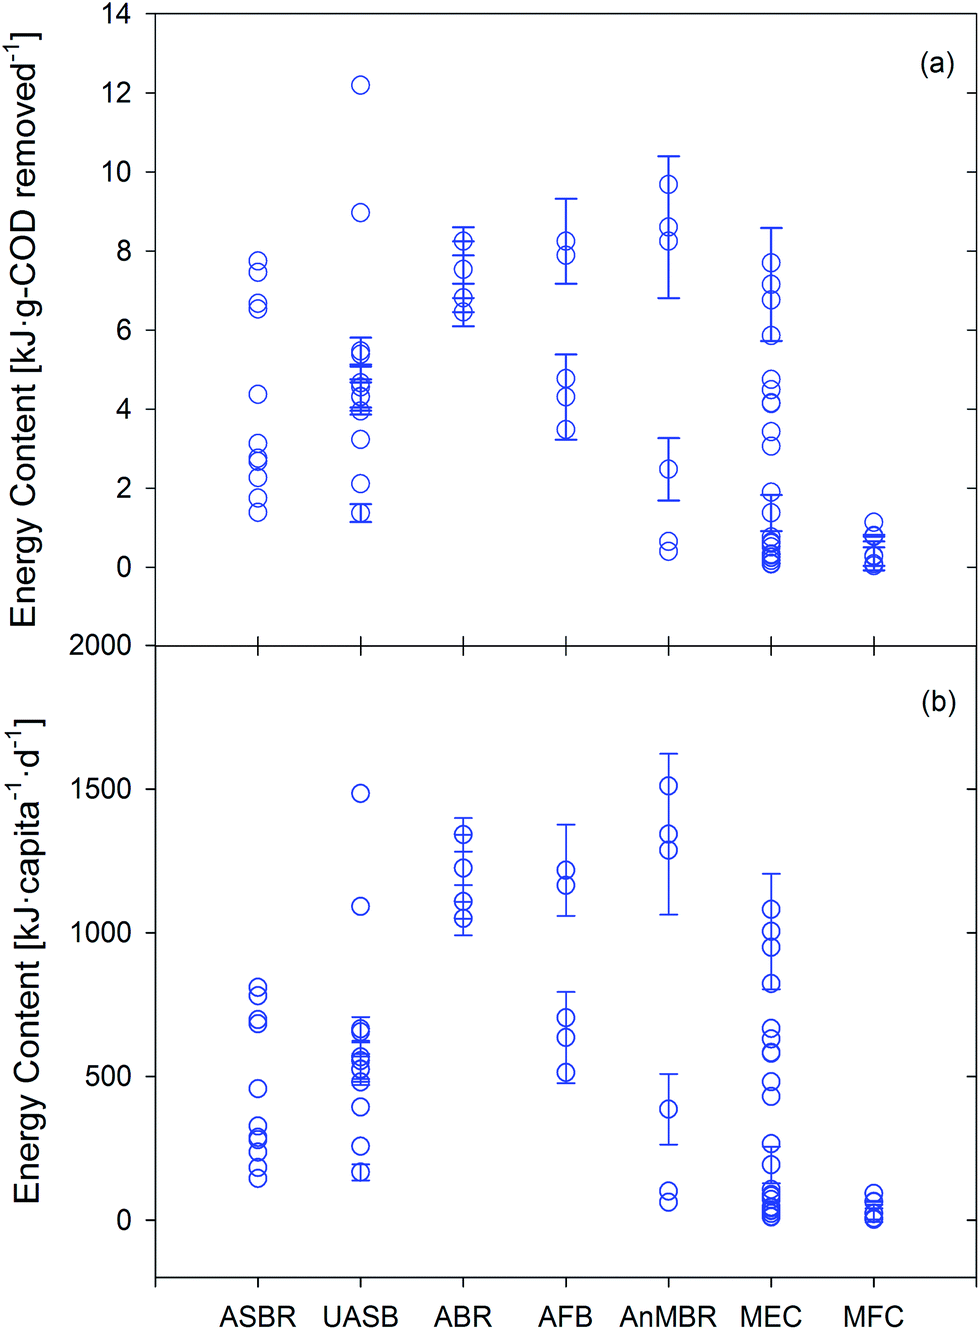 | ||
| Fig. 2 (a) Energy content [kJ fuel per g COD removed] for each paper studying anaerobic technologies with an influent COD below 500 g m−3 (for synthetic wastewater) or using actual domestic wastewater. (b) Energy content [kJ fuel per capita per day] determined by multiplying values from (a) by 180 g COD per capita per day and by the respective average percent COD removals for each technology (Table 1). All energy products (methane, hydrogen, electricity) are reported as kJ using theoretical unit conversions (see ESI†). Individual points represent distinct experimental data sets, with error bars extending to ±standard deviation (if reported). | ||
| Technology | Average percent removal (min, max) | |
|---|---|---|
| COD | ||
| ASBR | 58.1 (33, 91) | |
| UASB | 67.6 (54, 85) | |
| ABR | 90.3 (88.7, 92.5) | |
| AFB | 82 (72, 89.7) | |
| AnMBR | 86.7 (82, 90) | |
| MEC | 78 (33.7, 96.7) | |
| MFC | 45.5 (19, 83) | |
| N | P | |
| HRAP | 67.1 (36, 87.2) | 52.1 (32, 72.9) |
| PBR | 78.5 (68, 89.7) | 93.2 (85, 99) |
| Stirred tank | 62.3 | 78.2 (7, 100) |
| ATS | 70.5 (18.1, 90.7) | 78.6 (58.3, 95.7) |
Although discussions linking energy and nutrients in wastewater are generally focused on potential fertilizer offsets from nutrient recovery (e.g., ref. 26), the average energetic content of cultivated phototrophic biomass across all technologies (kJ per capita per day) was 130–510% of the energy saved from offsetting fertilizer production (assuming 100% nutrient recovery and 69 kJ per g N (ref. 143) and 7.6 kJ per g P (ref. 143) for synthetic fertilizer production). The average bioenergy feedstock production by phototrophic systems ranged from 210 kJ per g N (HRAP) to 760 kJ per g N (PBR), and 640 kJ per g P (PBR) to 2500 kJ per g P (stirred tank) (see Fig. 3a and Section S3.2 in ESI† for energy production values for each technology). On a per capita basis, the average energy production for each technology was as follows (if both N and P data were available in a given data set, the lesser prediction of biomass production based on per capita N and P was used): stirred tank reactor (4700 ± 3200 kJ per capita per day), ATS (2300 ± 1100 kJ per capita per day), HRAP (1800 ± 860 kJ per capita per day), and PBR (1200 ± 340 kJ per capita per day) (Fig. 3b). This range equates to 3400–13000 kJ m−3 of treated wastewater, or 280–400% of the potential recovery from methane-producing anaerobic technologies. As expected, the ratio of energy yield to P uptake was 2–14× higher as compared to N uptake (except for PBR data). One explanation for the low energy potential per gram of P in PBRs is the low N:P removal ratio reported by the majority PBR studies (all of which had influent N:P ratios less than 1). For HRAP, stirred tank reactors, and ATS systems, the ratio of N to P mass uptake was roughly 7.5 ± 3.0 (average ± standard deviation). These values are higher than typical assumptions of biochemical composition of microalgae using an N:P mass ratio of 4.5:1 (N:P molar ratio of 10:1; e.g., ref. 144), but within the range that algae can adapt their N:P ratio (reported mass ratios range from 2.3–45:1 ref. 145). In the case of PBR experiments, data analysis was limited to two wastewater-relevant studies with adequate data. Additionally, it is possible that low ratios of biomass production per P removed were partially the result of alternate mechanisms (other than growth) including luxury uptake of P (microalgae have been shown to accumulate up to ∼3× normal cellular P146) and P adsorption to cell surfaces.147 Additional sources of feedstock production variability may have included carbon limitation, reactor and process design, and/or differences in lighting efficiencies. Nutrient rich phototrophic systems are often carbon limited owing to a C:N molar ratio typically less than cell requirements (∼3:1 in typical wastewater vs. 6:1 cellular).32,148,149
 | ||
| Fig. 3 (a) Energy potential of phototrophic technologies [kJ algal biomass per g nutrient removed] showing relative bioenergy feedstock production based on nutrient removed (N or P). (b) Energy content [kJ algal biomass per capita per day] determined by multiplying values from (a) by 13 g N per capita per day or 2.1 g P per capita per day and by the respective average percent N and P removals for each technology (Table 1). Energy products are reported as kJ using theoretical unit conversions (see ESI†). Individual points represent distinct experimental data sets, with error bars extending from high to low COD/VSS assumptions (discussed in Section 4.2.2). | ||
Estimated energy consumption was highly variable across technologies (Tables 2 and 3), due to the wide range of experimental conditions and operational controls (e.g., fouling prevention and mitigation). All systems were assumed to be gravity fed, with energy consumption resulting from any additional operational requirements (assumptions detailed in Section S4 of ESI†). Since UASB, ABR, and MFC generally operate as passive systems, the operational energy consumption for these anaerobic technologies was minimal (assuming the reactor was not heated). Studies included in this analysis operated between 10 and 35 °C, but it should be noted the decision to heat would require roughly 4200 kJ m−3 per 1 °C increase above influent wastewater temperature; the magnitude of this energy demand underscores the importance of operation at ambient temperatures and the importance of developing anaerobic technologies capable of psychrophilic operation.
| Technology | Mixing | Pumping | Heating | Applied voltage |
|---|---|---|---|---|
| a Mechanical mixing (Section S4.1 and Table S3). b Effluent pumping (Section S4.5 and Table S3). c Biogas sparging (Section S4.2 and Table S3). d Permeate pumping (Section S4.5 and Table S3). e Recirculation pumping (Section S4.5 and Table S3). f Energy required for each increase in °C (not included in final energy balance) (Section S4.6 and Table S3). | ||||
| ASBR | 4800–9400a | 28–31b | 4200f | — |
| UASB | — | — | — | |
| ABR | — | — | — | |
| AnMBR | 42000–58000c |
36–120d | — | |
| AFB | — | 55–130e | — | |
| MEC | — | — | 2800–7900 | |
| MFC | — | — | — | |
| Technology | Mixing | Pumping | Harvestinga |
|---|---|---|---|
| a Low value is coagulation–flocculation with belt press filter for dewatering, high value is gravity settling with centrifugation (Section S4.4 and Table S3). b Paddlewheel mixing (Section S4.3 and Table S3). c Aeration (Section S4.2 and Table S3). d Influent lift pump (Section S4.5 and Table S3). e Mechanical mixing (Section S4.1 and Table S3). f Effluent pumping (Section S4.5 and Table S3). g Although minimal energy would be required for the physical harvesting of algae from ATS, it was not estimated due to lack of available data. | |||
| HRAP | 3.2–9.6b | — | 34–170 |
| PBR | 6300–13000c |
55–58d | |
| Stirred tank | 770–3100e | 28–31f | |
| WSP | — | — | |
| ATS | — | — | —g |
Although mechanical mixing and applied voltage result in appreciable energy consumption for ASBR and MEC, respectively, the largest source of energy consumption among anaerobic technologies was gas sparging to manage membrane fouling in AnMBR. Estimates of energy consumption from biogas sparging were based on published rates from 0.67 (ref. 150) to 0.93 (ref. 47) LGas LReactor−1 min−1, which represent very high rates of gas addition to reactors. Scale-up and more targeted gas scouring techniques can certainly reduce the gas flow demand,151 but the use of alternative approaches to fouling mitigation and prevention may be even more energetically favorable. In particular, external cross-flow AnMBR configurations34 or staged reactors with media for biofilm attachment152 may offer distinct advantages over submerged reactors, so long as the operational conditions are scalable and they mitigate fouling with less energy-intensive methods than gas scouring.
For phototrophic technologies, PBRs, which also rely on gas sparging for mixing, had the highest energy consumption. Typical sparging rates in PBRs are often 0.1–0.3 LGas LReactor−1 min−1,78,153 with actual rates in the field dependent upon biomass characteristics and tendency to aggregate. Ultimately, however, mixing requirements for algal systems are less than many chemotrophic systems due to decreased cell aggregation and a higher sensitivity of algal cells to shear forces.154 Passive systems such as WSP and ATS consume almost no energy during operation, as is also the case with HRAPs (which require very few paddlewheels per hectare). These systems require much larger land areas,86 however, resulting in a distinct trade-off between aerial productivity and energy consumption during cultivation.
5.2 Energy balance & treatment efficacy of anaerobic technologies
 | ||
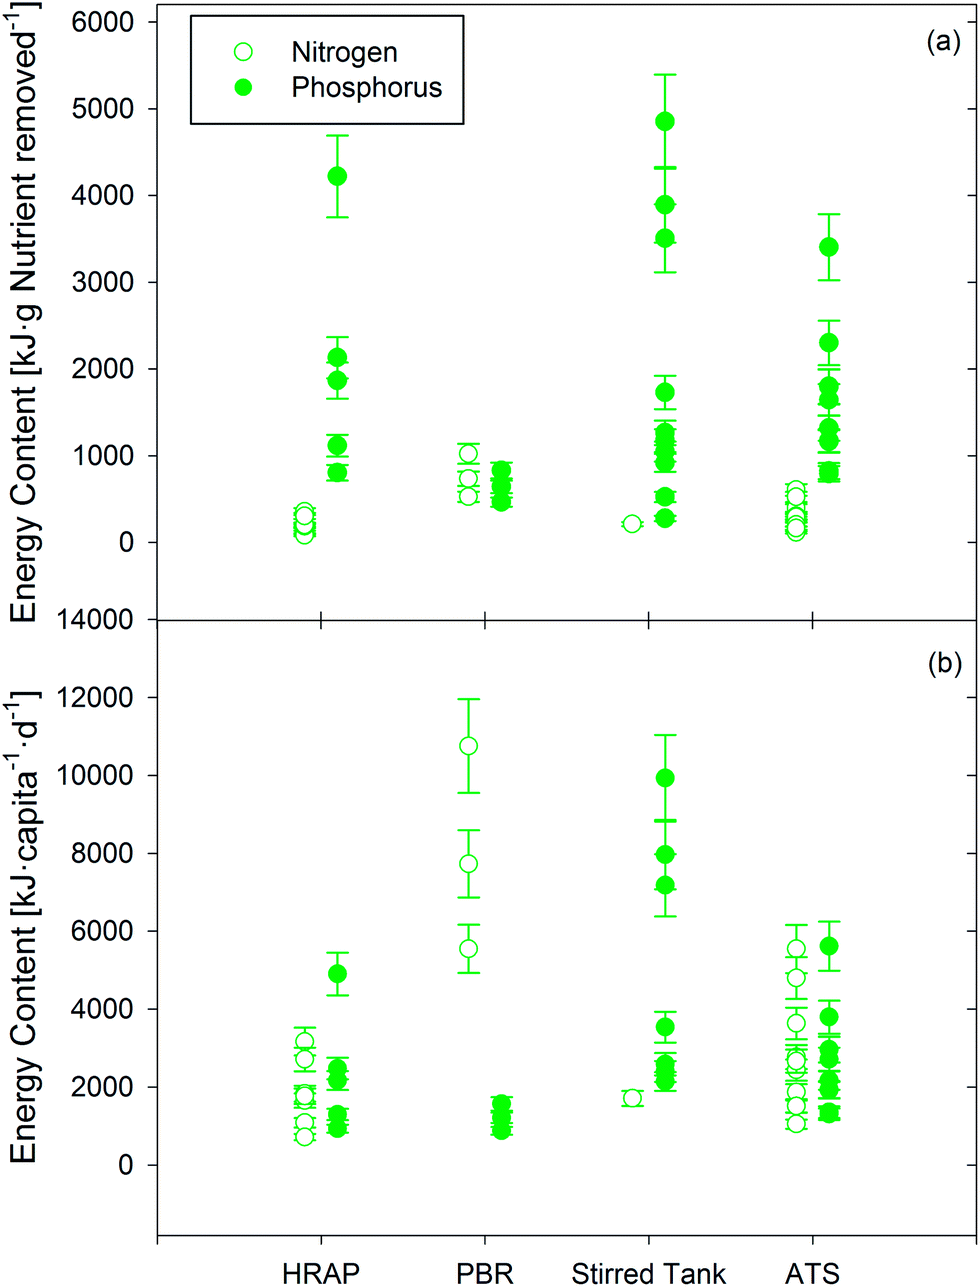
| Fig. 4 Energy recovery, consumption, and theoretical maximum energy yield for each technology. Blue circles represent energy production per gram of COD removed in experimental data sets from the literature. Red boxes – indicating the range of energy consumed that needs to be overcome for energy positive treatment (excluding heating requirements of the wastewater) – were calculated based on volumetric energy requirements (Table 2) coupled with typical COD removal of each technology (Table 1) and an assumed influent of 500 g COD per m3. Blue horizontal lines show the maximum energy that can be generated for methane (solid), hydrogen (dotted), and electricity (dashed) based on thermodynamics (calculations shown in the Section S3 of ESI†). | ||
Although all anaerobic technologies were capable of recovering energy, only four appear to be immediately capable of net energy positive operation: UASB, ABR, AFB, and MFC. It was assumed that three technologies (UASB, ABR, and MFC) could be operated as passive systems with no significant operational energy. For the remaining four technologies, energy consumption demands were exacerbated by COD removal efficiencies below 100% (e.g., ASBRs – 58.1% COD removal efficiency – require 1.7 m3 for every 500 g COD degraded). With ASBR energy recovery ranging from 1.4–7.7 kJ per g COD, the energy balance was hindered by the energy intensity of mechanical mixing (17–33 kJ per g COD) and, to a lesser extent, effluent pumping (0.10–0.11 kJ per g COD). To achieve energy neutrality, the energy for mixing must be drastically reduced. While AnMBRs achieved some of the highest energy recovery values (up to 86.7% with 0.4–9.7 kJ per g COD), continuous biogas sparging for mixing as well as to prevent and mitigate membrane fouling led to significant energy consumption (100–145 kJ per g COD). The gas flow rate needed for sparging would have to decrease by more than an order of magnitude to about 0.03 LGas LReactor−1 min−1 (with no increase in TMP) or alternative strategies for fouling management would have to be developed in order for energy neutrality to be achieved. Alternatively, the divide between energy recovery and consumption could be narrowed if methane recovery from the effluent were improved (on the order of 30–50% of produced methane may be lost to the effluent47,155). MEC energy consumption is a function of applied voltage and current production, and could be improved by developing cost effective low over-potential hydrogen evolution catalysts. However, operating any catalyst in wastewater will likely limit the kinetics of proton reduction. MECs have the highest energy recovery potential (based on the thermodynamics of hydrogen, methane, and electricity production; see Fig. 4 and Section S3.1, ESI†) and recovered more energy than MFCs, but the energy consumed by applying a voltage make MECs less energetically favorable than MFCs for low strength wastewater treatment.
 | ||
| Fig. 5 Influent vs. effluent COD [g m−3] from anaerobic treatment technologies treating real and synthetic wastewaters with influent COD concentrations <500 g m−3. Points and error bars represent averages ± standard deviations from experimental data sets. Plots (a)–(e) are separated by technology type (suspended growth, sludge blanket, etc.). The solid line is no COD removal (i.e., 0% removal), the dotted line is 80% removal, and the dashed line is 90% removal. | ||
5.3 Energy balance & treatment efficacy of phototrophic technologies
:N ratio.163
| Technology | Nutrient | HTL | Anaerobic digestion | Transesterification | Combustion |
|---|---|---|---|---|---|
| a Calculations and assumptions can be found in Table S4. b WSP could not be included due to lack of available biomass productivity data. c Data was not available to estimate kJ fuel per g N removed. | |||||
| HRAP | N | 75–160 | 32–160 | 34–100 | 90–130 |
| P | 730–1600 | 320–1500 | 330–980 | 880–1300 | |
| PBR | N | 270–590 | 120–580 | 120–370 | 330–500 |
| P | 230–500 | 100–490 | 100–310 | 280–420 | |
| Stirred tankc | P | 900–1900 | 400–1900 | 400–1200 | 1100–1600 |
| ATS | N | 110–240 | 47–230 | 49–150 | 130–200 |
| P | 580–1300 | 250–1200 | 260–790 | 700–1100 | |
As expected from the consumption data, PBRs and stirred tank reactors face the greatest difficulty in becoming energy neutral or positive, while HRAPs, WSPs, and ATSs may be energy positive once harvesting and low conversion efficiencies have been overcome.164 Although harvesting is often cited as one of the most critical energy challenges to meet,165 it is clear that mechanical mixing and aeration must also be reduced if these technologies are to be energy positive. Energy consumption for each cultivation technology (shown in Table 3 [kJ m−3] and Table S5† [kJ per g nutrient removed]) was highest for PBRs (230–470 kJ per g N and 1200–2400 kJ per g P) and stirred tank reactors (40–150 kJ per g N and 180–730 kJ per g P), while HRAPs had relatively low energy demand (2–7 kJ per g N and 10–60 kJ per g P) and WSPs and ATSs required no appreciable energy input during operation. When compared to the energy yield of various conversion technologies (Table 4), energy production by PBRs and stirred tank reactors may have potentially favorable energy balances depending on the conversion process and variability of biomass generation within each technology. HRAPs and ATSs, however, are far more likely to be energy positive across the range of biomass yields due to minimal operational energy demands (Table 3). Although data was not available to estimate energy yield from WSPs, they would also have the potential to achieve energy positive treatment if energy efficient biomass harvesting can be achieved.
It is important to note that the energy consumption calculated for this study does not include the energy needed for the conversion process itself. There is a large degree of uncertainty associated with these technologies, some of which (like HTL) have yet to be implemented on a large scale for phototrophic biomass. However, there is still room for these technologies to be net energy positive when incorporating conversion energy demand. For example, PBRs obtained a maximum energy yield of ∼580 kJ per g N for anaerobic digestion and HTL. With a cultivation energy demand of 230–470 kJ per g N (Table S5†), there is still 110–350 kJ per g N that can be used for driving the conversion process.
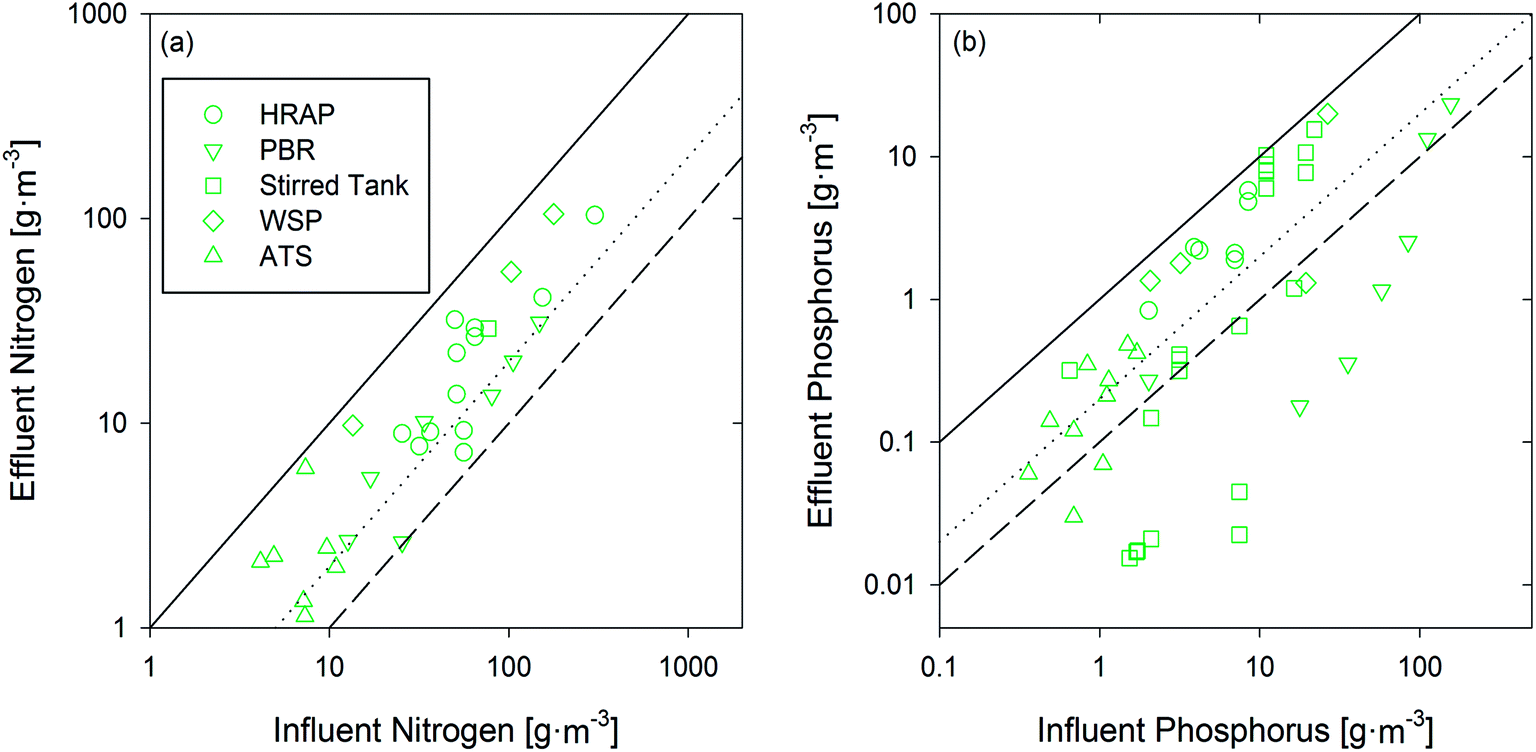 | ||
| Fig. 6 Influent vs. effluent (a) total N concentrations [g N per m3] and (b) total P concentrations [g P per m3] for suspended and attached growth systems on a log–log scale. The solid line identifies no nutrient removal, the dotted line 80% removal, and the dashed line 90% removal. | ||
When compared to energy consumption data, it can be seen that the technologies that require more energy (PBRs, stirred tank reactors) tend to perform better in meeting traditional treatment objectives such as N and P removal from wastewater. They also generate more biomass and more energy per gram nutrient removed (Fig. 3) with which to offset this energy consumption. Balancing increased nutrient removal and biomass yields (and thus, energy production) with higher energy demands will be a key challenge in the design and development of energy positive phototrophic systems.
6 Navigating a path to energy positive wastewater management
A striking conclusion of this review was that phototrophic processes have the potential to produce 280–400% of the amount of energy as anaerobic processes on a per m3 basis, given existing pollutant removal efficiencies and downstream conversion technologies. The energy recovery by anaerobic technologies reported in this manuscript (2–47%) assumes an energetic content for COD of 13.9 kJ per g COD, which has recently been found to be a low estimation.142 A higher energetic content would further reduce anaerobic energy recovery efficiency, whereas cultivating algae on nutrients and converting to fuels could exceed the original energetic content of the influent wastewater. Additionally, the use of nutrients for phototrophic cultivation may result in 130–510% of the energy production as would be offset by the use of nutrients for fertilization. An unfortunate finding of this review was the lack of adequate data to enable a coordinated analysis of both energy production and wastewater treatment. Of the 311 papers screened in the initial literature search, 82% could not be included because they did not measure or report adequate data. From the available data, it is clear that the potential exists for energy positive wastewater treatment and that both anaerobic and phototrophic may play a role. However, there are several critical barriers that must be overcome. Anaerobic processes must balance reduced energy consumption with increased treatment efficacy and fuel recovery, and we must develop a deeper understanding of phototrophic bioprocesses to enable process optimization. To this end, we examine the implications of this work and propose areas for future research.6.1 Implications of this work
This review examines the potential of various biotechnologies to directly treat domestic wastewater with a positive operating energy balance. For anaerobic technologies, influent COD is an important determinant of fuel production; higher COD concentrations lead to more energy recovery and less energy consumption (per gram of COD degraded). Since freshwater serves as a carrier for human waste in developed countries, domestic wastewater is often dilute, limiting the amount of energy that can be recovered during secondary treatment. For phototrophic technologies, a similar relationship exists between influent N and P concentrations and biomass yields. Despite limited energy recovery and production values, replacing energy intensive COD and nutrient removal processes could enable treatment plants that have already established solids digestion and on-site electricity generation to achieve energy positive operation.At the forefront of energy-conscious wastewater treatment with aerobic COD removal and BNR, an activated sludge WWTP in Strass, Austria has achieved energy self-sufficiency by implementing a high rate aerobic process, anammox treatment of nutrient rich side streams, and on-site electricity generation from biogas generated by solids digestion. A published COD mass balance and energy analysis of the plant indicated that 75% of the COD entering the plant is fed to a digester (61% primary and high rate solids and 14% waste solids from biological nutrient removal) and 36% is converted to biogas.166 The aerobic BNR process, in which 31% of the influent COD and 80% of the N is removed, accounted for 45% of energy consumption at the plant. The Strass WWTP COD mass balance was used to simulate the energetic potential of replacing the existing aerobic processes with anaerobic and phototrophic wastewater treatment. If the BNR process was replaced with an ABR to remove COD and a HRAP to remove nitrogen, total plant biogas production could potentially increase by 39% and energy recovery from COD could reach 41% (Section S5 of ESI†). The energetic content of biomass produced in the HRAP during N removal (2200 kJ per capita per day) was estimated to be more than twice as much as recovered biogas (1020 kJ per capita per day). If PBRs were employed rather than HRAPs, the estimated biomass energy content alone (7800 kJ per capita per day, assuming N-limited growth) could be more than three times the caloric energy content of wastewater entering the plant (2500 kJ per capita per day). More broadly, combined anaerobic and phototrophic processes could reduce energy demand and achieve energy recovery and production on the order of 5.0–9.2 kW h m−3 (using higher values for UASBs and PBRs) – well above the whole-plant energy demand of conventional WWTPs (0.3–0.6 (ref. 20 and 21)).
Though achieving energy and resource positive treatment in developed countries is an important goal for future treatment, far more urgent is the need to deploy sanitation infrastructure in developing and underdeveloped communities, where an estimated 2.5 billion people lack access to improved sanitation.167 Even in cases where individuals have access to bathroom facilities and collection systems, it is estimated that globally 1.5 billion people connected to sewerage infrastructure have their wastewater discharged without treatment.168 In developing communities in tropical regions, mainstream anaerobic treatment of domestic wastewater has been shown to be a viable means of achieving treatment goals while simultaneously producing biogas.169 This biogas, if utilized properly, could be an invaluable resource providing a consistent supply of electricity. In developing countries, effluent from anaerobic treatment processes (e.g., UASB) can be fed to WSP for further treatment.170,171 The data analysis presented in this review indicates that converting WSPs to HRAPs is a path toward more meaningful energy production from wastewater management. Ultimately, one of the greatest opportunities to advance wastewater treatment in developing communities is to recover resources that make wastewater management energy positive and financially viable.
6.2 Future research needs – anaerobic technologies
The experimental results complied in this review clearly show that energy recovery in the form of methane gas is significantly higher than energy recovery by MECs and MFCs. While methane-producing technologies do not require electrodes or applied voltage to generate fuel, converting biogas to electricity requires expensive auxiliary equipment (i.e., gas conditioning, storage, prime movers or fuel cells) and is currently only feasible at high flow wastewater treatment facilities (>30 MGD).133 Of the more the 1300 treatment plants that employ anaerobic digestion for solids management in the U.S., only 364 are sites generate enough biogas to make combined heat and power (CHP) financially viable, of which 104 currently generate electricity from biogas.133 Primary anaerobic treatment would make CHP accessible to smaller WWTPs, but it remains to be seen at what scale economic feasibility could be reached.Though methane is relatively insoluble in water (Henry's constant = 776 bar L mol−1), loss of dissolved methane in the wastewater effluent continues to be a critical challenge for anaerobic processes.172,173 This loss of fuel removes much of the potential for anaerobic processes to be energy positive, especially since energy savings from psychrophilic operation are in tension with increased energy losses due to higher methane solubility at lower temperatures.47 Finding alternative methods to recover dissolved methane without excessive energy input (i.e., using an amount of energy less than the amount recovered) will be pivotal to achieve energy positive treatment with AnMBR.
In terms of energy recovery, MFC bioelectricity was significantly lower than gaseous products. However, when fuel conversion to electricity was considered, the discrepancy between MFCs and gas-producing technologies was less substantial, indicating that MFCs may be a favorable option for distributed electricity production from wastewater. To capitalize on this potential, research efforts should focus on anode and passive-air cathode fabrication without the use of expensive materials as well as evaluation of power production from source separated waste streams. METs can also be designed to operate in concert with methane-producing processes to enhance treatment efficiency and recover nutrients. Allocating a portion of soluble organic energy to produce electrical current with MET electrodes could be leveraged toward electrolytic pH adjustment to volatilize and concentrate ammonia174–176 or recover N and P as struvite.177,178 Ionic current produced by MET could also be used to polarize capacitor electrodes and remove charge molecules such as nutrients and minerals from wastewater.179
6.3 Future research needs – phototrophic technologies
Although the predominant focus of nutrient research in the wastewater field has been on improving the efficiency of BNR by chemotrophic bacteria, the energetic potential of phototrophic processes warrants further development of these processes for energy positive nutrient management. In particular, more highly engineered systems that minimize footprint (like PBRs and stirred tank reactors) may have potential in advancing nutrient removal initiatives while also increasing the energy independence of treatment facilities. A critical challenge in achieving reliable and resilient phototrophic treatment systems, however, is a lack of understanding of how process design and operational decisions influence effluent quality, biomass productivity, and biochemical composition.144 Developing a deeper understanding of mixed community phototrophic biotechnology in the context of wastewater treatment will require long-term experimentation with real wastewaters under natural light (or simulated natural light) conditions with diurnal cycles. Targeted experimentation and modeling may enable process optimization, but a priority should be to determine how complex models will need to be to enable reliable predictions of performance across climates and wastewaters.180,181Harvesting and downstream processing to usable fuels are also opportunities for technology advancement, including research furthering the development of processing technologies that do not require complete drying of biomass prior to processing: anaerobic digestion and HTL hold particularly high potential in this regard. In addition to fundamental advancements to HTL and the management of waste products,182 a critical challenge is to link process design decisions with downstream processing to usable energy. Without a mechanistic understanding of the links among cultivation decisions, biochemical composition, harvesting, and processing to fuel, any attempts at process optimization are likely to result in trade-offs that may be obscured by energetic impacts of design and operational modifications.
7 Conclusion
The pursuit of energy positive domestic wastewater treatment is a necessity due to both the financial costs and the broader environmental impacts incurred by energy consumption. Beyond economic and environmental drawbacks, energy intensive treatment processes may also be infeasible for developing communities that may even lack the energy infrastructure to reliably treat wastewater aerobically. Based on the results of this review, it is clear that WWTPs can be net energy producers, especially if phototrophic technologies are leveraged to increase the energetic potential of wastewater through inorganic carbon fixation. In the search for energetically favorable technologies, however, there is a critical point to be made: we should not compromise traditional sanitary engineering objectives for wastewater treatment systems (i.e., effluent quality) to achieve energy positive performance, but rather seek to develop technologies that achieve equivalent or superior effluent quality by leveraging biological, chemical, and physical processes whose treatment efficacy is not in direct tension with their energy balance. Therefore, we should seek to advance technologies that have synergies between effluent quality and energy production, such as anaerobic and phototrophic technologies where every gram of pollutant removed increases the potential energy yield from the system.Acknowledgements
This work was partially funded by the King Abdullah University of Science and Technology (KAUST) Academic Partnership Program (UIeRA 2012-06291), and by the Center of Advanced Materials for the Purification of Water with Systems (WaterCAMPWS) under NSF Agreement Number CTS-0120978. The authors would like to acknowledge the Jack Kent Cooke Foundation for partial funding for B.D. Shoener, and the Safe Global Water Institute (SGWI) at the University of Illinois at Urbana-Champaign (UIUC) for partial funding for I.M. Bradley. We would also like to thank Cheng Zhong (UIUC) and Anthony Greiner (Hazen and Sawyer) for their assistance in energy consumption estimation, Shijie (Moses) Leow (UIUC) for discussions on hydrothermal liquefaction, and the anonymous reviewers for their constructive comments that strengthened the manuscript.References
- N. Carey, Reuters, 2013.
- Water Infrastructure Network, Clean and Safe Water for the 21st Century: A Renewed National Commitment to Water and Wastewater Infrastructure, Water Infrastructure Network, 2001 Search PubMed.
- J. Kotkin, Forbes, 2013.
- W. H. Frey, A Big City Growth Revival?, Brook. Inst., 2013 Search PubMed.
- US Census Bureau, 2013.
- ASCE, 2013 Report Card for America's Infrastructure, 2013 Search PubMed.
- H. W. Paerl, L. M. Valdes, A. R. Joyner, M. F. Piehler and M. E. Lebo, Environ. Sci. Technol., 2004, 38, 3068–3073 CrossRef CAS PubMed.
- D. J. Conley, H. W. Paerl, R. W. Howarth, D. F. Boesch, S. P. Seitzinger, K. E. Havens, C. Lancelot and G. E. Likens, Science, 2009, 323, 1014–1015 CrossRef CAS PubMed.
- W. M. Kemp, W. R. Boynton, J. E. Adolf, D. F. Boesch, W. C. Boicourt, G. Brush, J. C. Cornwell, T. R. Fisher, P. M. Glibert, J. D. Hagy, L. W. Harding, E. D. Houde, D. G. Kimmel, W. D. Miller, R. I. E. Newell, M. R. Roman, E. M. Smith and J. C. Stevenson, Mar. Ecol.: Prog. Ser., 2005, 303, 1–29 CrossRef.
- N. N. Rabalais, R. E. Turner and W. J. Wiseman Jr, Annu. Rev. Ecol. Syst., 2002, 33, 235–263 CrossRef.
- USEPA, Evaluation Report: Despite Progress, EPA Needs to Improve Oversight of Wastewater Upgrades in the Chesapeake Bay Watershed, USEPA, Office of the Inspector General, Washington, D.C., 2008 Search PubMed.
- USEPA, Wastewater Management Fact Sheet: Energy Conservation, Office of Water, 2006 Search PubMed.
- M. Waycott, C. M. Duarte, T. J. B. Carruthers, R. J. Orth, W. C. Dennison, S. Olyarnik, A. Calladine, J. W. Fourqurean, K. L. Heck, A. R. Hughes, G. A. Kendrick, W. J. Kenworthy, F. T. Short and S. L. Williams, Proc. Natl. Acad. Sci. U. S. A., 2009, 106, 12377–12381 CrossRef CAS PubMed.
- A. S. Mori, T. Furukawa and T. Sasaki, Biol. Rev., 2013, 88, 349–364 CrossRef PubMed.
- G. E. Ponce-Campos, M. S. Moran, A. Huete, Y. Zhang, C. Bresloff, T. E. Huxman, D. Eamus, D. D. Bosch, A. R. Buda, S. A. Gunter, T. H. Scalley, S. G. Kitchen, M. P. McClaran, W. H. McNab, D. S. Montoya, J. A. Morgan, D. P. C. Peters, E. J. Sadler, M. S. Seyfried and P. J. Starks, Nature, 2013, 494, 349–352 CrossRef CAS PubMed.
- J. R. Bernhardt and H. M. Leslie, Annu. Rev. Mar. Sci., 2013, 5, 371–392 CrossRef PubMed.
- Z. W. Kundzewicz, L. J. Mata, N. W. Arnell, P. Döll, B. Jimenez, K. Miller, T. Oki, Z. Şen and I. Shiklomanov, Hydrol. Sci. J., 2008, 53, 3–10 CrossRef.
- T. Oki and S. Kanae, Science, 2006, 313, 1068–1072 CrossRef CAS PubMed.
- G. A. Meehl and C. Tebaldi, Science, 2004, 305, 994–997 CrossRef CAS PubMed.
- P. L. McCarty, J. Bae and J. Kim, Environ. Sci. Technol., 2011, 45, 7100–7106 CrossRef CAS PubMed.
- USEPA, Clean Energy Opportunities in Water & Wastewater Treatment Facilities Background and Resources, 2009 Search PubMed.
- K. Mizuta and M. Shimada, Water Sci. Technol., 2010, 62, 2256–2262 CrossRef CAS PubMed.
- R. Gori, L.-M. Jiang, R. Sobhani and D. Rosso, Water Res., 2011, 45, 5858–5872 CrossRef CAS PubMed.
- J. S. Guest, S. J. Skerlos, J. L. Barnard, M. B. Beck, G. T. Daigger, H. Hilger, S. J. Jackson, K. Karvazy, L. Kelly, L. Macpherson, J. R. Mihelcic, A. Pramanik, L. Raskin, M. C. M. Van Loosdrecht, D. Yeh and N. G. Love, Environ. Sci. Technol., 2009, 43, 6126–6130 CrossRef CAS PubMed.
- G. T. Daigger, Water Environ. Res., 2009, 81, 809–823 CrossRef CAS PubMed.
- W. Verstraete, P. Van de Caveye and V. Diamantis, Bioresour. Technol., 2009, 100, 5537–5545 CrossRef CAS PubMed.
- M. B. Beck, F. Jiang, F. Shi, R. V. Walker, O. O. Osidele, Z. Lin, I. Demir and J. W. Hall, Proc. ICE - Eng. Sustain., 2010, 163, 31–46 CrossRef.
- A. L. Smith, L. B. Stadler, N. G. Love, S. J. Skerlos and L. Raskin, Bioresour. Technol., 2012, 122, 149–159 CrossRef CAS PubMed.
- R. A. Rozendal, A. W. Jeremiasse, H. V. M. Hamelers and C. J. N. Buisman, Environ. Sci. Technol., 2008, 42, 629–634 CrossRef CAS PubMed.
- R. D. Cusick, P. D. Kiely and B. E. Logan, Int. J. Hydrogen Energy, 2010, 35, 8855–8861 CrossRef CAS.
- G. Lettinga, S. Rebac and G. Zeeman, Trends Biotechnol., 2001, 19, 363–370 CrossRef CAS PubMed.
- G. Tchobanoglous, F. L. Burton and H. D. Stensel, Wastewater Engineering: Treatment and Reuse, McGraw-Hill Professional, 2003 Search PubMed.
- W. P. Barber and D. C. Stuckey, Water Res., 1999, 33, 1559–1578 CrossRef CAS.
- B.-Q. Liao, J. T. Kraemer and D. M. Bagley, Crit. Rev. Environ. Sci. Technol., 2006, 36, 489–530 CrossRef CAS.
- I. M. Nasir, T. M. Ghazi and R. Omar, Appl. Microbiol. Biotechnol., 2012, 95, 321–329 CrossRef PubMed.
- L. Seghezzo, G. Zeeman, J. B. van Lier, H. V. M. Hamelers and G. Lettinga, Bioresour. Technol., 1998, 65, 175–190 CrossRef CAS.
- K. Solanki, S. Subramanian and S. Basu, Bioresour. Technol., 2013, 131, 564–571 CrossRef CAS PubMed.
- B. S. M. Sturm and S. L. Lamer, Appl. Energy, 2011, 88, 3499–3506 CrossRef CAS.
- USEPA, Response to National Resources Defense Council Petition Requesting Secondary Treatment Nutrient Limits and Performance Data, USEPA, Office of Water, 2012 Search PubMed.
- USEPA, Memorandum: Working in Partnership with States to Address Phosphorus and Nitrogen Pollution through Use of a Framework for State Nutrient Reductions, USEPA, Office of Water, 2011 Search PubMed.
- J. S. Wang, S. P. Hamburg, D. E. Pryor, K. Chandran and G. T. Daigger, Environ. Sci. Technol., 2011, 45, 6239–6246 CrossRef CAS PubMed.
- L. Lardon, A. Hélias, B. Sialve, J.-P. Steyer and O. Bernard, Environ. Sci. Technol., 2009, 43, 6475–6481 CrossRef CAS PubMed.
- L. Batan, J. Quinn, B. Willson and T. Bradley, Environ. Sci. Technol., 2010, 44, 7975–7980 CrossRef CAS PubMed.
- C. Goodson, R. Roth, Z. T. Wang and U. Goodenough, Eukaryotic Cell, 2011, 10, 1592–1606 CrossRef CAS PubMed.
- G. O. James, C. H. Hocart, W. Hillier, H. Chen, F. Kordbacheh, G. D. Price and M. A. Djordjevic, Bioresour. Technol., 2011, 102, 3343–3351 CrossRef CAS PubMed.
- A. Larrosa-Guerrero, K. Scott, I. M. Head, F. Mateo, A. Ginesta and C. Godinez, Fuel, 2010, 89, 3985–3994 CrossRef CAS.
- A. L. Smith, S. J. Skerlos and L. Raskin, Water Res., 2013, 47, 1655–1665 CrossRef CAS PubMed.
- B. E. Logan and K. Rabaey, Science, 2012, 337, 686–690 CrossRef CAS PubMed.
- D. J. Batstone, J. Keller, I. Angelidaki, S. V. Kalyuzhnyi, S. G. Pavlostathis, A. Rozzi, W. T. M. Sanders, H. Siegrist and V. A. Vavilin, Water Sci. Technol., 2002, 45, 65–73 CAS.
- B. E. Logan, B. Hamelers, R. Rozendal, U. Schröder, J. Keller, S. Freguia, P. Aelterman, W. Verstraete and K. Rabaey, Environ. Sci. Technol., 2006, 40, 5181–5192 CrossRef CAS PubMed.
- R. R. Dague, C. E. Habben and S. R. Pidaparti, Water Sci. Technol., 1992, 26, 2429–2432 CAS.
- A. Sarti, B. S. Fernandes, M. Zaiat and E. Foresti, Desalination, 2007, 216, 174–182 CrossRef CAS.
- M. Zaiat, J. a. D. Rodrigues, S. M. Ratusznei, E. F. M. de Camargo and W. Borzani, Appl. Microbiol. Biotechnol., 2001, 55, 29–35 CrossRef CAS PubMed.
- K. S. Singh and T. Viraraghavan, J. Ferment. Bioeng., 1998, 85, 609–614 CrossRef CAS.
- B. E. Rittmann and P. L. McCarty, Environmental biotechnology: principles and applications, McGraw-Hill, Boston, 2001 Search PubMed.
- G. Lettinga, A. F. M. van Velsen, S. W. Hobma, W. de Zeeuw and A. Klapwijk, Biotechnol. Bioeng., 1980, 22, 699–734 CrossRef CAS.
- A. Bachmann, V. L. Beard and P. L. McCarty, Water Res., 1985, 19, 99–106 CrossRef CAS.
- D. W. Hendricks, Fundamentals of water treatment unit processes: physical, chemical, and biological, CRC Press, Boca Raton, 2011 Search PubMed.
- B. E. Logan and J. M. Regan, Trends Microbiol., 2006, 14, 512–518 CrossRef CAS PubMed.
- H. Liu, R. Ramnarayanan and B. E. Logan, Environ. Sci. Technol., 2004, 38, 2281–2285 CrossRef CAS PubMed.
- J. J. Heijnen, in Encyclopedia of Bioprocess Technology, John Wiley & Sons, Inc., 2002 Search PubMed.
- B. E. Logan, Microbial Fuel Cells, John Wiley & Sons, 2008 Search PubMed.
- S. Cheng, H. Liu and B. E. Logan, Electrochem. Commun., 2006, 8, 489–494 CrossRef CAS.
- D. Pant, G. Van Bogaert, L. Diels and K. Vanbroekhoven, Bioresour. Technol., 2010, 101, 1533–1543 CrossRef CAS PubMed.
- S. Hays, F. Zhang and B. E. Logan, J. Power Sources, 2011, 196, 8293–8300 CrossRef CAS.
- R. D. Cusick, Y. Kim and B. E. Logan, Science, 2012, 335, 1474–1477 CrossRef CAS PubMed.
- R. D. Cusick, M. Hatzell, F. Zhang and B. E. Logan, Environ. Sci. Technol., 2013, 47, 14518–14524 CrossRef CAS PubMed.
- J. R. Kim, G. C. Premier, F. R. Hawkes, J. Rodríguez, R. M. Dinsdale and A. J. Guwy, Bioresour. Technol., 2010, 101, 1190–1198 CrossRef CAS PubMed.
- F. Zhang, Z. Ge, J. Grimaud, J. Hurst and Z. He, Environ. Sci. Technol., 2013, 47, 4941–4948 CrossRef CAS PubMed.
- D. Call and B. E. Logan, Environ. Sci. Technol., 2008, 42, 3401–3406 CrossRef CAS PubMed.
- J. Ditzig, H. Liu and B. E. Logan, Int. J. Hydrogen Energy, 2007, 32, 2296–2304 CrossRef CAS.
- L. Lu, D. Xing, B. Liu and N. Ren, Water Res., 2012, 46, 1015–1026 CrossRef CAS PubMed.
- A. Escapa, L. Gil-Carrera, V. García and A. Morán, Bioresour. Technol., 2012, 117, 55–62 CrossRef CAS PubMed.
- E. S. Heidrich, J. Dolfing, K. Scott, S. R. Edwards, C. Jones and T. P. Curtis, Appl. Microbiol. Biotechnol., 2013, 97, 6979–6989 CrossRef CAS PubMed.
- R. D. Cusick, B. Bryan, D. S. Parker, M. D. Merrill, M. Mehanna, P. D. Kiely, G. Liu and B. E. Logan, Appl. Microbiol. Biotechnol., 2011, 89, 2053–2063 CrossRef CAS PubMed.
- G. K. Rader and B. E. Logan, Int. J. Hydrogen Energy, 2010, 35, 8848–8854 CrossRef CAS.
- USEPA, Wastewater Technology Fact Sheet: Facultative Lagoons, 2002 Search PubMed.
- C. Posten, Eng. Life Sci., 2009, 9, 165–177 CrossRef CAS.
- R. N. Singh and S. Sharma, Renewable Sustainable Energy Rev., 2012, 16, 2347–2353 CrossRef CAS.
- R. J. Craggs, S. Heubeck, T. J. Lundquist and J. R. Benemann, Water Sci. Technol., 2011, 63, 660–665 CrossRef CAS PubMed.
- Y. Chisti, Biotechnol. Adv., 2007, 25, 294–306 CrossRef CAS PubMed.
- E. Molina Grima, E.-H. Belarbi, F. G. Acién Fernández, A. Robles Medina and Y. Chisti, Biotechnol. Adv., 2003, 20, 491–515 CrossRef CAS PubMed.
- Y. Cohen, Bioresour. Technol., 2001, 77, 257–274 CrossRef CAS PubMed.
- J. C. M. Pires, M. C. M. Alvim-Ferraz, F. G. Martins and M. Simões, Environ. Sci. Pollut. Res., 2013, 20, 5096–5105 CrossRef CAS PubMed.
- A. Ruiz-Marin, L. G. Mendoza-Espinosa and T. Stephenson, Bioresour. Technol., 2010, 101, 58–64 CrossRef CAS PubMed.
- M.-O. P. Fortier and B. S. M. Sturm, Environ. Sci. Technol., 2012, 46, 11426–11434 CrossRef CAS PubMed.
- L. Rodolfi, G. C. Zittelli, N. Bassi, G. Padovani, N. Biondi, G. Bonini and M. R. Tredici, Biotechnol. Bioeng., 2009, 102, 100–112 CrossRef CAS PubMed.
- J. K. Pittman, A. P. Dean and O. Osundeko, Bioresour. Technol., 2011, 102, 17–25 CrossRef CAS PubMed.
- K. L. Terry and L. P. Raymond, Enzyme Microb. Technol., 1985, 7, 474–487 CrossRef.
- J. B. K. Park and R. J. Craggs, Water Sci. Technol., 2010, 61, 633–639 CrossRef CAS PubMed.
- W. J. Oswald and C. G. Golueke, Adv. Appl. Microbiol., 1960, 2, 223–262 CAS.
- O. Jorquera, A. Kiperstok, E. A. Sales, M. Embiruçu and M. L. Ghirardi, Bioresour. Technol., 2010, 101, 1406–1413 CrossRef CAS PubMed.
- A. L. Stephenson, E. Kazamia, J. S. Dennis, C. J. Howe, S. A. Scott and A. G. Smith, Energy Fuels, 2010, 24, 4062–4077 CrossRef CAS.
- L. Xu, P. J. Weathers, X.-R. Xiong and C.-Z. Liu, Eng. Life Sci., 2009, 9, 178–189 CrossRef CAS.
- E. Molina Grima, F. G. A. Fernández, F. García Camacho and Y. Chisti, J. Biotechnol., 1999, 70, 231–247 CrossRef CAS.
- A. P. Carvalho, L. A. Meireles and F. X. Malcata, Biotechnol. Prog., 2006, 22, 1490–1506 CrossRef CAS PubMed.
- O. Pulz, Appl. Microbiol. Biotechnol., 2001, 57, 287–293 CrossRef CAS PubMed.
- J. M. Valigore, P. a. Gostomski, D. G. Wareham and A. D. O'Sullivan, Water Res., 2012, 46, 2957–2964 CrossRef CAS PubMed.
- G. Samorì, C. Samorì, F. Guerrini and R. Pistocchi, Water Res., 2013, 47, 791–801 CrossRef PubMed.
- N. Renuka, A. Sood, S. K. Ratha, R. Prasanna and A. S. Ahluwalia, J. Appl. Phycol., 2013, 25, 1529–1537 CrossRef CAS.
- S. M. Oakley, A. Pocasangre, C. Flores, J. Monge and M. Estrada, Water Sci. Technol., 2000, 42, 51–58 CAS.
- L. G. Rich, Unit Operations of Sanitary Engineering, J. Wiley & Sons, Incorporated, 1961 Search PubMed.
- T. P. Curtis, D. D. Mara and S. A. Silva, Appl. Environ. Microbiol., 1992, 58, 1335–1343 CAS.
- O. C. Romero, A. P. Straub, T. Kohn and T. H. Nguyen, Environ. Sci. Technol., 2011, 45, 10385–10393 CrossRef CAS PubMed.
- T. Kohn and K. L. Nelson, Environ. Sci. Technol., 2007, 41, 192–197 CrossRef CAS PubMed.
- D. Mara, Design Manual for Waste Stabilization Ponds in India, Lagoon Technology International Ltd., 1997 Search PubMed.
- D. Mara, Desalin. Water Treat., 2009, 4, 85–88 CrossRef.
- C. G. Golueke and W. J. Oswald, Sol. Energy, 1963, 7, 86–92 CrossRef CAS.
- C. G. Golueke, W. J. Oswald and H. B. Gotaas, Appl. Microbiol., 1957, 5, 47–55 CAS.
- J. R. Benemann, J. C. Weissman, B. L. Koopman and W. J. Oswald, Nature, 1977, 268, 19–23 CrossRef CAS.
- R. J. Craggs, C. C. Tanner, J. P. S. Sukias and R. J. Davies-Colley, Water Sci. Technol., 2003, 48, 291–297 CAS.
- K. L. Abis and D. D. Mara, Water Sci. Technol., 2003, 48, 1–7 CAS.
- R. J. Craggs, R. J. Davies-Colley, C. C. Tanner and J. P. Sukias, Water Sci. Technol., 2003, 48, 259–267 CAS.
- Y. Nurdogan and W. J. Oswald, Water Sci. Technol., 1996, 33, 229–241 CrossRef CAS.
- J. J. Milledge and S. Heaven, Rev. Environ. Sci. Biotechnol., 2012, 12, 165–178 CrossRef.
- N. Uduman, Y. Qi, M. K. Danquah, G. M. Forde and A. Hoadley, J. Renewable Sustainable Energy, 2010, 2, 012701 CrossRef.
- B. T. Higgins and A. Kendall, J. Ind. Ecol., 2012, 16, 436–447 CrossRef CAS.
- L. Christenson and R. Sims, Biotechnol. Adv., 2011, 29, 686–702 CrossRef CAS PubMed.
- L. E. De-Bashan and Y. Bashan, Bioresour. Technol., 2010, 101, 1611–1627 CrossRef CAS PubMed.
- E. Kebede-westhead, C. Pizarro, W. W. Mulbry and A. C. Wilkie, J. Phycol., 2003, 39, 1275–1282 CrossRef.
- W. W. Mulbry and A. C. Wilkie, J. Appl. Phycol., 2001, 13, 301–306 CrossRef.
- W. Mulbry, S. Kondrad, C. Pizarro and E. Kebede-Westhead, Bioresour. Technol., 2008, 99, 8137–8142 CrossRef CAS PubMed.
- R. J. Craggs, Water Sci. Technol., 2001, 44, 427–433 CAS.
- R. J. Craggs, W. H. Adey, K. R. Jenson, M. S. St. John, F. B. Green and W. J. Oswald, Water Sci. Technol., 1996, 33, 191–198 CrossRef CAS.
- National Academy of Science, Committee on Alternatives and Strategies for Future Hydrogen Production and Use, National Research Council, and National Academy of Engineering, The Hydrogen Economy: Opportunities, Costs, Barriers, and R&D Needs, 2004.
- M. R. Brown, S. W. Jeffrey, J. K. Volkman and G. A. Dunstan, Aquaculture, 1997, 151, 315–331 CrossRef CAS.
- A. Richmond and Q. Hu, Handbook of Microalgal Culture: Applied Phycology and Biotechnology, Wiley-Blackwell, 2nd edn, 2013 Search PubMed.
- A. H. Stouthamer, Antonie Van Leeuwenhoek Int. J. Gen. Mol. Microbiol., 1973, 39, 545–565 CrossRef CAS.
- C. P. L. Grady Jr, G. T. Daigger, N. G. Love and C. D. M. Filipe, Biological Wastewater Treatment, CRC Press, 3 edn, 2012 Search PubMed.
- F. B. Metting Jr, J. Ind. Microbiol., 1996, 17, 477–489 CrossRef.
- P. Spolaore, C. Joannis-Cassan, E. Duran and A. Isambert, J. Biosci. Bioeng., 2006, 101, 87–96 CrossRef CAS PubMed.
- W. F. Owen, Energy in Wastewater Treatment, Prentice-Hall, Inc., Englewood Cliffs, 1982 Search PubMed.
- USEPA, RDC, ERG, and CHPP, Opportunities for Combined Heat and Power at Wastewater Treatment Facilities: Market Analysis and Lessons from the Field, 2011 Search PubMed.
- C. G. Golueke and W. J. Oswald, Appl. Microbiol., 1959, 7, 219–227 CAS.
- A. F. Clarens, H. Nassau, E. P. Resurreccion, M. A. White and L. M. Colosi, Environ. Sci. Technol., 2011, 45, 7554–7560 CrossRef CAS PubMed.
- T. M. Brown, P. Duan and P. E. Savage, Energy Fuels, 2010, 24, 3639–3646 CrossRef CAS.
- V. Patil, K.-Q. Tran and H. R. Giselrød, Int. J. Mol. Sci., 2008, 9, 1188–1195 CrossRef CAS PubMed.
- D. R. Vardon, B. K. Sharma, J. Scott, G. Yu, Z. Wang, L. Schideman, Y. Zhang and T. J. Strathmann, Bioresour. Technol., 2011, 102, 8295–8303 CrossRef CAS PubMed.
- G. W. Roberts, M.-O. P. Fortier, B. S. M. Sturm and S. M. Stagg-Williams, Energy Fuels, 2013, 27, 857–867 CrossRef CAS.
- T. D. Reynolds and P. A. Richards, Unit Operations and Processes in Environmental Engineering, PWS Publishing Company, 1996 Search PubMed.
- G. Tchobanoglous, H. D. Stensel, R. Tsuchihashi and F. L. Burton, Wastewater Engineering: Treatment and Resource Recovery, McGraw-Hill Higher Education; McGraw-Hill [distributor], New York; London, 5th edn, 2013 Search PubMed.
- E. S. Heidrich, T. P. Curtis and J. Dolfing, Environ. Sci. Technol., 2011, 45, 827–832 CrossRef CAS PubMed.
- C. W. Gellings and K. E. Parmenter, in Knowledge for Sustainable Development—An Insight into the Encyclopedia of Life Support Systems, Eloss Publishers, Oxford, UK, 2004, vol. II, pp. 419–450 Search PubMed.
- J. S. Guest, M. C. M. van Loosdrecht, S. J. Skerlos and N. G. Love, Environ. Sci. Technol., 2013, 47, 3258–3267 CAS.
- R. J. Geider and J. La Roche, Eur. J. Phycol., 2002, 37, 1–17 CrossRef.
- N. Powell, A. N. Shilton, S. Pratt and Y. Chisti, Environ. Sci. Technol., 2008, 42, 5958–5962 CrossRef CAS PubMed.
- S. A. Sañudo-Wilhelmy, A. Tovar-Sanchez, F.-X. Fu, D. G. Capone, E. J. Carpenter and D. A. Hutchins, Nature, 2004, 432, 897–901 CrossRef PubMed.
- R. Craggs, D. Sutherland and H. Campbell, J. Appl. Phycol., 2012, 24, 329–337 CrossRef CAS.
- I. Woertz, A. Feffer, T. Lundquist and Y. Nelson, J. Environ. Eng., 2009, 135, 1115–1122 CrossRef CAS.
- I. Vyrides and D. C. Stuckey, Water Res., 2009, 43, 933–942 CrossRef CAS PubMed.
- I.-S. Chang and S. J. Judd, Process Biochem., 2002, 37, 915–920 CrossRef CAS.
- R. Yoo, J. Kim, P. L. McCarty and J. Bae, Bioresour. Technol., 2012, 120, 133–139 CrossRef CAS PubMed.
- G. Yu, Y. Li, G. Shen, W. Wang, C. Lin, H. Wu and Z. Chen, J. Appl. Phycol., 2009, 21, 719–727 CrossRef CAS.
- C. Gudin and D. Chaumont, Bioresour. Technol., 1991, 38, 145–151 CrossRef.
- J. Kim, K. Kim, H. Ye, E. Lee, C. Shin, P. L. McCarty and J. Bae, Environ. Sci. Technol., 2011, 45, 576–581 CrossRef CAS PubMed.
- A. M. Illman, A. H. Scragg and S. W. Shales, Enzyme Microb. Technol., 2000, 27, 631–635 CrossRef CAS PubMed.
- J. Ma and O. Hemmers, J. Energy Resour. Technol., 2011, 133, 011801 CrossRef.
- D. R. Vardon, B. K. Sharma, G. V. Blazina, K. Rajagopalan and T. J. Strathmann, Bioresour. Technol., 2012, 109, 178–187 CrossRef CAS PubMed.
- P. E. Savage, Science, 2012, 338, 1039–1040 CrossRef CAS PubMed.
- A. A. Peterson, F. Vogel, R. P. Lachance, M. Fröling, M. J. Antal Jr and J. W. Tester, Energy Environ. Sci., 2008, 1, 32–65 CAS.
- A. Hospido, M. Carballa, M. Moreira, F. Omil, J. M. Lema and G. Feijoo, Water Res., 2010, 44, 3225–3233 CrossRef CAS PubMed.
- H. Wang, S. L. Brown, G. N. Magesan, A. H. Slade, M. Quintern, P. W. Clinton and T. W. Payn, Environ. Sci. Pollut. Res. Int., 2008, 15, 308–317 CrossRef PubMed.
- B. Sialve, N. Bernet and O. Bernard, Biotechnol. Adv., 2009, 27, 409–416 CrossRef CAS PubMed.
- USDOE, National algal biofuels technology roadmap, Office of Energy Efficiency and Renewable Energy, Biomass Program, 2010 Search PubMed.
- J. B. K. Park, R. J. Craggs and a. N. Shilton, Water Res., 2011, 45, 6637–6649 CrossRef CAS PubMed.
- B. Wett, K. Buchauer and C. Fimml, Energy self-sufficiency as a feasible concept for wastewater treatment systems, Singapore, 2007, pp. 21–24 Search PubMed.
- WHO and UNICEF, Progress on Sanitation and Drinking-water – 2013 Update, WHO/UNICEF Joint Monitoring Programme for Water Supply and Sanitation Report, WHO, Office of Publication, France, 2013 Search PubMed.
- R. Baum, J. Luh and J. Bartram, Environ. Sci. Technol., 2013, 47, 1994–2000 CrossRef CAS PubMed.
- B. Heffernan, J. B. van Lier and J. van der Lubbe, Water Sci. Technol., 2011, 63, 100–107 CrossRef CAS PubMed.
- F. El Hafiane and B. El Hamouri, Water Sci. Technol., 2005, 51, 125–132 CAS.
- L. Seghezzo, A. P. Trupiano, V. Liberal, P. G. Todd, M. E. Figueroa, M. A. Gutiérrez, A. C. D. S. Wilches, M. Iribarnegaray, R. G. Guerra, A. Arena, C. M. Cuevas, G. Zeeman and G. Lettinga, Appl. Biochem. Biotechnol., 2003, 109, 167–180 CrossRef CAS PubMed.
- W. M. K. R. T. W. Bandara, H. Satoh, M. Sasakawa, Y. Nakahara, M. Takahashi and S. Okabe, Water Res., 2011, 45, 3533–3540 CrossRef CAS PubMed.
- M. M. Benjamin, Water Chemistry, Waveland Press, Long Grove, Illinois, 2010 Search PubMed.
- P. Kuntke, K. M. Śmiech, H. Bruning, G. Zeeman, M. Saakes, T. H. J. A. Sleutels, H. V. M. Hamelers and C. J. N. Buisman, Water Res., 2012, 46, 2627–2636 CrossRef CAS PubMed.
- P. Kuntke, M. Geleji, H. Bruning, G. Zeeman, H. V. M. Hamelers and C. J. N. Buisman, Bioresour. Technol., 2011, 102, 4376–4382 CrossRef CAS PubMed.
- J. Desloover, A. Abate Woldeyohannis, W. Verstraete, N. Boon and K. Rabaey, Environ. Sci. Technol., 2012, 46, 12209–12216 CrossRef CAS PubMed.
- R. D. Cusick and B. E. Logan, Bioresour. Technol., 2012, 107, 110–115 CrossRef CAS PubMed.
- R. D. Cusick, M. L. Ullery, B. A. Dempsey and B. E. Logan, Water Res., 2014, 54, 297–306 CrossRef CAS PubMed.
- C. Forrestal, P. Xu and Z. Ren, Energy Environ. Sci., 2012, 5, 7161–7167 CAS.
- G. T. Daigger, Water Sci. Technol., 2011, 63, 516–526 CrossRef CAS PubMed.
- K. J. Flynn, Limnol. Oceanogr., 2003, 48, 2243–2249 CrossRef CAS.
- M. Pham, L. Schideman, J. Scott, N. Rajagopalan and M. J. Plewa, Environ. Sci. Technol., 2013, 47, 2131–2138 CrossRef CAS PubMed.
Footnote |
| † Electronic supplementary information (ESI) available. See DOI: 10.1039/c3em00711a |
| This journal is © The Royal Society of Chemistry 2014 |