Bubble bursting as an aerosol generation mechanism during an oil spill in the deep-sea environment: molecular dynamics simulations of oil alkanes and dispersants in atmospheric air/salt water interfaces
Thilanga P.
Liyana-Arachchi†‡
,
Zenghui
Zhang†
,
Franz S.
Ehrenhauser§
,
Paria
Avij
,
Kalliat T.
Valsaraj
and
Francisco R.
Hung
*
Cain Department of Chemical Engineering, Louisiana State University, Baton Rouge, LA 70803, USA. E-mail: frhung@lsu.edu
First published on 15th November 2013
Abstract
Potential of mean force (PMF) calculations and molecular dynamics (MD) simulations were performed to investigate the properties of oil n-alkanes [i.e., n-pentadecane (C15), n-icosane (C20) and n-triacontane (C30)], as well as several surfactant species [i.e., the standard anionic surfactant sodium dodecyl sulfate (SDS), and three model dispersants similar to the Tween and Span species present in Corexit 9500A] at air/salt water interfaces. This study was motivated by the 2010 Deepwater Horizon (DWH) oil spill, and our simulation results show that, from the thermodynamic point of view, the n-alkanes and the model dispersants have a strong preference to remain at the air/salt water interface, as indicated by the presence of deep free energy minima at these interfaces. The free energy minimum of these n-alkanes becomes deeper as their chain length increases, and as the concentration of surfactant species at the interface increases. The n-alkanes tend to adopt a flat orientation and form aggregates at the bare air/salt water interface. When this interface is coated with surfactants, the n-alkanes tend to adopt more tilted orientations with respect to the vector normal to the interface. These simulation results are consistent with the experimental findings reported in the accompanying paper [Ehrenhauser et al., Environ. Sci.: Processes Impacts 2013, in press, (DOI: 10.1039/c3em00390f)]. The fact that these long-chain n-alkanes show a strong thermodynamic preference to remain at the air/salt water interfaces, especially if these interfaces are coated with surfactants, makes these species very likely to adsorb at the surface of bubbles or droplets and be ejected to the atmosphere by sea surface processes such as whitecaps (breaking waves) and bubble bursting. Finally, the experimental finding that more oil hydrocarbons are ejected when Corexit 9500A is present in the system is consistent with the deeper free energy minima observed for the n-alkanes at the air/salt water interface at increasing concentrations of surfactant species.
Environmental impactOur molecular simulation results show that linear alkanes representative of intermediate- and semi-volatile organic compounds released during the 2010 Deepwater Horizon accident, as well as model dispersants representative of species from Corexit 9500A, exhibit deep free energy minima when they are at the air/salt water interface. Therefore, these n-alkanes and dispersants are very likely to adsorb at the surface of bubbles or droplets, and be ejected to the atmosphere by sea surface processes such as whitecaps (breaking waves) and bubble bursting. These results suggest that aerosolization via bursting bubbles and breaking waves at the sea surface can be an important transport mechanism for the ejection of non-volatile oil spill organics into the atmosphere. |
1. Introduction
Due to the Deepwater Horizon (DWH) accident on April 20, 2010, about 4.9 million barrels of oil (779 × 106 L) were released into the waters of the Gulf of Mexico from the day of the accident until July 2010, resulting in the largest oil spill ever in the Gulf of Mexico region, and causing significant environmental damage.1–3 Despite the large amount of Corexit oil dispersants used (1.8 million gallons, or 6.81 × 10⁶ L),2,3 a considerable fraction of the oil–gas mixture released was able to reach the surface of the sea, and a significant fraction of this oil evaporated into the atmosphere and contributed to the formation of organic aerosols.4–9 According to these studies, the small hydrocarbons containing less than 10 carbon atoms either dissolved in the sea water or evaporated within a few hours of reaching the sea surface. The hydrocarbons containing 10 to 16 carbon atoms evaporated in a period ranging from a few hours to a few days; in contrast, hydrocarbons containing more than 16 carbon atoms evaporated very slowly, if at all.4–9 These volatile and intermediate-volatile organic carbon (VOC and IVOC) compounds that evaporated could then undergo oxidization reactions in the atmosphere, leading to the formation of compounds that contribute to the formation of secondary organic aerosols (SOAs). Aerosol particles scatter solar radiation and provide an environment for the condensation of water during processes such as cloud formation, which in turn have effects on air quality and climate change.10,11 Therefore, understanding SOAs is important to determine the fate of pollutants in the atmosphere; however, SOAs remain poorly understood at present.12,13As indicated in the accompanying paper,14 the transport of oil spill matter via aerosolization, i.e., the non-evaporative ejection of material into the atmosphere, was not considered in detail in the previous studies mentioned above.4–9 When a wave breaks, several bubble-bursting mechanisms lead to the formation of sea spray, film and jet droplets,15 which can carry some of the material present at the sea surface into the atmosphere.16 The generation of sea spray by whitecaps caused by waves is known to be one of the primary production mechanisms for particulate matter in the atmosphere, capable of generating 3.5 × 10¹² kg per year,17 and representing a major mechanism of production of cloud condensation nuclei (CCN) and aerosols in the atmosphere.18–20 During the DWH accident, significant amounts of oil components such as heavier IVOCs (hydrocarbons with 16 to 18 carbon atoms), as well as semi-volatile organic compounds (SVOCs, hydrocarbons with 19 to 31 carbon atoms) could have also reached the sea surface despite the large amounts of Corexit dispersants used; in fact, a significant amount of dispersant could have also reached the sea surface. Because these compounds are of large molecular weight, evaporation is not a likely transport mechanism of these compounds into the atmosphere. The working hypothesis of the study presented here and in the accompanying paper,14 is that sea-surface phenomena such as whitecaps (breaking waves) and bubble bursting can eject part of the oil IVOCs and SVOCs, as well as the dispersants that were able to reach the sea surface into the atmosphere. These processes can generate water droplets that contain oil and gas components, marine salts, and dispersants. Given that the relative humidity in the marine atmospheric boundary layer is high (typically in excess of 60%), these sea spray aerosols exist as concentrated saline droplets in this boundary layer. Theoretical studies also point to the importance of SVOCs and IVOCs as important precursors in aerosol formation.21,22
A fundamental understanding of the properties of oil hydrocarbons and dispersants at atmospheric air/salt water interfaces is therefore crucial for these systems. Previous simulations on adsorption of polycyclic aromatic hydrocarbons (PAHs) and reactive oxygen species on the interfaces of air with pure water or ice (i.e., no salts dissolved) have established the presence of deep free energy minima for adsorption of these species at these interfaces.23–31 Other experimental and simulation studies have focused on the interfacial properties of aqueous salt solutions with or without surfactants (i.e., no organic molecules adsorbed).32–44 Several experimental and simulation studies have focused on the properties of air/water interfaces (i.e., no salts dissolved) when alkanes with less than 12 carbon atoms are adsorbed at the interface;45–54 the structural properties of water at the interface and the interfacial width is known to be significantly influenced by the presence of hydrocarbons and surfactants at air/water interfaces.55–58 Nevertheless, to the best of our knowledge, no studies have focused on the properties of alkanes with more than 15 carbon atoms when they are adsorbed on air/salt water interfaces, when dispersants are present. In direct relation to the experimental work presented in the accompanying paper,14 here we report classical molecular dynamics (MD) simulations and potential of mean force (PMF) calculations to study the properties of the linear alkanes n-pentadecane (C15), n-icosane (C20) and n-triacontane (C30), on atmospheric air/salt water interfaces. We focused on these particular n-alkanes because they are representative of IVOCs and SVOCs in Louisiana sweet crude oil, and because they have been found in analysis of oil mousse samples from the DWH oil spill (see accompanying paper14). We then compared these interfacial properties against those obtained for similar systems when surfactants are present in the air/salt water interfaces. Here we considered a standard anionic surfactant, sodium dodecyl sulfate (SDS), as well as three model dispersant molecules that aimed at representing the main characteristics of the Tween and Span nonionic surfactant species present in Corexit 9500A59–64 (Fig. 1a). Because these species are particularly large for the all-atom simulations used in this study, as a first approximation we decided to adopt the three simplified model dispersants S1, S2 and S3 shown in Fig. 1b. We also investigated how the structural properties of the n-alkanes change with variations in the concentration of surfactants. These simulations were performed in combination with the experimental studies shown in the accompanying paper,14 with the objectives of fundamentally understanding the interfacial properties of these systems and providing a molecular-level picture of the phenomena observed in the experiments. Such a fundamental understanding is crucial to test our working hypothesis, that processes such as aerosolization via the bursting of whitecap bubbles are likely mechanisms for the ejection of oil spill matter (i.e., heavier IVOCs and SVOCs) into the atmosphere. We emphasize that our MD simulations provide a view into phenomena taking place at the nanoscale in these interfacial systems. These molecular-level phenomena then determine the thermodynamic properties in the air/salt water interfaces present in sea spray, whitecaps, film and jet droplets.15,16 The rest of this article is structured as follows. Section 2 contains details of our computational models and methods. The main results and discussion from this study are presented in Section 3, and concluding remarks are included in Section 4.
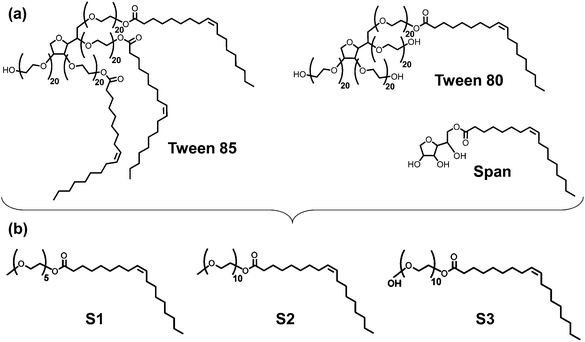 | ||
| Fig. 1 (a) Some of the nonionic surfactant species present in Corexit 9500A. (b) Model dispersant molecules S1, S2 and S3 used in this study. | ||
2. Simulation details
2.1. Models and methods
Classical all-atom MD simulations were performed to study the properties of the linear alkanes n-pentadecane (C15), n-icosane (C20) and n-triacontane (C30), as well as the standard anionic surfactant SDS and three model dispersant molecules representative of species found in Corexit 9500A at air/salt water interfaces at 298 K. For simplicity, salt water was modeled as a NaCl–water solution. In addition, and because our main focus is on the properties of the n-alkanes and the surfactants/dispersants, we have modeled water using the non-polarizable SPC/E model,65 and for NaCl we used the non-polarizable parameters from the work of Vácha et al.66 These NaCl parameters were initially developed using a polarizable water model; however, the study of Auffinger et al.67 showed that this NaCl model is also consistent with the SPC/E water model. In future studies we intend to evaluate similar systems using polarizable force fields for water and the salts, which might be needed to capture specific ion effects at the interfaces.32–38 We used the OPLS-all atom force field68 to model the n-alkanes C15, C20 and C30. Parameters for the SDS molecules were taken from the work of Polat et al.,69 which in turn is based on the OPLS-all atom force field.68 Our model dispersant molecules aimed at representing the main characteristics of the Tween and Span nonionic surfactant species present in Corexit 9500A59–64 (Fig. 1a). Because these species are particularly large for all-atom simulations, as a first approximation we decided to adopt the three simplified model dispersants S1, S2 and S3 shown in Fig. 1b. Our three model dispersants have molecular architectures common to the Tween and Span species of Corexit 9500A. The hydrophobic tail in all three model dispersants is the same, but we slightly varied the length of the polyethylene glycol chain (5 units in S1, and 10 units in S2 and S3). In addition, one of the sides of the S3 molecules is capped with an OH group, whereas those sides of S1 and S2 are capped with a methyl group (Fig. 1b).We used the GROMACS software70 to perform all our MD simulations in the NVT ensemble (constant number of molecules, volume and temperature). In our simulations we considered orthorhombic simulation boxes of dimensions 60 Å × 60 Å × 300 Å (x, y and z respectively) and periodic boundary conditions were applied in all three directions. We placed 5805 SPC/E water molecules and 63 NaCl ion pairs in the middle of the simulation box, creating a salt water slab with two air/salt water interfaces. This results in a salt water slab with salinity comparable to that of sea water. In the present study we performed both potential of mean force (PMF) calculations and conventional MD simulations. In the former series of calculations, we determined the free energy profile associated with moving one molecule of interest (i.e., one molecule of C15, C20 or C30, or one molecule of S1, S2 or S3) between the liquid and gas phases and across the air/salt water interface. The PMF of S1, S2 and S3 were determined using bare air/salt water interfaces; in contrast, the PMF of C15, C20 and C30 were calculated across air/salt water interfaces that were bare, or coated with either SDS or S3. All PMF calculations were run at 298 K for a total of up to 2 ns, from which up to 1.5 ns were used for accumulating averages. Our MD simulations also included bare as well as SDS- or S3-coated air/salt water systems, which were equilibrated for up to 5 ns and at least 5 ns were used for accumulating averages. In these MD simulations we considered varying concentrations of n-alkanes, SDS or S3 molecules. Remaining simulation details are exactly the same as those used in our previous publications.23,24,29–31,71,72
3. Results and discussion
3.1. PMF of alkanes and model dispersants
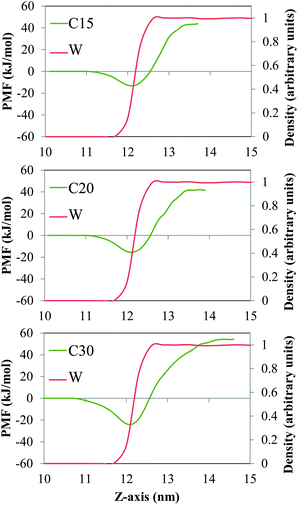
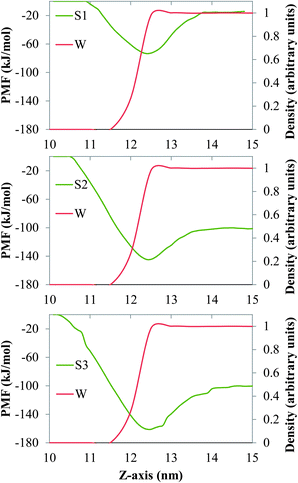
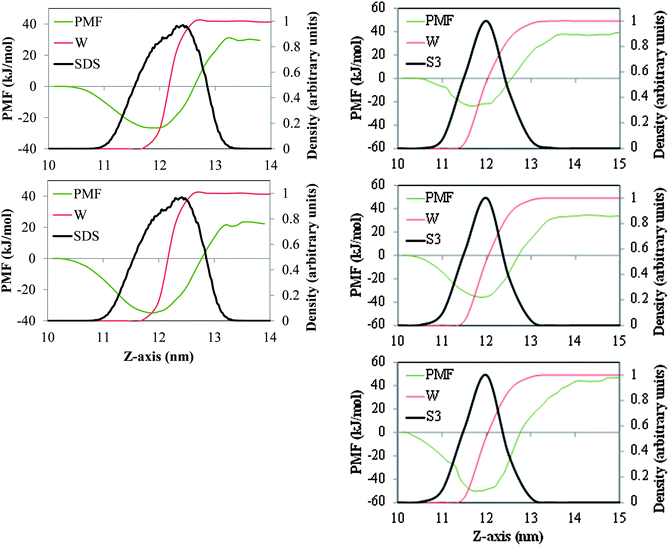
In Fig. 2 and 3 we show the PMF associated with moving one molecule of n-alkane (C15, C20 or C30, Fig. 2) or a single molecule of model dispersant (S1, S2 or S3, Fig. 3) between the bulk salt water and the gas phases, across air/salt water interfaces that are bare at 298 K. In all cases, we arbitrarily assumed that the PMF of a molecule of n-alkane or model dispersant in the gas phase is equal to zero. The PMF profiles of both the n-alkanes and model dispersants exhibit deep minima at the air/salt water interface, which suggests that a single molecule of n-alkane or model dispersant would have a thermodynamic preference to remain at the air/salt water interface, as compared to being in the salt water phase or in the gas phase. This is consistent with previous studies, where organic species such as PAHs24–26,30 and green leaf volatiles71,72 also showed a preference to stay at the air/water interface. The depth of the free energy minimum varies with the chain length of the n-alkanes (about −13 kJ mol−1, −15 kJ mol−1 and −24 kJ mol−1 for C15, C20 and C30, Fig. 2). The PMF sharply increases as the molecule of n-alkane is moved into the bulk of the salt water phase, displaying increasingly larger positive values of PMF as the chain length becomes longer. These observations reflect the fact that these n-alkanes are relatively large hydrophobic molecules with limited solubility in salt water and relatively low volatility. The PMF minima of the model dispersants at the air/salt water interface (Fig. 3) exhibit larger negative values (about −74 kJ mol−1 and −145 kJ mol−1 for S1 and S2) as compared to those of the n-alkanes (Fig. 2). Those values suggest that increases in the length of the polyethylene glycol chain (S1 and S2 have 5 and 10 repeating units, respectively; Fig. 1) makes a single molecule of model dispersant to be more likely to remain at the air/salt water interface. Increases in the length of the polyethylene glycol chain in a molecule of model dispersant also makes it to exhibit increasingly negative values of free energy when it is in the bulk of the salt water phase (around −15 kJ mol−1 for S1 and −101 kJ mol−1 for S2, Fig. 3). S2 and S3 have the same free energy in the bulk salt water, but S3 has an even deeper PMF minimum at the air/salt water interface (around −161 kJ mol−1). These observations suggest that the additional hydroxyl group in the end of S3 does not increase its solubility in the salt water, but increases its thermodynamic stability at the air/salt water interface. We note that the PMF results shown in Fig. 3 are for a single molecule of model dispersants. Our MD simulation results (see below) also suggest that SDS and the model dispersants spontaneously move to the air/salt water interfaces. However, we have not considered micellization processes involving oil, water and dispersants in this study, which has been predicted to be a key process for organics in sea spray aerosol generated in open ocean condition;73 micellization processes and redistribution of ions within sea spray aerosol particles were observed recently after heterogeneous reactions with nitric acid.74 In a follow-up study, we will consider micellization processes involving oil, salt water and both the ionic and nonionic compounds from the active components in Corexit 9500. We will aim at determining how micellization processes affect the possible ejection of oil organics and dispersants from the sea surface into the atmosphere, as well as to fundamentally understand the interfacial properties of these systems at the molecular level.In Fig. 4 we depict the PMF associated with moving a single molecule of the n-alkanes C15, C20 and C30 between the bulk salt water and gas phases and across air/salt water interfaces when a standard surfactant (SDS, 32 molecules per air/salt water interface) or one of our model dispersants (S3, 12 molecules per air/salt water interface) are present in the system. Although our three model dispersants exhibit qualitatively similar PMF profiles (Fig. 3), we have chosen S3 because the Tween and Span species (Fig. 1) also have capping OH groups. From Fig. 4, the minima in the PMF for C15 and C20 are about −26 kJ mol−1 and −35 kJ mol−1 at SDS-coated air/salt water interfaces, and about −27 kJ mol−1, −36 kJ mol−1 and −51.0 kJ mol−1 for C15, C20 and C30 in S3-coated interfaces. In these surfactant-coated air/salt water interfaces, the minima in the PMF is observed at a value of the z-coordinate that is within the layer of SDS or S3, indicating that the n-alkanes prefer to stay dissolved inside the surfactant layer, but closer to the air side of the interface. We also note that the minima observed for C15 and C20 in SDS- and S3-coated interfaces are very similar in magnitude. As mentioned above, the equivalent PMF minima at bare air/salt water interfaces (Fig. 2) are about −13 kJ mol−1, −15 kJ mol−1 and −24 kJ mol−1 for C15, C20 and C30. These results indicate that the presence of surfactants in the air/salt water interfaces makes the n-alkanes to have deeper PMF minima. Overall, the results shown in Fig. 2 and 4 suggest that, from the thermodynamic point of view, n-alkanes have a stronger tendency to remain at the air/salt water interface as their chain length increases. These observations are consistent with the previous simulation studies of Wick et al.25 and Vácha et al.,26 where larger PAHs showed a stronger preference to remain at the air/water interface. The presence of surfactants makes these n-alkanes exhibit even deeper free energy minima at the air/salt water interfaces. The concentration of surfactant at the interface also seems to be an important factor. We ran PMF calculations for the same n-alkanes for systems with 6 S3 molecules per air/water interface (half the concentration used for the systems in the right side of Fig. 4; results not shown for brevity), and the PMF minima observed at the interfaces were −25 kJ mol−1 (C15), −27 kJ mol−1 (C20) and −42 kJ mol−1 (C30). These values are in between those reported for the same n-alkanes in systems with bare interfaces (Fig. 2) and with 12 S3 molecules per interface (right side of Fig. 4); therefore the depth of the free energy minimum for n-alkanes at the air/salt water interface also seems to depend on the concentration of surfactant at this interface. The results described above are especially relevant to our working hypothesis stated in this study and in the accompanying experimental paper: the fact that n-alkanes have a strong thermodynamic preference to remain at the air/salt water interfaces, especially if these interfaces are coated with surfactants, makes these oil hydrocarbons and dispersants more likely to be ejected to the atmosphere by sea surface processes such as those associated with bubble bursting. These simulation results are consistent with the experimental findings reported in the accompanying paper.14 In particular, the deep free energy minima shown by n-alkanes at the air/salt water interface suggest that it is very likely that these oil hydrocarbons adsorb at the surface of bubbles or droplets and be ejected to the atmosphere. The fact that experiments indicate that more oil hydrocarbons are ejected when Corexit 9500A is present in the system is consistent with the deeper free energy minima observed for the n-alkanes at the air/salt water interface at increasing concentrations of SDS or model dispersant S3. Flow patterns in breaking bubbles also suggest that bursting bubbles can be an important mechanism to carry out material from the sea surface into the atmosphere.16
3.2. Structural properties of alkanes and surfactants at the air/salt water interface
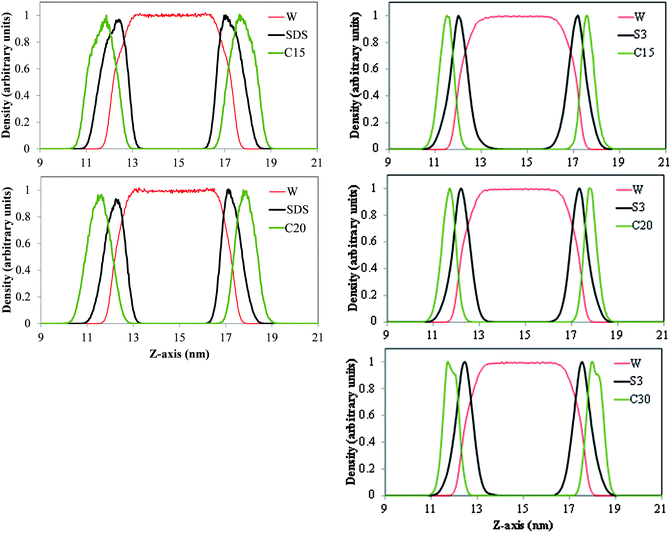
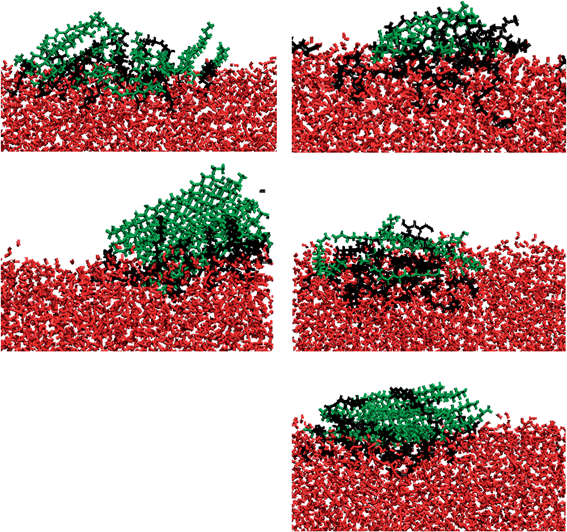
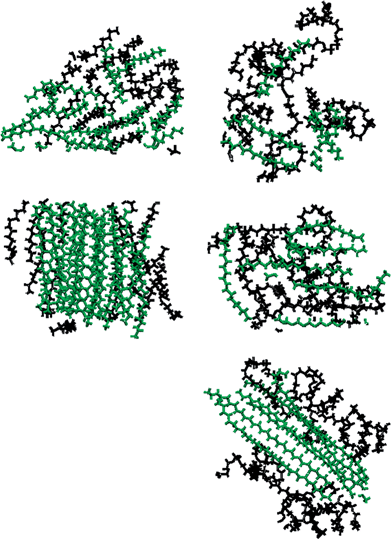
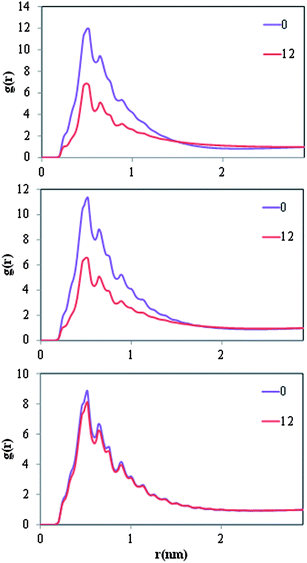
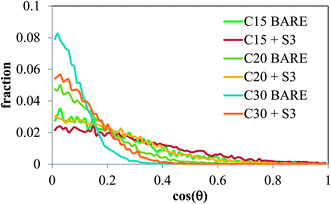
In Fig. 5 we present density profiles of n-alkanes (C15, C20 or C30), surfactant (SDS or model dispersant S3) and water molecules in air/salt water systems at 298 K, as obtained from MD simulations. Systems with SDS contain 16 molecules of C15 or C20, and up to 32 molecules of SDS per air/salt water interface. Similarly, systems with S3 contain 6 molecules of C15, C20 or C30, and up to 12 molecules of S3 per air/salt water interface. We also performed MD simulations with smaller amounts of SDS and S3; the results are similar to those shown in Fig. 5 and are not shown for brevity. Side and top views of representative simulation snapshots of systems with smaller concentrations of surfactants are presented in Fig. 6 and 7. These density profiles and the snapshots indicate again that all n-alkanes prefer to stay at the SDS- or S3-coated air/salt water interfaces. In the density profiles (Fig. 5), the peaks of the n-alkanes are closer to the air side of the interface, while those of SDS or S3 are closer to the water side of the interface. This behavior is expected, as the hydrophilic part of the surfactants would prefer to interact with water, and then make their hydrophobic tails to be farther away from water. The n-alkanes thus lie closer to the air side of the interface, as they prefer to interact with the hydrophobic tails of the dispersants. Significant overlap in the density profiles of the n-alkanes and the surfactants is observed in Fig. 5, in agreement with the PMF results shown in Fig. 4. Visual inspection of the side views of simulation snapshots of our systems (Fig. 6) also indicate that the n-alkanes tend to penetrate into the surfactant films at the air/salt water interface. In Fig. 8 we computed the C15–C15, C20–C20 and C30–C30 radial distribution functions g(r) for varying concentrations of S3 at the air/salt water interface, aiming at further investigating the structural properties of the n-alkanes at the bare and surfactant-coated air/salt water interfaces. Increasing concentrations of S3 lead to changes in the height of the peaks of g(r) for C15 and C20, but cause negligible variations in the g(r) of C30 (Fig. 8). We also obtained similar g(r) functions for the n-alkanes and the standard surfactant SDS; these results (not shown for brevity) indicate that increasing concentrations of SDS lead to reductions in the height of the peaks of g(r) for C15, but does not produce significant variations in those of C20. Varying concentrations of S3 or SDS does not lead to new peaks in the g(r) functions shown in Fig. 8. These results can be explained with the help of the top views of the simulation snapshots shown in Fig. 7. When no surfactant species are present, the n-alkanes C15, C20 and C30 form dense aggregates at the bare air/salt water interfaces (snapshots not shown). Increasing concentrations of SDS are able to partially disperse the aggregates of C15, but cannot break down the C20 aggregates (Fig. 7, left). In turn, increasing amounts of model dispersant S3 can dissolve the C15 and C20 aggregates, but does not seem able to completely break down the aggregates of C30. The mixtures of molecules in the Corexit dispersant used in the oil spill59–64 are larger and more complex than the SDS and the model S3 molecules used here, and thus exhibit a better performance in dispersing oil components (oil is a more complex system than the pure n-alkanes used in this study).The orientation of the molecules of C15, C20 and C30 at the air/salt water interface was monitored in our MD simulations. In Fig. 9 we show the distribution of the angle θ formed between the vector normal to the interface (z-direction) and the vector joining the carbon atoms at both ends of the molecule of n-alkane. Therefore a value of cos(θ) = 1 indicates that the carbon chain of the n-alkanes remains perpendicular with respect to the interface, and a value of cos(θ) = 0 indicates that the carbon chain lies flat at the air/salt water interface. From Fig. 9, it can be observed that the molecules of n-alkane mostly prefer to lie flat when the air/salt water interface is bare, although more variations in the orientation are observed for the shorter alkane C15. Addition of S3 at the interface makes the alkanes to adopt more tilted orientations with respect to the situation when no S3 is present at the interfaces; these effects are more pronounced in the heavier n-alkanes C20 and C30.
4. Concluding remarks
Classical molecular dynamics (MD) simulations and potential of mean force (PMF) calculations were performed to investigate the properties of the oil hydrocarbons n-pentadecane (C15), n-icosane (C20) and n-triacontane (C30), as well as the standard surfactant sodium dodecyl sulfate (SDS) and three model dispersant molecules representative of species found in Corexit 9500A, at air/salt water interfaces at 298 K. The work presented here and in the accompanying paper14 was motivated by the 2010 Deepwater Horizon (DWH) oil spill, and we specifically focus on the significant amount of oil that reached the sea surface despite the large amounts of Corexit dispersant used (which could have also reached the sea surface). Once the oil–gas–dispersant mixture reaches the surface of the sea, the volatile organic compounds (VOCs) can evaporate into the atmosphere and undergo chemical processing to form secondary organic aerosols (SOAs), but aerosolization (i.e., the non-evaporative ejection of oil spill material into the atmosphere) has been largely neglected until now. The working hypothesis of the study presented here and in the accompanying paper14 is that sea-surface phenomena such as the bursting of whitecap bubbles can eject intermediate- and semi-volatile organic compounds (IVOCs and SVOCs, namely hydrocarbons with 16 to 31 carbon atoms) from oil, from the sea surface into the atmosphere. Our PMF calculations show that, from the thermodynamic point of view, the n-alkanes C15, C20 and C30, as well as the three model dispersants S1, S2 and S3 (representative of species from Corexit 9500A, Fig. 1) have a strong preference to remain at the air/salt water interface, as indicated by the presence of deep free energy minima at these interfaces. The free energy minimum observed for the n-alkanes becomes deeper as their chain length increases, and as the concentration of SDS or model dispersant S3 at the interface increases. Classical MD simulations indicate that when no surfactant species are present, the n-alkanes tend to lie flat and form dense aggregates at the bare air/salt water interfaces. When surfactants (SDS or model S3) are added, the n-alkanes locate closer to the air side of the air/salt water interface, adopt more tilted orientations and penetrate into the surfactant films, which in turn are closer to the water side.The experimental results presented in the accompanying paper14 are consistent with the simulation trends presented here. The fact that the n-alkanes C15, C20 and C30 have a strong thermodynamic preference to remain at the air/salt water interfaces, especially if these interfaces are coated with surfactants, makes these oil hydrocarbons and dispersants more likely to be ejected to the atmosphere by sea surface processes such the mechanical disruption of wave crests and the bursting of whitecap bubbles. In particular, the deep free energy minima shown by n-alkanes at the air/salt water interface suggest that it is very likely that these oil hydrocarbons adsorb to the surface of bubbles and when these burst are transferred to the resulting droplets which are ejected into the atmosphere. Finally, the fact that experiments indicate that more oil hydrocarbons are ejected when Corexit 9500A is present in the system is consistent with the deeper free energy minima observed for the n-alkanes at the air/salt water interface at increasing concentrations of SDS or model dispersant S3. Our combined simulation and experimental results suggest that aerosolization via the bursting of whitecap bubbles on the sea surface can be an important transport mechanism for the ejection of oil spill organics into the atmosphere. Further research is needed to accurately estimate the amounts of DWH oil spill matter aerosolized by sea surface processes, as well as to determine its environmental consequences in the short and long term. From the molecular simulation point of view, in this study we only considered Na+ and Cl− as the only ions present in salt water. Consideration of other cations present in salt water, such as Mg2+ and Ca2+, will be important. Previous simulation studies suggest that the presence of Mg2+ can lead to specific ion interactions and ultimately affect the properties of Cl− in air/salt water interfaces.36,38 In addition, Mg2+ and Ca2+ can interact strongly with marine organics75 and thus might impact some of the properties calculated in this study.
Acknowledgements
We are grateful to Lawrence Pratt (Tulane) for helpful discussions related to the development of the model dispersant molecules used in this study. We also thank Ronjaniele Bruce and Elkhan Akhundov (Kenilworth Science and Technology Charter School, Baton Rouge, LA) for corroborating part of the calculations presented in this paper. This project was supported by a grant from the Gulf of Mexico Research Initiative (GoMRI), as part of the Consortium for the Molecular Engineering of Dispersant Systems (C-MEDS, http://dispersant.tulane.edu/). High performance computational resources for this research were provided by High Performance Computing at Louisiana State University (http://www.hpc.lsu.edu), and the Louisiana Optical Network Initiative (http://www.loni.org).References
- T. J. Crone and M. Tolstoy, Magnitude of the 2010 Gulf of Mexico oil leak, Science, 2010, 330, 634 CrossRef CAS PubMed.
- http://www.restorethegulf.gov/release/2011/04/10/one-year-later-press-pack .
- J. Lubchenco, M. K. McNutt, G. Dreyfus, S .A. Murawski, D. M. Kennedy, P. T. Anastas, S. Chu and T. Hunter, Science in support of the Deepwater Horizon response, Proc. Natl. Acad. Sci. U. S. A., 2012, 109, 20212–20221 CrossRef CAS PubMed.
- J. A. de Gouw, A. M. Middlebrook, C. Warneke, R. Ahmadov, E. L. Atlas, R. Bahreini, D. R. Blake, C. A. Brock, J. Brioude, D. W. Fahey, F. C. Fehsenfeld, J. S. Holloway, M. Le Henaff, R. A. Lueb, S. A. McKeen, J. F. Meagher, D. M. Murphy, C. Paris, D. D. Parrish, A. E. Perring, I. B. Pollack, A. R. Ravishankara, A. L. Robinson, T. B. Ryerson, J. P. Schwarz, J. R. Spackman, A. Srinivasan and L. A. Watts, Organic Aerosol Formation Downwind from the Deepwater Horizon Oil Spill, Science, 2011, 331, 1295–1299 CrossRef CAS PubMed.
- T. B. Ryerson, K. C. Aikin, W. M. Angevine, E. L. Atlas, D. R. Blake, C. A. Brock, F. C. Fehsenfeld, R. S. Gao, J. A. de Gouw, D. W. Fahey, J. S. Holloway, D. A. Lack, R. A. Lueb, S. Meinardi, A. M. Middlebrook, D. M. Murphy, J. A. Neuman, J. B. Nowak, D. D. Parrish, J. Peischl, A. E. Perring, I. B. Pollack, A. R. Ravishankara, J. M. Roberts, J. P. Schwarz, J. R. Spackman, H. Stark, C. Warneke and L. A. Watts, Atmospheric emissions from the Deepwater Horizon spill constrain air-water partitioning, hydrocarbon fate, and leak rate, Geophys. Res. Lett., 2011, 38, L07803 CrossRef.
- H. Coe, Aerosol Chemistry and the Deepwater Horizon Spill, Science, 2011, 331, 1273–1274 CrossRef CAS PubMed.
- C. A. Brock, D. M. Murphy, R. Bahreini and A. M. Middlebrook, Formation and growth of organic aerosols downwind of the Deepwater Horizon oil spill, Geophys. Res. Lett., 2011, 38, L17805 CrossRef.
- A. M. Middlebrook, D. M. Murphy, R. Ahmadov, E. L. Atlas, R. Bahreinim, D. R. Blake, J. Brioude, J. A. de Gouw, F. C. Fehsenfeld, G. J. Frost, J. S. Holloway, D. A. Lack, J. M. Langridge, R. A. Lueb, S. A. McKeen, J. F. Meagher, S. Meinardi, J. A. Neuman, J. B. Nowak, D. D. Parrish, J. Peischl, A. E. Perring, I. B. Pollack, J. M. Roberts, T. B. Ryerson, J. P. Schwarz, J. R. Spackman, C. Warneke and A. R. Ravishankara, Air quality implications of the Deepwater Horizon oil spill, Proc. Natl. Acad. Sci. U. S. A., 2012, 109, 20280–20285 CrossRef CAS PubMed.
- T. B. Ryerson, R. Camilli, J. D. Kessler, E. B. Kujawinski, C. M. Reddy, D. L. Valentine, E. Atlas, D. R. Blake, J. de Gouw, S. Meinardi, D. D. Parrish, J. Peischl, J. S. Seewald and C. Warneke, Chemical data quantify Deepwater Horizon hydrocarbon flow rate and environmental distribution, Proc. Natl. Acad. Sci. U. S. A., 2012, 109, 20246–20253 CrossRef CAS PubMed.
- B. Brunekreef and S. T. Holgate, Air pollution and health, The Lancet, 2002, 360, 1233–1242 CrossRef CAS.
- J. De Gouw and J. L. Jimenez, Organic Aerosols in the Earth's Atmosphere, Environ. Sci. Technol., 2009, 43, 7614–7618 CrossRef CAS PubMed.
- R. Volkamer, J. L. Jimenez, F. San Martini, K. Dzepina, Q. Zhang, D. Salcedo, L. T. Molina, D. R. Worsnop and M. J. Molina, Secondary organic aerosol formation from anthropogenic air pollution: rapid and higher than expected, Geophys. Res. Lett., 2006, 33, L17811 CrossRef.
- C. L. Heald, D. J. Jacob, R. J. Park, L. M. Russell, B. J. Huebert, J. H. Seinfeld, H. Liao and R. J. Weber, A large organic aerosol source in the free troposphere missing from current models, Geophys. Res. Lett., 2005, 32, L18809 CrossRef.
- F. S. Ehrenhauser, P. Avij, X. Shu, V. Dugas, I. Woodson, T. P. Liyana-Arachchi, Z. Zhang, F. R. Hung and K. T. Valsaraj, Bubble bursting as an aerosol generation mechanism during an oil spill in the deep-sea environment: laboratory experimental demonstration of the transport pathway, Environ. Sci.: Processes Impacts, 2013 10.1039/c3em00390f.
- E. L. Andreas, J. B. Edson, E. C. Monahan, M. P. Rouault and S. D. Smith, The spray contribution to net evaporation from the sea - a review of recent progress, Boundary Layer Meteorol., 1995, 72, 3–52 CrossRef.
- F. MacIntyre, Flow patterns in breaking bubbles, J. Geophys. Res., 1972, 77, 5211–5228 CrossRef CAS.
- M. C. Spillane, E. C. Monahan, P. A. Bowyer, D. M. Doyle and P. J. Stabano, Whitecaps and global fluxes, in Oceanic Whitecaps and Their Role in Air-Sea Exchange Processes, E. C. Monahan and G. M. Niocaill, ed. D. Reidel Publishing Company, Doordrecht, Netherlands, 1986, p. 294 Search PubMed.
- M. Fontana, An aspect of coastal pollution – The combined effect of detergent and oil at sea on sea spray composition, Water, Air, Soil Pollut., 1976, 5, 269–280 CAS.
- S. R. Massel, Ocean Waves Breaking and Marine Aerosol Fluxes, Springer Verlag, New York, NY, USA, 2007, vol. 38 Search PubMed.
- D. V. Spracklen, S. R. Arnold, J. Sciare, K. S. Carslaw and C. Pio, Globally significant oceanic source of organic carbon aerosol, Geophys. Res. Lett., 2008, 35(12), 5 CrossRef.
- N. M. Donahue, A. L. Robinson and S. N. Pandis, Atmospheric organic particulate matter: from smoke to secondary organic aerosol, Atmos. Environ., 2009, 43, 94–106 CrossRef CAS PubMed.
- J. L. Jimenez, M. R. Canagaratna, N. M. Donahue, A. S. H. Prevot, Q. Zhang, J. H. Kroll, P. F. DeCarlo, J. D. Allan, H. Coe, N. L. Ng, A. C. Aiken, K. S. Docherty, I. M. Ulbrich, A. P. Grieshop, A. L. Robinson, J. Duplissy, J. D. Smith, K. R. Wilson, V. A. Lanz, C. Hueglin, Y. L. Sun, J. Tian, A. Laaksonen, T. Raatikainen, J. Rautiainen, P. Vaattovaara, M. Ehn, M. Kulmala, J. M. Tomlinson, D. R. Collins, M. J. Cubison, E. J. Dunlea, J. A. Huffman, T. B. Onasch, M. R. Alfarra, P. I. Williams, K. Bower, Y. Kondo, J. Schneider, F. Drewnick, S. Borrmann, S. Weimer, K. Demerjian, D. Salcedo, L. Cottrell, R. Griffin, A. Takami, T. Miyoshi, S. Hatakeyama, A. Shimono, J. Y. Sun, Y. M. Zhang, K. Dzepina, J. R. Kimmel, D. Sueper, J. T. Jayne, S. C. Herndon, A. M. Trimborn, L. R. Williams, E. C. Wood, A. M. Middlebrook, C. E. Kolb, U. Baltensperger and D. R. Worsnop, Science, 2009, 326, 1525–1529 CrossRef CAS PubMed.
- J. Chen, F. Ehrenhauser, T. P. Liyana-Arachchi, F. R. Hung, M. J. Wornat and K. T. Valsaraj, Adsorption of gas-phase phenanthrene on atmospheric water and ice films, Polycyclic Aromat. Compd., 2011, 31, 201–226 CrossRef CAS.
- T. P. Liyana-Arachchi, K. T. Valsaraj and F. R. Hung, A Molecular Simulation Study of the Adsorption of Naphthalene and Ozone on Atmospheric Air/Ice Interfaces, J. Phys. Chem. A, 2011, 115, 9226–9236 CrossRef CAS PubMed.
- C. D. Wick, B. Chen and K. T. Valsaraj, Computational Investigation of the Influence of Surfactants on the Air–Water Interfacial Behavior of Polycylic Aromatic Hydrocarbons, J. Phys. Chem. C, 2010, 114, 14520–14527 CAS.
- R. Vácha, P. Jungwirth, J. Chen and K. T. Valsaraj, Adsorption of Polycyclic Aromatic Hydrocarbons at the Air–Water Interface: Molecular Dynamics Simulations and Experimental Atmospheric Observations, Phys. Chem. Chem. Phys., 2006, 8, 4461–4467 RSC.
- R. Vácha, P. Slavíček, M. Mucha, B. J. Finlayson-Pitts and P. Jungwirth, Adsorption of Atmospherically Relevant Gases at the Air/Water Interface: Free Energy Profiles of Aqueous Solvation of N2, O2, O3, OH, H2O, HO2, and H2O2, J. Phys. Chem. A, 2004, 108, 11573–11579 CrossRef.
- R. Vácha, L. Cwiklik, J. Řezáč, P. Hobza, P. Jungwirth, K. Valsaraj, S. Bahr and V. Kempter, Adsorption of Aromatic Hydrocarbons and Ozone at Environmental Aqueous Surfaces, J. Phys. Chem. A, 2008, 112, 4942–4950 CrossRef PubMed.
- T. P. Liyana-Arachchi, K. T. Valsaraj and F. R. Hung, Adsorption of Naphthalene and Ozone on Atmospheric Air/Ice Interfaces Coated with Surfactants: A Molecular Simulation Study, J. Phys. Chem. A, 2012, 116, 2519–2528 CrossRef CAS PubMed.
- T. P. Liyana-Arachchi, K. T. Valsaraj and F. R. Hung, Ice Growth from Supercooled Aqueous Solutions of Benzene, Naphthalene, and Phenanthrene, J. Phys. Chem. A, 2012, 116, 8539–8546 CrossRef CAS PubMed.
- T. P. Liyana-Arachchi, K. T. Valsaraj and F. R. Hung, Ice growth from supercooled aqueous solutions of reactive oxygen species, Theor. Chem. Acc., 2013, 132, 1309 CrossRef PubMed.
- D. J. Tobias and J. C. Hemminger, Getting Specific About Specific Ion Effects, Science, 2008, 319, 1197–1198 CrossRef CAS PubMed.
- P. Jungwirth and D. J. Tobias, Specific ion effects at the air/water interface, Chem. Rev., 2006, 106(4), 1259–1281 CrossRef CAS PubMed.
- B. J. Finlayson-Pitts, Reactions at surfaces in the atmosphere: integration of experiments and theory as necessary (but not necessarily sufficient) for predicting the physical chemistry of aerosols, Phys. Chem. Chem. Phys., 2009, 11(36), 7760–7779 RSC.
- M. J. Krisch, R. D'Auria, M. A. Brown, D. J. Tobias, J. C. Hemminger, M. Ammann, D. E. Starr and H. Bluhm, The effect of an organic surfactant on the liquid-vapor interface of an electrolyte solution, J. Phys. Chem. C, 2007, 111(36), 13497–13509 CAS.
- K. M. Callahan, N. N. Casillas-Ituarte, M. Xu, M. Roeselova, H. C. Allen and D. J. Tobias, Effect of Magnesium Cation on the Interfacial Properties of Aqueous Salt Solutions, J. Phys. Chem. A, 2010, 114(32), 8359–8368 CrossRef CAS PubMed.
- N. N. Casillas-Ituarte, K. M. Callahan, C. Y. Tang, X. K. Chen, M. Roeselova, D. J. Tobias and H. C. Allen, Surface organization of aqueous MgCl2 and application to atmospheric marinen aerosol chemistry, Proc. Natl. Acad. Sci. U. S. A., 2010, 107(15), 6616–6621 CrossRef PubMed.
- K. M. Callahan, N. N. Casillas-Ituarte, M. Roeselova, H. C. Allen and D. J. Tobias, Solvation of Magnesium Dication: Molecular Dynamics Simulation and Vibrational Spectroscopic Study of Magnesium Chloride in Aqueous Solutions, J. Phys. Chem. A, 2010, 114(15), 5141–5148 CrossRef CAS PubMed.
- P. Jungwirth and D. J. Tobias, Ions at the Air/Water Interface, J. Phys. Chem. B, 2002, 106, 6361–6373 CrossRef CAS.
- V. P. Sokhan and D. J. Tildesley, The free surface of water: molecular orientation, surface potential and nonlinear susceptibility, Mol. Phys., 1997, 92, 625–640 CrossRef CAS.
- M. A. Wilson, A. Pohorille and L. R. Pratt, Surface potential of the water liquid–vapor interface, J. Chem. Phys., 1988, 88, 3281–3285 CrossRef CAS.
- H. Wang, E. Borguet and K. B. Eisenthal, Polarity of Liquid Interfaces by Second Harmonic Generation Spectroscopy, J. Phys. Chem. A, 1997, 101, 713–718 CrossRef CAS.
- G. L. Richmond, Molecular bonding and interactions at aqueous surfaces as probed by vibrational sum frequency spectroscopy, Chem. Rev., 2002, 102, 2693–2724 CrossRef CAS PubMed.
- Q. Du, R. Superfine, E. Freysz and Y. R. Shen, Vibrational spectroscopy of water at the vapor/water interface, Phys. Rev. Lett., 1993, 70, 2313–2316 CrossRef CAS.
- L. F. Scatena and G. L. Richmond, Orientation, Hydrogen Bonding, and Penetration of Water at the Organic/Water Interface, J. Phys. Chem. B, 2001, 105, 11240–11250 CrossRef CAS.
- M. G. Brown, D. S. Walker, E. A. Raymond and G. L. Richmond, Vibrational Sum-Frequency Spectroscopy of Alkane/Water Interfaces: Experiment and Theoretical Simulation, J. Phys. Chem. B, 2002, 107, 237–244 CrossRef.
- C. L. Brooks and S. A. Patel, Revisiting the hexane–water interface via molecular dynamics simulations using nonadditive alkane–water potentials, J. Chem. Phys., 2006, 124, 204706–204714 CrossRef PubMed.
- D. Michael and I. Benjamin, Solute Orientational Dynamics and Surface Roughness of Water/Hydrocarbon Interfaces, J. Phys. Chem., 1995, 99, 1530–1536 CrossRef CAS.
- F. Bresme, E. Chacón, P. Tarazona and K. Tay, Intrinsic Structure of Hydrophobic Surfaces: The Oil-Water Interface, Phys. Rev. Lett., 2008, 101, 056102 CrossRef.
- J. P. Nicolas and N. R. de Souza, Molecular dynamics study of the n-hexane–water interface: towards a better understanding of the liquid–liquid interfacial broadening, J. Chem. Phys., 2004, 120, 2464–2469 CrossRef CAS PubMed.
- T.-M. Chang and L. X. Dang, Recent Advances in Molecular Simulations of Ion Solvation at Liquid Interfaces, Chem. Rev., 2005, 106, 1305–1322 CrossRef PubMed.
- C. Miqueu, J. M. Míguez, M. M. Piñeiro, T. Lafitte and B. Mendiboure, Simultaneous Application of the Gradient Theory and Monte Carlo Molecular Simulation for the Investigation of Methane/Water Interfacial Properties, J. Phys. Chem. B, 2011, 115, 9618–9625 CrossRef CAS PubMed.
- F. Biscay, A. Ghoufi and P. Malfreyt, Adsorption of n-alkane vapours at the water surface, Phys. Chem. Chem. Phys., 2011, 13, 11308–11316 RSC.
- C. D. Wick, T.-M. Chang, J. A. Slocum and O. T. Cummings, Computational Investigation of the n-Alkane/Water Interface with Many-Body Potentials: The Effect of Chain Length and Ion Distributions, J. Phys. Chem. C, 2011, 116, 783–790 Search PubMed.
- H. Freiser, Metal complexation at the liquid–liquid interface, Chem. Rev., 1988, 88, 611–616 CrossRef CAS.
- J. Conboy, J. Daschbach and G. Richmond, Studies of Alkane/Water Interfaces by Total Internal Reflection Second Harmonic Generation, J. Phys. Chem., 1994, 98, 9688–9692 CrossRef.
- D. S. Walker, M. G. Brown, C. L. McFearin and G. L. Richmond, Evidence for a Diffuse Interfacial Region at the Dichloroethane/Water Interface, J. Phys. Chem. B, 2004, 108, 2111–2114 CrossRef CAS.
- D. S. Walker, F. G. Moore and G. L. Richmond, Vibrational Sum Frequency Spectroscopy and Molecular Dynamics Simulation of the Carbon Tetrachloride−Water and 1,2-Dichloroethane−Water Interfaces, J. Phys. Chem. C, 2007, 111, 6103–6112 CAS.
- http://www.nalco.com/news-and-events/4297.htm .
- Patent number WO9834722 A1, K. W. Becker, G. P. Canevari, R. J. Fiocco and R. R. Lessard, 1998.
- Patent number WO0143860 A1, R. R. Lessard, K. W. Becker, G. P. Canevari, A. George-Ares and R. J. Fiocco, 2001.
- Patent number WO9413397 A1, K. W. Becker, G. P. Canevari, R. J. Fiocco and R. R. Lessard, 1994.
- Patent number EP0860203, K. W. Becker, G. P. Canevari, R. J. Fiocco and R. R. Lessard, 1998.
- Patent number US5728320 A, K. W. Becker, G. P. Canevari, R. J. Fiocco and R. R. Lessard, 1998.
- H. J. C. Berendsen, J. R. Grigera and T. P. Straatsma, The missing term in effective pair potentials, J. Phys. Chem., 1987, 91, 6269–6271 CrossRef CAS.
- R. Vácha, S. W. I. Siu, M. Petrov, R. A. Böckmann, J. Barucha-Kraszewska, P. Jurkiewicz, M. Hof, M. L. Berkowitz and P. Jungwirth, Effects of Alkali Cations and Halide Anions on the DOPC Lipid Membrane, J. Phys. Chem. A, 2009, 113, 7235–7243 CrossRef PubMed.
- P. Auffinger, T. E. Cheatham and A. C. Vaiana, Spontaneous formation of KCl aggregates in biomolecular simulations: a force field issue?, J. Chem. Theory Comput., 2007, 3, 1851–1859 CrossRef CAS.
- W. L. Jorgensen, D. S. Maxwell and J. Tirado-Rives, Development and Testing of the OPLS All-Atom Force Field on Conformational Energetics and Properties of Organic Liquids, J. Am. Chem. Soc., 1996, 118, 11225–11236 CrossRef CAS.
- B. E. Polat, S. Lin, J. D. Mendenhall, B. VanVeller, R. Langer and D. Blankschtein, Experimental and Molecular Dynamics Investigation into the Amphiphilic Nature of Sulforhodamine B, J. Phys. Chem. B, 2011, 115, 1394–1402 CrossRef CAS PubMed.
- B. Hess, C. Kutzner, D. van der Spoel and E. Lindahl, GROMACS 4: Algorithms for Highly Efficient, Load-Balanced, and Scalable Molecular Simulation, J. Chem. Theory Comput., 2008, 4, 435–447 CrossRef CAS.
- T. P. Liyana-Arachchi, C. Stevens, A. K. Hansel, F. S. Ehrenhauser, K. T. Valsaraj and F. R. Hung, Molecular simulations of green leaf volatiles and atmospheric oxidants on air/water interfaces, Phys. Chem. Chem. Phys., 2013, 15, 3583–3592 RSC.
- T. P. Liyana-Arachchi, A. K. Hansel, C. Stevens, F. S. Ehrenhauser, K. T. Valsaraj and F. R. Hung, Molecular Modeling of the Green Leaf Volatile Methyl Salicylate on Atmospheric Air/Water Interfaces, J. Phys. Chem. A, 2013, 117, 4436–4443 CrossRef CAS PubMed.
- G. B. Ellison, A. F. Tuck and V. Vaida, Atmospheric processing of organic aerosols, J. Geophys. Res.: Atmos., 1999, 104, 11633–11641 CrossRef CAS.
- A. P. Ault, T. L. Guasco, O. S. Ryder, J. Baltrusaitis, L. A. Cuadra-Rodriguez, D. B. Collins, M. J. Ruppel, T. H. Bertram, K. A. Prather and V. H. Grassian, Inside versus Outside: Ion Redistribution in Nitric Acid Reacted Sea Spray Aerosol Particles as Determined by Single Particle Analysis, J. Am. Chem. Soc., 2013, 135, 14528–14531 CrossRef CAS PubMed.
- P. Verdugo, Marine Microgels, Annu. Rev. Mar. Sci., 2012, 4, 375–400 CrossRef.
Footnotes |
| † Equal contribution. |
| ‡ Current address: Department of Chemistry, University of Minnesota, Minneapolis, MN 55455. |
| § Current address: Audubon Sugar Institute, LSU AgCenter, St. Gabriel, LA 70776. |
| This journal is © The Royal Society of Chemistry 2014 |

