Human hair-derived carbon flakes for electrochemical supercapacitors†
Wenjing
Qian
a,
Fengxia
Sun
b,
Yanhui
Xu
b,
Lihua
Qiu
a,
Changhai
Liu
c,
Suidong
Wang
c and
Feng
Yan
*a
aJiangsu Key Laboratory of Advanced Functional Polymer Design and Application, Department of Polymer Science and Engineering, College of Chemistry, Chemical Engineering and Materials Science, Soochow University, Suzhou, 215123, China. E-mail: fyan@suda.edu.cn; Fax: +86 512 65880089; Tel: +86 512 65880973
bInstitute of Chemical Power Sources, Soochow University, Suzhou, 215006, China
cJiangsu Key Laboratory of Carbon-Based Functional Materials & Devices, Institute of Functional Nano & Soft Materials (FUNSOM), Soochow University, Suzhou, 215123, China
First published on 12th November 2013
Abstract
Heteroatom doped porous carbon flakes were prepared via carbonization of Chinese human hair fibers and employed for high-performance supercapacitor electrode materials. The morphology and chemical composition of the resultant carbon materials were characterized by electron microscopy (EM), energy-dispersive X-ray spectroscopy (EDX), and X-ray photoelectron spectroscopy (XPS) measurements. Human hair carbonized at 800 °C exhibited high charge storage capacity with a specific capacitance of 340 F g−1 in 6 M KOH at a current density of 1 A g−1 and good stability over 20![[thin space (1/6-em)]](https://www.rsc.org/images/entities/char_2009.gif) 000 cycles. The specific capacitance of 126 F g−1 is also verified in a 1 M LiPF6 ethylene carbonate/diethyl carbonate (EC/DEC) organic electrolyte at a current density of 1 A g−1. The high supercapacitor performance could be due to the micro/mesoporosity combined with high effective surface area and heteroatom doping effects, combining double layer and Faradaic contributions.
000 cycles. The specific capacitance of 126 F g−1 is also verified in a 1 M LiPF6 ethylene carbonate/diethyl carbonate (EC/DEC) organic electrolyte at a current density of 1 A g−1. The high supercapacitor performance could be due to the micro/mesoporosity combined with high effective surface area and heteroatom doping effects, combining double layer and Faradaic contributions.
Broader contextThe development and utilization of biomass waste materials could contribute to explore novel materials for long-term sustainable energy storage, enhance cost competitiveness in energy supply markets, reduce environmental impacts and meet the urgent need for green and sustainable development strategies. Human hair, a readily available biological material generated in barbershops and hair salons, has become commercially available to crop producers in the past few years. In this paper, heteroatom doped porous carbon flakes were synthesized from Chinese human hair fibers through a green and low-cost chemical activation method and employed for high-performance supercapacitor electrode materials. A lamellar structure was retained during the carbonization process and laminar shaped carbon flakes were obtained. The as-prepared materials with rich heteroatoms show a high specific capacitance (340 F g−1) and an excellent long-term stability. It is demonstrated that utilization of inexpensive precursors and universal resource acquisition from nature is a good route for the preparation of high-performance supercapacitor electrode materials. |
Introduction
Supercapacitors are energy storage devices that accumulate energy in the form of electrical charge and bridge the gap between dielectric capacitors and batteries.1,2 They are attracting attention because of their high power density, short charging time, and long cycling life.2–6 Based on their charge-storage mechanism, supercapacitors can be classified as pseudocapacitors or electrical double-layer capacitors (EDLCs).7,8 Pseudocapacitors store electrical energy faradaically by electrosorption, reduction–oxidation reactions, and intercalation processes. However, practical applications of pseudocapacitors are limited due to low electrical conductivity and poor cycle stability.8,9The energy storage of EDLCs is generally based on the adsorption of electrolyte ions on large specific surface area conductive electrodes, in which the surface charge is separated at electrode/electrolyte interfaces. Therefore, high surface areas and pores adapted to electrolyte ion sizes are required for EDLCs.10 Recently, nanostructured carbon materials, including activated carbons,11 onion-like carbons,12 carbon nanotubes,13,14 and carbide-derived carbons,15,16 have shown high EDLC performances. The pore size distribution, surface area, surface functionality, and degree of crystallinity of porous carbons strongly affect the performance of such supercapacitors.10,17,18 In addition, incorporation of heteroatom species, such as nitrogen,19,20 sulfur,21 phosphorus22 and boron,23,24 can enhance the surface wettability of these carbon materials and induce pseudocapacitive behaviour. Such doping effects can significantly boost the performance of supercapacitors.25,26
Recently, the synthesis of carbon materials derived from organic waste for energy applications has been attracting much attention because of the increasing scarcity of fossil fuels. Waste materials including agricultural wastes, foods, and even animal products (such as animal bones and silks) have been utilized as carbon precursors.27–32 For instance, activated carbons prepared via carbonization of lotus pollens yielded a specific capacitance of 207 F g−1 and a gravimetric energy density of ∼88 W h kg−1.30 High-performance activated carbons derived from plant leaves exhibited a specific capacitance of 400 F g−1 and an energy density of 55 W h Kg−1 in 1 M H2SO4.29 Jin et al. recently reported the preparation of microporous carbons originating from regenerated silk proteins.28 These carbonized materials exhibited a specific capacitance of 264 F g−1 in aqueous electrolytes and a charge–discharge life of over 10![[thin space (1/6-em)]](https://www.rsc.org/images/entities/char_2009.gif) 000 cycles. Compared with traditional carbon sources such as coal, pitch and phenolic resins, the advantages of low cost and environmental friendliness promote the progress of biomass-based high performance supercapacitors in practical applications.
000 cycles. Compared with traditional carbon sources such as coal, pitch and phenolic resins, the advantages of low cost and environmental friendliness promote the progress of biomass-based high performance supercapacitors in practical applications.
Human hair, a readily available waste generated in barbershops and hair salons, has become commercially available to crop producers in the past few years. The composition of hair, on average, comprises about 51% carbon, 17% nitrogen, 21% oxygen, 6% hydrogen, 5% sulfur, and trace amounts of iron, magnesium, arsenic, chromium and various minerals.33–35 In this study, we demonstrate the synthesis of heteroatom-doped carbon materials via carbonization of human hair. Porous carbon materials with high surface area induced by KOH activation during carbonization were generated. These materials exhibit a capacitance of 340 F g−1 at a current density of 1 A g−1 in 6 M KOH, and thus possess potential advantages for applications as supercapacitor electrodes with high energy and power density.
Experimental section
Materials
The hair fibers were collected from a healthy Chinese volunteer in Soochow University. Potassium hydroxide, hydrochloric acid, isopropanol, and N-methyl-2-pyrrolidone (NMP) were purchased from Shanghai Chemical Reagents Co., Ltd. Polytetrafluoroethylene (PTFE) solution and polyvinylidene fluoride (PVDF) were purchased from Aladdin Chemistry Co., Ltd. LiPF6 (1 M) in ethylene carbonate/diethyl carbonate (EC/DEC, 1![[thin space (1/6-em)]](https://www.rsc.org/images/entities/char_2009.gif) :
:![[thin space (1/6-em)]](https://www.rsc.org/images/entities/char_2009.gif) 1 by volume) was purchased from Zhangjiagang Guotai-huarong New Chemical Materials Co., Ltd. Acetylene black, super-p, nickel foam and aluminium foil were used as purchased. Distilled deionized water was used throughout the experiments.
1 by volume) was purchased from Zhangjiagang Guotai-huarong New Chemical Materials Co., Ltd. Acetylene black, super-p, nickel foam and aluminium foil were used as purchased. Distilled deionized water was used throughout the experiments.
Preparation of human hair derived micro/mesoporous carbon (HMC)
The hair fibers were thoroughly washed with isopropanol and dried at 80 °C. The cleaned fibers were cut to fine debris (∼5 mm long) and pre-carbonized at 300 °C for 1.5 h under an argon atmosphere. The pre-carbonized materials were then mixed with KOH (weightKOH/weightcarbon = 2), and pyrolyzed in a ceramic crucible at 700, 800, or 900 °C for 2 h under an argon atmosphere, respectively. A heating rate of 5 °C min−1 was applied for the carbonization. The resulting dark solid was ground to powder, washed with 1 M HCl solution, and then thoroughly washed with distilled water. The residue was collected and dried at 80 °C in a vacuum. The resultant human hair derived micro/mesoporous carbon (HMC) materials are denoted as HMC-T, where T indicates the carbonization temperature.Electrochemical performance of HMCs in 6 M KOH
All electrochemical characterizations were carried out on a CHI660c electrochemical workstation (Shanghai Chenhua Instruments Co.) at room temperature. To prepare the testing electrode, a viscous slurry containing 80 wt% HMC material, 10 wt% carbon black, and 10 wt% PTFE was mixed and pressed onto a nickel foam current collector at 15 MPa. The as-formed electrodes (with a thickness of approximately 100 μm and an area of 1.0 cm2) were then dried at 100 °C in a vacuum oven. The prepared HMC loaded on the electrode is 4.0 mg for each electrode. In a three-electrode cell, the above loaded nickel foam, a Pt wire and a Hg/HgO were used as the working, counter and reference electrodes, respectively. Cyclic voltammetry curves were obtained in the potential range of −1.0–0 V vs. Hg/HgO by varying the scan rate from 5 to 100 mV s−1. Electrochemical impedance spectroscopy (EIS) was measured in a frequency range of 10 kHz to 10 mHz at open circuit voltage with an alternate current amplitude of 5 mV. Charge–discharge measurements were done galvanostatically at 0.3–80 A g−1 over a voltage range of −1.0–0 V vs. Hg/HgO. For quantitative considerations, the specific capacitance was calculated from the galvanostatic charge–discharge values by using the following equation: | (1) |
Electrochemical performance in 1 M LiPF6 in EC/DEC
To construct symmetrical HMC-800 based supercapacitor devices, the electrode composite materials were prepared by mixing 80 wt% HMC-800, 10 wt% super-p (conducting carbon), and 10 wt% PVDF binder, coating this mixture on aluminium foil, and drying. The thickness of the loading composite on each electrode was controlled to be ∼100 μm and the HMC material is 4.0 mg for the devices. The two symmetrical electrodes were separated using a celgard 2400 membrane soaked with electrolytes (1 M LiPF6 EC/DEC) in a CR2032 stainless steel coin cell. The cyclic voltammetry and galvanostatic charge–discharge tests for these devices were performed in the potential range of 0.01–3 V. Electrochemical impedance spectroscopy (EIS) was also performed in the frequency range of 10 kHz to 10 mHz at the open circuit voltage with an alternate current amplitude of 5 mV. The gravimetric capacitance for the single electrode was calculated according to: | (2) |
 | (3) |
 | (4) |
Characterization
The prepared carbon materials were examined using a Tecnai G220 transmission electron microscope (TEM) with a CCD imaging system with an acceleration voltage of 160 kV. Energy-dispersive X-ray (EDX) fluorescence measurements were performed with a spectrometer attached to a Hitachi Model S-4700 field-emission scanning electron microscope (SEM). X-ray powder diffraction was conducted using a Philips X'Pert PRO diffractometer with nickel-filtered Cu Kα radiation. Raman spectra were obtained with a LabRAM HR800 from JY Horiba. Nitrogen sorption analysis was carried out using an ASAP 2020 accelerated surface area and porosimetry instrument (Micromeritics), equipped with an automated surface area, at 77 K using Brunauer–Emmett–Teller (BET) calculations for the surface area. The pore size distribution plots were recorded from the desorption branch of the isotherms based on the Barrett–Joyner–Halenda (BJH) model. X-ray photoelectron spectra (XPS) were obtained using an XPS-7000 spectrometer (Rigaku) with an excitation source of Mg Kα radiation.Results and discussion
Scheme 1 illustrates a schematic diagram for the preparation of human hair derived micro/mesoporous carbon (HMC) materials. The cleaned and dried hair fibers were cut into a fine debris and pre-carbonized at 300 °C for 90 min. This pretreated carbon material was then mixed with KOH (weightKOH![[thin space (1/6-em)]](https://www.rsc.org/images/entities/char_2009.gif) :
:![[thin space (1/6-em)]](https://www.rsc.org/images/entities/char_2009.gif) weightcarbon = 2
weightcarbon = 2![[thin space (1/6-em)]](https://www.rsc.org/images/entities/char_2009.gif) :
:![[thin space (1/6-em)]](https://www.rsc.org/images/entities/char_2009.gif) 1) and further carbonized at 700, 800, and 900 °C, respectively.
1) and further carbonized at 700, 800, and 900 °C, respectively.
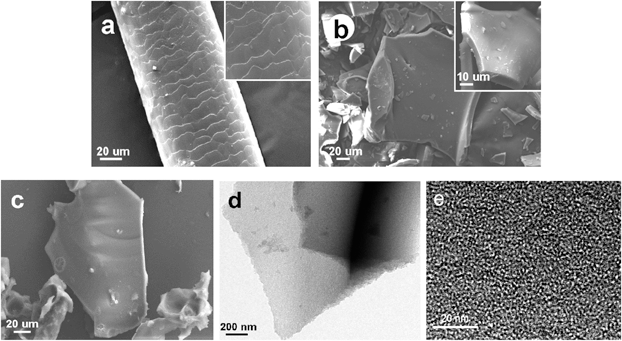
It is well known that the main structural components of hair fibers are cuticle and cortex. The outermost part of the hair shaft is the hair cuticle, which mainly consists of flat overlapping cells (scales) that are attached to the fiber.33–35Fig. 1a shows a scanning electron microscopy (SEM) micrograph of a hair fiber, the scaled lamellar structure of hair is evident. It is interesting that such a lamellar structure was retained during the carbonization process, and laminar shaped carbon flakes were obtained (Fig. 1b and c). These results might be due to the weak interaction between the flat overlapping cells (scales), which thus can be easily broken apart to form lamellar carbon flakes. These carbon flakes were further characterized by transmission electron microscopy (TEM) (Fig. 1d and e), and meso/micropores and channels can be clearly seen. These mesopores and interconnections of the carbon materials provided a favorable path for transportation and penetration of electrolyte ions, which were important for fast ion transfer.27,36,37 Therefore, these porous carbon materials derived from human hair could be promising electrode materials for supercapacitors.
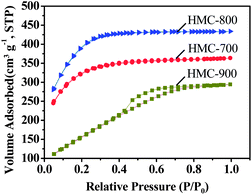
Fig. 2 shows nitrogen sorption isotherms for our HMCs, and the porous properties of the resultant carbon materials are summarized in Table 1. It can be seen that the porosity of the resultant carbon materials was significantly influenced by the activation temperatures. Both HMC-700 and HMC-800 exhibited a type-I sorption isotherm with saturation at a relative pressure (P/P0) of ca. 0.2, which is a typical result for microporous materials. However, the isotherms of HMC-900 changed to that of a type-IV with an increasing slope at higher relative pressures; this effect is commonly related to capillary condensation in mesopores. A hysteresis loop extending from P/P0 = 0.4 to 0.8 was observed for HMC-900 samples, indicating the coexistence of both micropore and mesopore structures formed in these materials. As the activation temperature increases from 700 to 800 °C, both the surface area and pore volume increase. The specific surface areas of HMCs activated at 700 and 800 °C were determined to be 1054 and 1306 m2 g−1, while the pore volumes are 0.38 and 0.90 cm3 g−1, respectively. However, both the surface area and pore volume of HMC-900 are dramatically lower, 669 m2 g−1 and 0.45 cm3 g−1, respectively, probably due to the collapse of pores and enhanced orientation during the carbonization process.38 Fig. S1† depicts pore size distributions determined by N2 adsorption for these HMCs (see ESI†). The size of nanopores formed in HMC-700 and HMC-800 is less than 3 nm, while the pore size of less than 8 nm was found for HMC-900. This result is likely due to pore collapse during the heating at 900 °C.39 The higher surface area and narrower pore size distribution of HMC-800 are advantageous in charge storage.
| Samples | S BET [m2 g−1] | S micro [m2 g−1] | S meso [m2 g−1] | S Langmuir [m2 g−1] | V pore [cm3 g−1] | V micro [cm3 g−1] | V meso [cm3 g−1] | D aver [nm] |
|---|---|---|---|---|---|---|---|---|
| HMC-700 | 1054 | 284 | 771 | 1619 | 0.38 | 0.08 | 0.30 | 2.13 |
| HMC-800 | 1306 | 103 | 1203 | 2062 | 0.90 | 0.28 | 0.62 | 2.05 |
| HMC-900 | 669 | 38.2 | 631 | 939 | 0.45 | 0.06 | 0.39 | 3.13 |
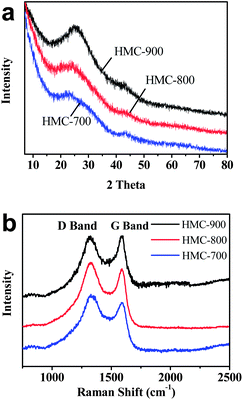
Fig. 3a shows powder X-ray diffraction (XRD) in the wide-angle region of these HMC materials. It can be clearly seen that all of these materials possess a well-developed graphitic stacking peak at 22.3°, and a weak peak at 43.8° due to the formation of a higher degree of intralayer condensation, which should greatly improve the electrical conductivity.40 The intensity increase at the low-angle scattering peak indicates a high density of micropores. The Raman spectroscopy results are illustrated in Fig. 3b. The peaks located at around 1320 and 1590 cm−1 are assigned to the characteristic D (defects and disorder) and G (graphitic) bands of carbon materials, respectively. The D/G ratio of band intensities indicates the degree of structural order with respect to a perfect graphitic structure. Here, the D/G intensity ratios of HMC-700, HMC-800, and HMC-900 were determined to be 1.46, 1.23, and 1.1, respectively. Higher carbonization temperature leads to a higher structural alignment. The relatively lower D/G intensity ratio for HMC-900 might indicate a reduced amount of heteroatom doping (such as N, O, and S). The conductivities of HMC-700, HMC-800 and HMC-900 are determined to be 44.8, 47.3, and 63.0 S m−1, respectively. The highest conductivity of HMC-900 further confirms the high degree of intralayer condensation of carbon materials which will greatly improve the electrical conductivity of carbon materials.
Table 2 summarizes the chemical compositions for these HMC materials characterized by energy-dispersive X-ray (EDX) fluorescence and X-ray photoelectron spectroscopy (XPS) (see Fig. S2, ESI†), respectively. The chemical compositions of these HMC materials were found to consist of C, N, O and S. The contents of these heteroatoms (N, O, and S) gradually decrease with increasing carbonization temperature. Fig. S2† shows high-resolution C1s, N1s, O1s, and S2p XPS spectra. A narrow trend is observed with increasing temperature in the XPS C 1s spectra of the HMCs, indicating an enhanced degree of graphitic order.38 In the N1s spectra, the binding energies centered at 398.0 eV and 400.1 eV belong to pyridinic and pyrrolic nitrogen species are assumed to be the main configurations contributing to the pseudocapacitance.41 Meanwhile, the peak located at 400.8 eV is assigned to quaternary nitrogen which could enhance the electrical conductivity of carbon materials.41 The peak fitting analysis reveals that the vast majority of quaternary nitrogen atoms are embodied in HMC-900. Two distinct peaks around 531.5 and 533.5 eV in the O1s spectra reveal the presence of oxygen atoms in carbonyl groups and various other oxygen groups, which participate in Faradaic reactions to give improved pseudocapacitance and enhance wettability of carbon materials.41,42 The remnant sulfur appears at approximately 163.8 eV (C–S–S–C–) and 165.2 eV (C![[double bond, length as m-dash]](https://www.rsc.org/images/entities/char_e001.gif) S) may contribute to the pseudocapacitance.43
S) may contribute to the pseudocapacitance.43
| EDX (wt%) | XPS (atom%) | |||||||
|---|---|---|---|---|---|---|---|---|
| C | N | O | S | C | N | O | S | |
| HMC-700 | 82.90 | 5.62 | 8.99 | 2.49 | 85.20 | 5.12 | 7.45 | 2.23 |
| HMC-800 | 88.20 | 4.74 | 5.53 | 1.54 | 88.72 | 4.38 | 5.39 | 1.51 |
| HMC-900 | 91.32 | 2.33 | 4.98 | 1.37 | 92.30 | 1.96 | 4.28 | 1.46 |
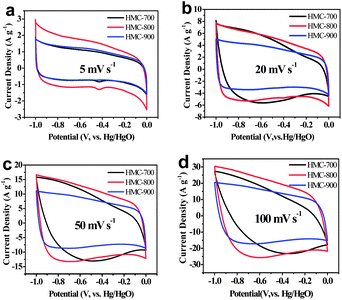
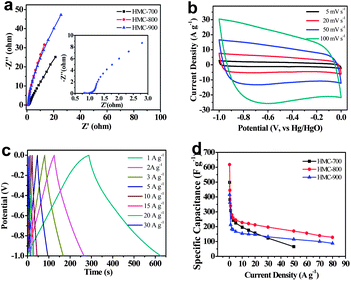
The performance of these HMC materials as supercapacitor electrodes was characterized by cyclic voltammetry (CV) measurements in KOH aqueous solution at room temperature (Fig. 4). All the samples exhibit rectangular shaped voltammetry scans (typical capacitive behaviour) from −1.0 to 0 V at various scan rates, indicating an ideal double-layer capacitor nature of the charge–discharge process. It should be noted that some Faradaic humps were observed at ∼0.45 V in these CV curves at low scan rate (Fig. 4a), probably due to redox reactions of the doped heteroatoms such as pyridinic and pyrrolic nitrogen species.28 Compared with HMC-700, HMC-900 samples maintain the appearance of roughly rectangular-like shapes at high scan rates (Fig. 4 and S3a and b in ESI†). This might be due to bigger size pores in HMC-900 that promote ion diffusion. Among the materials studied, HMC-800 exhibited the highest current density (Fig. 4), indicating that HMC-800 is the most promising material for supercapacitor electrodes. The lower effective specific surface area and pore volume of HMC-700 contribute to an inferior cyclic voltammetry character. The HMC-900 also has lower specific surface area and fewer heteroatoms per unit mass to promote conductivity.
Fig. 5a shows a Nyquist plot of HMC-T carbon electrode materials in 6 M KOH in a frequency range from 10 kHz to 10 mHz. The equivalent series resistances are 1.1 Ω, 0.92 Ω and 0.90 Ω for HMC-700, HMC-800, and HMC-900, respectively, showing good conductivity in aqueous electrolytes. An almost vertical line was obtained that represents the dominance of double-layer charge-storage at low frequencies. The inset in Fig. 5a shows a magnified high frequency region for HMC-800. Diffusion control dominates when a phase shift of 45° is the typical feature for porous carbon electrodes with respect to Warburg impedance in the middle frequency region.44,45 Pivotal parameters such as porosity, thickness, wettability for the diffusion of ions into the bulk through the porous network of the electrode act on this phase. The short lengths of these slope regions of all the HMCs indicate the low resistance encountered by the ion transportation in the aqueous electrolyte. Fig. 5b shows that HMC-800 still exhibited typical capacitive behaviour with rectangular shaped voltammetry characteristics even at a high potential scan rate of 100 mV s−1.
Cyclic voltammetry and electrochemical impedance spectra of an HMC-800 based symmetrical 2-electrode system in the 6 M KOH electrolyte were studied. The cyclic voltammetry of HMC-800 shows a rectangular shape, implying quick dynamics and good charge propagation (Fig. S4a†). The vertical line in the Nyquist plot (Fig. S4b†) represents the good EDLC behavior. Fig. S4c† shows the Bode plots of HMC-800 measured from EIS data. At high frequency region, the phase angle is almost zero. In the middle region, a constant increase of the phase angle with decreasing frequency is observed. The phase angle shifts to negative values reaching −83.8° in the low frequency limitation region which approaches that of an ideal capacitor (−90°).
In order to further investigate the performance of HMCs, galvanostatic charge–discharge experiments were done at various current densities in a three-electrode configuration (Fig. 5c and S3c and d in ESI†). The inflections to the extent at ∼0.4 V of HMC-700 and HMC-800 imply the impact of pseudocapacitance due to the effect of doped heteroatoms.46 However, the HMC-900 samples display the quasi-linear appearance indicating the enhancement of graphitization and increment of conductivity.38 The specific capacitance values are calculated at different current densities ranged from 0.3 to 80 A g−1. At a current density of 0.5 A g−1, the specific capacitances of 382, 445 and 362 F g−1 were obtained for HMC-700, HMC-800, and HMC-900, respectively (Fig. 5d). At higher current density the specific capacitance slightly decreased due to an inadequate time for electrolyte diffusion into the inner pores. However, at a current density of 10 A g−1, HMC-700 and HMC-800 still maintained specific capacitances of 196 F g−1 and 227 F g−1, respectively (Fig. 5d). Even at 80 A g−1, a capacitance of 128 F g−1 was retained for HMC-800. This result might be due to the doping of heteroatoms which increased the hydrophilicity and polarity of carbon materials and thus induced pseudocapacitive behaviour. In addition, the mesopores formed in the carbon materials are vital for furnishing a smooth and convenient ion-transfer pathway and thus enhanced electrolyte accessibility to the microporous area.
Furthermore, the long-term cyclic stability of the HMC-800 electrode was investigated using galvanostatic charge–discharge measurement at a current density of 2 A g−1 within a potential window of −1.0–0 V vs. Hg/HgO. Fig. 6 shows only a slight variation of specific capacitance with cycle number. It is interesting that the specific capacitance increases after slightly decreasing during this cyclic charge–discharge process. This variation may be due to the effects from doped heteroatoms or in situ activation of the electrode to expose additional surface area.47,48 The long term performance maintains at about 98% of the initial specific capacitance and amounts to about 280 F g−1 over 20![[thin space (1/6-em)]](https://www.rsc.org/images/entities/char_2009.gif) 000 cycles, which shows that this HMC-800 electrode displays excellent stability.
000 cycles, which shows that this HMC-800 electrode displays excellent stability.
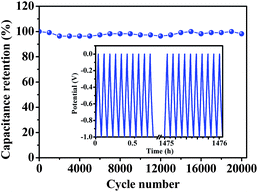 | ||
Fig. 6 Cyclic stability of HMC-800 at a charge–discharge current density of 2 A g−1 for 20![[thin space (1/6-em)]](https://www.rsc.org/images/entities/char_2009.gif) 000 cycles in the 6 M KOH electrolyte. Inset: galvanostatic charge–discharge cycles. 000 cycles in the 6 M KOH electrolyte. Inset: galvanostatic charge–discharge cycles. | ||
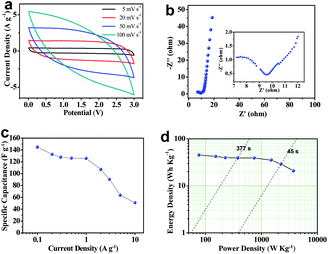
The electrochemical performance of HMC-800 based supercapacitors was evaluated in a fully assembled two-electrode cell with the 1 M LiPF6 EC/DEC electrolyte. At a relatively low scan rate, the cyclic voltammogram curves are nearly rectangular-like (Fig. 7a). However, the curves were deformed with an increase of the scan rate mainly due to the slow charge–discharge kinetics of HMC-800 materials in the organic electrolyte; that is, ion diffusion was unable to adequately access the surface of HMC-800 in such short time at high scan rates.49,50 A Nyquist plot for this supercapacitor is similar to that obtained in the aqueous electrolyte (Fig. 7b). Nevertheless, the magnified high frequency region shows major differences. The bigger semicircle indicates a lower ionic conductivity of the organic electrolyte, and the relatively longer length of 45° phase shift segment implies a higher Warburg impedance.51 The poor compatibility between active materials and the organic electrolyte prevented the electrolyte from adequately accessing the external surface and inner volume of carbon materials, which resulted in limited outer-surface accessibility. The shift of the Nyquist plot towards the real axis is due to a 9.5 Ω equivalent series resistance. In addition, Bode plots (Fig. S5†) show that the performance in the organic electrolyte is poorer than that in the aqueous electrolyte. However, the phase angle at −71° in the lower frequency limitation region indicates good capacitive behavior. The specific capacitance of 107 F g−1 at a current density of 2 A g−1 is higher than that of the carbons derived from leaves (88 F g−1).29 Fig. S6† shows the galvanostatic charge–discharge profiles at a current density of 1 A g−1. The symmetrical and stable capacitance behavior was observed. Fig. 7c shows the specific capacitances at different current densities. It can be seen that specific capacitance decreased with the current density increase. The Ragone plot for the symmetrical HMC-800 based device (Fig. 7d) shows that the specific energy density is about 45.33 W h kg−1 at a current density of 0.1 A g−1 which is superior to the commercial devices (<3 W h kg−1).52 The power density and energy density values were found to be 2243 W kg−1 and 29 W h kg−1, respectively, at a current drain time of 45 s. These results indicate that heteroatom doped carbon materials could reach high capacitance in aqueous solution, however, the contribution in the organic electrolyte remains to be further improved.
Conclusions
In summary, heteroatom doped porous carbon flakes were synthesized via carbonization of human hair. These materials carbonized at 800 °C exhibit high charge storage capacity with a specific capacitance of 340 F g−1 in 6 M KOH at a current density of 1 A g−1 and good stability over 20![[thin space (1/6-em)]](https://www.rsc.org/images/entities/char_2009.gif) 000 cycles. The specific capacitance of 126 F g−1 is also verified in the 1 M LiPF6 EC/DEC electrolyte at a current density of 1 A g−1. This high supercapacitor performance can be attributed to micro/mesoporosity combined with high effective surface area and heteroatom doping effects, combining double layer and Faradaic contributions.
000 cycles. The specific capacitance of 126 F g−1 is also verified in the 1 M LiPF6 EC/DEC electrolyte at a current density of 1 A g−1. This high supercapacitor performance can be attributed to micro/mesoporosity combined with high effective surface area and heteroatom doping effects, combining double layer and Faradaic contributions.
Acknowledgements
This work was supported by the Natural Science Foundation of China (no. 21274101), the National Basic Research Program of China (973 Program) (no. 2012CB825800), The Natural Science Foundation of Jiangsu Province (BK2011274), the Research Fund for the Doctoral Program of Higher Education (20103201110003) and the Project Funded by the Priority Academic Program Development of Jiangsu Higher Education Institutions.Notes and references
- Y.-B. He, G.-R. Li, Z.-L. Wang, C.-Y. Su and Y.-X. Tong, Energy Environ. Sci., 2011, 4, 1288–1292 CAS.
- Z. Niu, H. Dong, B. Zhu, J. Li, H. H. Hng, W. Zhou, X. Chen and S. Xie, Adv. Mater., 2013, 25, 1058–1064 CrossRef CAS PubMed.
- A. Ghosh and Y. H. Lee, ChemSusChem, 2012, 5, 480–499 CrossRef CAS PubMed.
- C. Merlet, B. Rotenberg, P. A. Madden, P. L. Taberna, P. Simon, Y. Gogotsi and M. Salanne, Nat. Mater., 2012, 11, 306–310 CrossRef CAS PubMed.
- Y. Zhu, S. Murali, M. D. Stoller, K. J. Ganesh, W. Cai, P. J. Ferreira, A. Pirkle, R. M. Wallace, K. A. Cychosz, M. Thommes, D. Su, E. A. Stach and R. S. Ruoff, Science, 2011, 332, 1537–1541 CrossRef CAS PubMed.
- C. Guan, X. Xia, N. Meng, Z. Zeng, X. Cao, C. Soci, H. Zhang and H. J. Fan, Energy Environ. Sci., 2012, 5, 9085–9090 CAS.
- P. Simon and Y. Gogotsi, Nat. Mater., 2008, 7, 845–854 CrossRef CAS PubMed.
- G. Wang, L. Zhang and J. Zhang, Chem. Soc. Rev., 2012, 41, 797–828 RSC.
- X. Dong, X. Wang, L. Wang, H. Song, X. Li, L. Wang, M. B. Chan-Park, C. M. Li and P. Chen, Carbon, 2012, 50, 4865–4870 CrossRef CAS PubMed.
- S. Kondrat, C. R. Perez, V. Presser, Y. Gogotsi and A. A. Kornyshev, Energy Environ. Sci., 2012, 5, 6474–6479 CAS.
- Y. Zhai, Y. Dou, D. Zhao, P. F. Fulvio, R. T. Mayes and S. Dai, Adv. Mater., 2011, 23, 4828–4850 CrossRef CAS PubMed.
- D. Pech, M. Brunet, H. Durou, P. Huang, V. Mochalin, Y. Gogotsi, P.-L. Taberna and P. Simon, Nat. Nanotechnol., 2010, 5, 651–654 CrossRef CAS PubMed.
- Z. Niu, W. Zhou, J. Chen, G. Feng, H. Li, W. Ma, J. Li, H. Dong, Y. Ren, D. Zhao and S. Xie, Energy Environ. Sci., 2011, 4, 1440–1446 CAS.
- G. Lota, K. Fic and E. Frackowiak, Energy Environ. Sci., 2011, 4, 1592–1605 CAS.
- J. Chmiola, C. Largeot, P.-L. Taberna, P. Simon and Y. Gogotsi, Science, 2010, 328, 480–483 CrossRef CAS PubMed.
- T. Kim, G. Jung, S. Yoo, K. S. Suh and R. S. Ruoff, ACS Nano, 2013, 7, 6899–6905 CrossRef CAS PubMed.
- W. Huang, H. Zhang, Y. Huang, W. Wang and S. Wei, Carbon, 2011, 49, 838–843 CrossRef CAS PubMed.
- L. Hu and Y. Cui, Energy Environ. Sci., 2012, 5, 6423–6435 Search PubMed.
- S. Shanmugam and T. Osaka, Chem. Commun., 2011, 47, 4463–4465 RSC.
- B. Qiu, C. Pan, W. Qian, Y. Peng, L. Qiu and F. Yan, J. Mater. Chem. A, 2013, 1, 6373–6378 CAS.
- J. P. Paraknowitsch, A. Thomas and J. Schmidt, Chem. Commun., 2011, 47, 8283–8285 RSC.
- J. P. Paraknowitsch, Y. Zhang, B. Wienert and A. Thomas, Chem. Commun., 2013, 49, 1208–1210 RSC.
- T.-P. Fellinger, D. S. Su, M. Engenhorst, D. Gautam, R. Schloegl and M. Antonietti, J. Mater. Chem., 2012, 22, 23996–24005 RSC.
- J. Han, L. L. Zhang, S. Lee, J. Oh, K.-S. Lee, J. R. Potts, J. Ji, X. Zhao, R. S. Ruoff and S. Park, ACS Nano, 2012, 7, 19–26 CrossRef PubMed.
- D. Hulicova-Jurcakova, A. M. Puziy, O. I. Poddubnaya, F. Suarez-Garcia, J. M. D. Tascon and G. Q. Lu, J. Am. Chem. Soc., 2009, 131, 5026–5027 CrossRef CAS PubMed.
- S. Yang, L. Zhi, K. Tang, X. Feng, J. Maier and K. Muellen, Adv. Funct. Mater., 2012, 22, 3634–3640 CrossRef CAS.
- Z. Li, Z. Xu, X. Tan, H. Wang, C. M. B. Holt, T. Stephenson, B. C. Olsen and D. Mitlin, Energy Environ. Sci., 2013, 6, 871–878 CAS.
- Y. S. Yun, S. Y. Cho, J. Shim, B. H. Kim, S.-J. Chang, S. J. Baek, Y. S. Huh, Y. Tak, Y. W. Park, S. Park and H.-J. Jin, Adv. Mater., 2013, 25, 1993–1998 CrossRef CAS PubMed.
- M. Biswal, A. Banerjee, M. Deo and S. Ogale, Energy Environ. Sci., 2013, 6, 1249–1259 CAS.
- L. Zhang, F. Zhang, X. Yang, K. Leng, Y. Huang and Y. Chen, small, 2013, 9, 1342–1347 CrossRef CAS PubMed.
- X.-L. Wu, T. Wen, H.-L. Guo, S. Yang, X. Wang and A.-W. Xu, ACS Nano, 2013, 7, 3589–3597 CrossRef CAS PubMed.
- H. Yao, G. Zheng, W. Li, M. T. McDowell, Z. Seh, N. Liu, Z. Lu and Y. Cui, Nano Lett., 2013, 13, 3385–3390 CrossRef CAS PubMed.
- F. Baltenneck, B. A. Bernard, J. C. Garson, P. Engstrom, C. Riekel, F. Leroy, A. Franbourg and J. Doucet, Cell. Mol. Biol., 2000, 46, 1017–1024 CAS.
- J. W. S. Hearle, J. Biol. Macromol., 2000, 27, 123–138 CrossRef CAS.
- L. D. Lee and H. P. Baden, Int. J. Dermatol., 1975, 14, 161–171 CrossRef CAS.
- M. Zhong, E. K. Kim, J. P. McGann, S.-E. Chun, J. F. Whitacre, M. Jaroniec, K. Matyjaszewski and T. Kowalewski, J. Am. Chem. Soc., 2012, 134, 14846–14857 CrossRef CAS PubMed.
- D. Feng, Y. Lv, Z. Wu, Y. Dou, L. Han, Z. Sun, Y. Xia, G. Zheng and D. Zhao, J. Am. Chem. Soc., 2011, 133, 15148–15156 CrossRef CAS PubMed.
- H. Zhu, X. Wang, X. Liu and X. Yang, Adv. Mater., 2012, 24, 6524–6529 CrossRef CAS PubMed.
- Y. Liang, F. Liang, H. Zhong, Z. Li, R. Fu and D. Wu, J. Mater. Chem. A, 2013, 1, 7000–7005 CAS.
- J. P. Paraknowitsch, J. Zhang, D. Su, A. Thomas and M. Antonietti, Adv. Mater., 2010, 22, 87–92 CrossRef CAS PubMed.
- L. Hao, X. Li and L. Zhi, Adv. Mater., 2013, 25, 3899–3904 CrossRef CAS PubMed.
- G. Zheng, L. Hu, H. Wu, X. Xie and Y. Cui, Energy Environ. Sci., 2011, 4, 3368–3373 CAS.
- J. P. Paraknowitsch, B. Wienert, Y. Zhang and A. Thomas, Chem.–Eur. J., 2012, 18, 15416–15423 CrossRef CAS PubMed.
- Q. Wu, Y. Xu, Z. Yao, A. Liu and G. Shi, ACS Nano, 2010, 4, 1963–1970 CrossRef CAS PubMed.
- K. Wang, Q. Meng, Y. Zhang, Z. Wei and M. Miao, Adv. Mater., 2013, 25, 1494–1498 CrossRef CAS PubMed.
- Y. Tan, C. Xu, G. Chen, Z. Liu, M. Ma, Q. Xie, N. Zheng and S. Yao, ACS Appl. Mater. Interfaces, 2013, 5, 2241–2248 CAS.
- H. Wang, Z. Xu, A. Kohandehghan, Z. Li, K. Cui, X. Tan, T. J. Stephenson, C. K. King'ondu, C. M. B. Holt, B. C. Olsen, J. K. Tak, D. Harfield, A. O. Anyia and D. Mitlin, ACS Nano, 2013, 7, 5131–5141 CrossRef CAS PubMed.
- H. Sun, L. Cao and L. Lu, Energy Environ. Sci., 2012, 5, 6206–6213 CAS.
- P. Xu, T. Gu, Z. Cao, B. Wei, J. Yu, F. Li, J.-H. Byun, W. Lu, Q. Li and T.-W. Chou, Adv. Energy Mater., 2013 DOI:10.1002/aenm.201300759..
- V. Subramanian, C. Luo, A. M. Stephan, K. S. Nahm, S. Thomas and B. Wei, J. Phys. Chem. C, 2007, 111, 7527–7531 CAS.
- L. Lai, H. Yang, L. Wang, B. K. Teh, J. Zhong, H. Chou, L. Chen, W. Chen, Z. Shen, R. S. Ruoff and J. Lin, ACS Nano, 2012, 6, 5941–5951 CrossRef CAS PubMed.
- Y. Gogotsi and P. Simon, Science, 2011, 334, 917–918 CrossRef CAS PubMed.
Footnote |
| † Electronic supplementary information (ESI) available: Pore-size distributions, XPS characterization and electrochemical measurement. See DOI: 10.1039/c3ee43111h |
| This journal is © The Royal Society of Chemistry 2014 |


