 Open Access Article
Synthesis, structure and luminescence properties of a cadmium(II)-based coordination polymer with (S)-4,4′-bis(4-carboxyphenyl)-2,2′-bis(diphenylphosphinoyl)-1,1′-binaphthyl as chiral linker†
Witri Wahyu
Lestari
a,
Huayna Cerqueira
Streit
b,
Peter
Lönnecke
a,
Claudia
Wickleder
*b and
Evamarie
Hey-Hawkins
*a
aInstitut für Anorganische Chemie, Fakultät für Chemie und Mineralogie, Universität Leipzig, Johannisallee 29, D-04103 Leipzig, Germany. E-mail: hey@rz.uni-leipzig.de; Fax: +49 341 9739319
bAnorganische Chemie II, Naturwissenschaftlich-Technische Fakultät, Department Chemie-Biologie, Universität Siegen, Adolf-Reichwein-Straße, D-57068 Siegen, Germany. E-mail: wickleder@chemie.uni-siegen.de; Fax: +49 271 4702555
First published on 3rd February 2014
Abstract
Solvothermal reaction of cadmium(II) nitrate with (S)-4,4′-bis(4-carboxyphenyl)-2,2′-bis(diphenylphosphinoyl)-1,1′-binaphthyl (H2L) in dimethylformamide (dmf) gave the two-dimensional chiral coordination polymer [{Cd2(L)2(H2O)}·18 dmf]n (1), which is thermally stable up to 400 °C according to DTA/TG analysis. According to single-crystal X-ray analysis, 1 forms layers in the [![[1 with combining macron]](https://www.rsc.org/images/entities/char_0031_0304.gif) 01] direction, which are relatively well separated from each other. Compound 1 exhibits ligand-based bluish luminescence, assigned to the S1→S0 transition of the aromatic units in L. Emission spectra consist of nearly Gaussian shaped bands with maxima at 25
01] direction, which are relatively well separated from each other. Compound 1 exhibits ligand-based bluish luminescence, assigned to the S1→S0 transition of the aromatic units in L. Emission spectra consist of nearly Gaussian shaped bands with maxima at 25![[thin space (1/6-em)]](https://www.rsc.org/images/entities/char_2009.gif) 574 and 24
574 and 24![[thin space (1/6-em)]](https://www.rsc.org/images/entities/char_2009.gif) 767 cm−1 for H2L and 1, respectively. Quantum efficiency reaches a remarkably high value of 42% for the Cd-based coordination polymer and 33% for the respective ligand. Emission intensity of 1 increases from 10 K to room temperature and decreases exponentially for temperatures up to 650 K.
767 cm−1 for H2L and 1, respectively. Quantum efficiency reaches a remarkably high value of 42% for the Cd-based coordination polymer and 33% for the respective ligand. Emission intensity of 1 increases from 10 K to room temperature and decreases exponentially for temperatures up to 650 K.
Introduction
Extended structures with permanent porosity, so-called metal–organic frameworks (MOFs)1 have received much attention during the past decade. These coordination polymers can be one-dimensional structures such as chains, ladders, or tapes,2 or two- and three-dimensional porous networks containing metal cations linked by suitable ligands to give infinite arrays,2–4 which can exhibit diverse properties for a broad range of applications. Specific properties, such as gas sorption, separation and catalytic function, are influenced by the structure.5 To modify these properties, the topology, rigidity and functionality of the ligands, as well as the metal cations, can be varied. Physical properties such as magnetism and luminescence result from combining intrinsic properties of the metal cations and the organic ligands.2b,5Different approaches have been applied to explore the luminescence properties of coordination polymers and MOFs.6 The ligand-based approach utilises the emission of light by extended conjugated π systems of the organic linker.6,7 Another possibility is the use of emitting ions, e.g., lanthanides, as connecting points in the framework6,8 or as guests within the pores of the framework.6,9 Luminescence of coordination polymers and MOFs containing transition metals ions is typically centred on the linker rather than on the metal. Thus, transition metal ions without unpaired electrons, such as ZnII and CdII, can yield linker-based highly emissive materials.6,10,11 Furthermore, molecular interactions can bring luminophores closer together in the solid state and thus enable electronic interactions between them (e.g., ligand-to-ligand charge transfer), which can cause spectral shifts, emission broadening, loss of vibronic structure, and increased emission lifetimes and quantum yields. Controlling these ligand–ligand interactions is important for applications that involve charge transport and to obtain tuneable emission colours.6
Employment of aromatic systems such as functionalised binaphthyl-derived ligands12–15 as rigid linkers yields homochiral coordination polymers that have been studied in enantioselective processes13a and asymmetric catalysis,14a–d for chiral sensing13d,15 and as luminescent materials.13b,c Furthermore, some one- and two-dimensional coordination polymers containing phosphorus or the oxygen atom of phosphine oxides as donors and silver(I),16 gold(I)17 and indium(III)18 exhibit strong luminescence properties. Herein, we present the synthesis, structure and optical properties of a chiral coordination polymer, namely, [{Cd2(L)2(H2O)}·18 dmf]n (1), which is based on CdII and (S)-4,4′-bis(4-carboxyphenyl)-2,2′-bis(diphenylphosphinoyl)-1,1′-binaphthyl as linker. Some Cd-based MOFs with 1,3- or 1,4-benzenedicarboxylate (BDC) and its derivatives,19 2,2′-, 3,3′-, 3,4′ or 4,4′-biphenyl dicarboxylate (BPDC)19d,20 or modified 2,2′-, 4,4′-, 6,6′- or 3,3′-di- and tetracarboxylate binaphthyl linkers and their derivatives11,15 exhibit versatile geometrical arrangements around the CdII cation, showing coordination numbers of 4 to 8.11,15,19,20 Even a coordination number of 9 was observed with oxalato ligands as linkers giving rise to a diamondoid network.21
Results and discussion
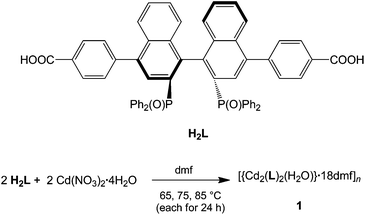
The reaction of H2L22 with cadmium(II) nitrate under solvothermal conditions in dmf progressively heated to 65, 75 and 85 °C (each for 24 h) gave 2D coordination polymer 1, which is insoluble in water and organic solvents (Scheme 1). Compound 1 crystallises in the monoclinic space group C2 with four molecules in the unit cell.
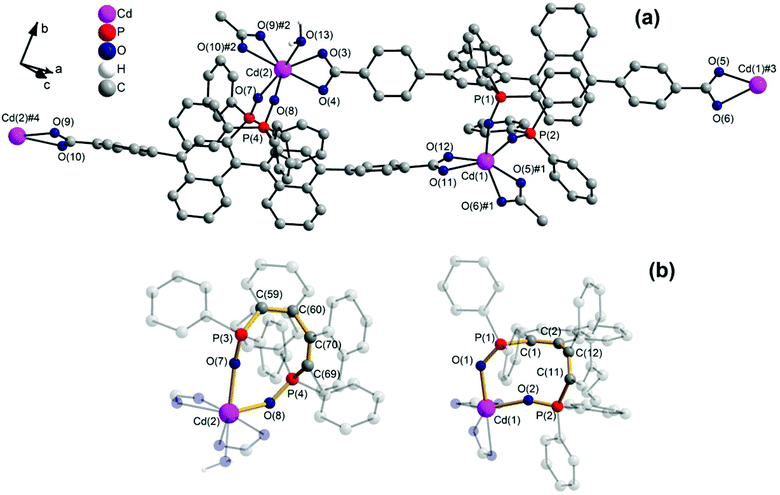
1 forms layers in [![[1 with combining macron]](https://www.rsc.org/images/entities/char_0031_0304.gif) 01] (Fig. 2) in which two differently coordinated cadmium atoms are linked via dianionic L ligands. One cadmium atom (Cd1) is hexacoordinate, and the other (Cd2) heptacoordinate. Both cadmium atoms are coordinated by two bidentate COO groups (O–Cd–O 53.2(2)–57.1(2)°, Cd1–O 2.283(5)–2.336(5) Å and Cd2–O from 2.291(5) to 2.437(7) Å, Table 1). The O–Cd–O bond angles and Cd–O bond lengths are in a good agreement with those reported in the literature for similar compounds.19c–f,20a,c Additionally, the two oxygen atoms of the bis(phosphine oxide) fragment coordinate to both cadmium atoms in a chelating fashion, forming nine-membered rings (Cd1–O1–P1–C1–C2–C12–C11–P2–O2 and Cd2–O7–P3–C59–C60–C70–C69–P4–O8, Fig. 1b) with O–Cd–O bond angles of 79.8(2) and 81.5(2)° and Cd–O bond lengths of 2.209(5) (Cd1–O1) to 2.301(6) (Cd2–O7) Å, respectively. The dihedral angles between the binaphthyl rings are slightly smaller (76.7(3) and 79.6(4)°) than the dihedral angle of the free ligand (82.05(4)°).22 Furthermore, one water molecule is coordinated to Cd2 (Cd2–O13 2.409(8) Å) (Fig. 1a). The topology of the resulting two-dimensional network shows a 3-c net with point (Schläfli) symbol {4.82} according to TOPOS23 (Fig. 3) and the RCSR database.24
01] (Fig. 2) in which two differently coordinated cadmium atoms are linked via dianionic L ligands. One cadmium atom (Cd1) is hexacoordinate, and the other (Cd2) heptacoordinate. Both cadmium atoms are coordinated by two bidentate COO groups (O–Cd–O 53.2(2)–57.1(2)°, Cd1–O 2.283(5)–2.336(5) Å and Cd2–O from 2.291(5) to 2.437(7) Å, Table 1). The O–Cd–O bond angles and Cd–O bond lengths are in a good agreement with those reported in the literature for similar compounds.19c–f,20a,c Additionally, the two oxygen atoms of the bis(phosphine oxide) fragment coordinate to both cadmium atoms in a chelating fashion, forming nine-membered rings (Cd1–O1–P1–C1–C2–C12–C11–P2–O2 and Cd2–O7–P3–C59–C60–C70–C69–P4–O8, Fig. 1b) with O–Cd–O bond angles of 79.8(2) and 81.5(2)° and Cd–O bond lengths of 2.209(5) (Cd1–O1) to 2.301(6) (Cd2–O7) Å, respectively. The dihedral angles between the binaphthyl rings are slightly smaller (76.7(3) and 79.6(4)°) than the dihedral angle of the free ligand (82.05(4)°).22 Furthermore, one water molecule is coordinated to Cd2 (Cd2–O13 2.409(8) Å) (Fig. 1a). The topology of the resulting two-dimensional network shows a 3-c net with point (Schläfli) symbol {4.82} according to TOPOS23 (Fig. 3) and the RCSR database.24
 | ||
Fig. 2 [![[1 with combining macron]](https://www.rsc.org/images/entities/char_0031_0304.gif) 01] layers of 1 (left) and space-filling model and polyhedral design (right), Diamond.25 01] layers of 1 (left) and space-filling model and polyhedral design (right), Diamond.25 | ||
| Bond lengths [Å] | Bond angles [°] | ||
|---|---|---|---|
| Symmetry transformations used to generate equivalent atoms: #1: −x + 3/2, y − 1/2, −z + 2; #2: −x + 1/2, y + 1/2, −z + 1. | |||
| Cd(1)–O(1) | 2.209(5) | O(1)–Cd(1)–O(2) | 79.8(2) |
| Cd(1)–O(2) | 2.234(5) | O(1)–Cd(1)–O(5)#1 | 98.0(2) |
| Cd(1)–O(5)#1 | 2.283(5) | O(2)–Cd(1)–O(5)#1 | 91.5(2) |
| Cd(1)–O(6)#1 | 2.336(5) | O(5)#1–Cd(1)–O(6)#1 | 57.1(2) |
| Cd(1)–O(11) | 2.297(6) | O(1)–Cd(1)–O(11) | 94.7(2) |
| Cd(1)–O(12) | 2.292(5) | O(12)–Cd(1)–O(11) | 55.9(2) |
| Cd(2)–O(3) | 2.437(7) | O(4)–Cd(2)–O(3) | 53.2(2) |
| Cd(2)–O(4) | 2.291(5) | O(9)#2–Cd(2)–O(10)#2 | 53.9(2) |
| Cd(2)–O(7) | 2.301(6) | O(10)#2–Cd(2)–O(13) | 81.4(2) |
| Cd(2)–O(8) | 2.253(5) | O(8)–Cd(2)–O(7) | 81.5(2) |
| Cd(2)–O(9)#2 | 2.349(6) | P(1)–O(1)–Cd(1) | 133.3(3) |
| Cd(2)–O(10)#2 | 2.409(6) | P(2)–O(2)–Cd(1) | 157.4(3) |
| Cd(2)–O(13) | 2.409(8) | P(3)–O(7)–Cd(2) | 163.8(3) |
| P(1)–O(1) | 1.520(6) | P(4)–O(8)–Cd(2) | 138.9(4) |
| P(2)–O(2) | 1.497(5) | ||
| P(3)–O(7) | 1.495(6) | ||
| P(4)–O(8) | 1.476(6) | ||
The dmf molecules occupy the space between the layers. The water molecule coordinated to Cd2 forms hydrogen bonds with two dmf molecules (O13–H13B⋯O202 and O13–H13A⋯O205; d(H⋯A) = 1.75 and 1.65 Å, d(D⋯A) = 2.73(1) and 2.63(2) Å and ∡(D–H⋯A) = 169.7 and 172.0°, respectively). In addition, very weak π⋯π interactions are observed between the layers. Removal of the solvent (by exposing the crystals to air for a couple of minutes) results in destruction of the structure (confirmed by single-crystal and powder X-ray diffraction; see ESI†).
The IR spectrum of 1 shows the bands for the coordinated carboxylate group at 1670 and 1594 cm−1, the coordinated water molecule at 3442 cm−1 and the P![[double bond, length as m-dash]](https://www.rsc.org/images/entities/char_e001.gif) O group at 1181 cm−1. Thermogravimetric analysis (TGA) of 1 after drying overnight in air indicated loss of one water molecule and three dmf molecules (calcd and observed 7.09%) in the range of 100 to 200 °C. No mass loss was detected between 200 and 400 °C, confirming the thermal stability of 1 up to 400 °C. Gradual decomposition occurred above 400 °C; the free ligand H2L is thermally stable up to 420 °C22 (see ESI†).
O group at 1181 cm−1. Thermogravimetric analysis (TGA) of 1 after drying overnight in air indicated loss of one water molecule and three dmf molecules (calcd and observed 7.09%) in the range of 100 to 200 °C. No mass loss was detected between 200 and 400 °C, confirming the thermal stability of 1 up to 400 °C. Gradual decomposition occurred above 400 °C; the free ligand H2L is thermally stable up to 420 °C22 (see ESI†).
Luminescence properties
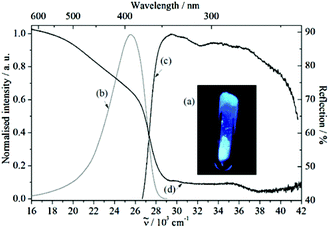
The free organic linker H2L and compound 1 show violet-blue emission on excitation with a UV lamp (Fig. 4a and 5a) at room temperature as solids. All emission bands are slightly unsymmetrical Gaussian-shaped. For H2L, the emission spectrum is centred invariably at 25![[thin space (1/6-em)]](https://www.rsc.org/images/entities/char_2009.gif) 574 cm−1 for different excitation energies, e.g., 30
574 cm−1 for different excitation energies, e.g., 30![[thin space (1/6-em)]](https://www.rsc.org/images/entities/char_2009.gif) 864 cm−1, with full width at half maximum (FWHM) of 3812 cm−1 (Fig. 4b). A comparable behaviour is observed for the emission spectrum of 1 (Fig. 5b), which is centred at 24
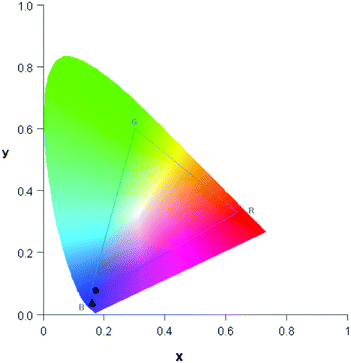
864 cm−1, with full width at half maximum (FWHM) of 3812 cm−1 (Fig. 4b). A comparable behaviour is observed for the emission spectrum of 1 (Fig. 5b), which is centred at 24![[thin space (1/6-em)]](https://www.rsc.org/images/entities/char_2009.gif) 767 cm−1, about 807 cm−1 red-shifted in comparison to H2L and the width reduced (FWHM = 3370 cm−1). The similar positions of the emission bands in H2L and 1 result in similar colour coordinates (H2L: x = 0.1697, y = 0.0801 and 1: x = 0.1595, y = 0.0396, Fig. 6).
767 cm−1, about 807 cm−1 red-shifted in comparison to H2L and the width reduced (FWHM = 3370 cm−1). The similar positions of the emission bands in H2L and 1 result in similar colour coordinates (H2L: x = 0.1697, y = 0.0801 and 1: x = 0.1595, y = 0.0396, Fig. 6).
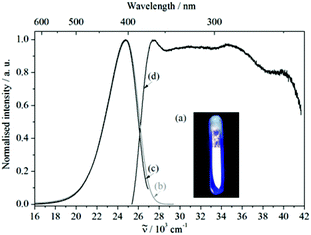 | ||
Fig. 5 (a) Violet-blue luminescence of 1, when illuminated with UV light. Emission (b) ![[small nu, Greek, tilde]](https://www.rsc.org/images/entities/i_char_e0e1.gif) ex = 27 ex = 27![[thin space (1/6-em)]](https://www.rsc.org/images/entities/char_2009.gif) 397 cm−1 and (c) 397 cm−1 and (c) ![[small nu, Greek, tilde]](https://www.rsc.org/images/entities/i_char_e0e1.gif) ex = 30 ex = 30![[thin space (1/6-em)]](https://www.rsc.org/images/entities/char_2009.gif) 769 cm−1 as well as (d) excitation ( 769 cm−1 as well as (d) excitation (![[small nu, Greek, tilde]](https://www.rsc.org/images/entities/i_char_e0e1.gif) em = 24 em = 24![[thin space (1/6-em)]](https://www.rsc.org/images/entities/char_2009.gif) 752 cm−1) spectra of compound 1. 752 cm−1) spectra of compound 1. | ||
As discussed previously,20f the positions of the bands can be explained by the different dihedral angles of the aromatic rings in 1 and H2L. In general, a smaller dihedral angle results in enhanced interactions of the π electrons, shifting the emission bands to lower energies. Here, the smaller dihedral angles between the binaphthyl rings in 1 (76.7(3)° and 79.6(4)°) compared to that of 82.05(4)° in the corresponding 4,4′-substituted binaphthyl,22 explain the red shift of 1 (Fig. 5b). Although the dihedral angles in the excited states are unknown, it can be assumed that the conformations will not change remarkably during the excitation processes in the rigid structures. The differences in widths of the emission bands can most probably be explained by distinct interatomic distances of the excited states relative to the ground states of these two compounds. Obviously, the interatomic distance of the excited state is smaller for 1 than for H2L, perhaps due to the more rigid structure of 1.
Similarly, in both cases, the excitation spectra consist of a broad band which extends over the UV range. The onsets of the excitation bands are at 26![[thin space (1/6-em)]](https://www.rsc.org/images/entities/char_2009.gif) 625 cm−1 (H2L) and 25
625 cm−1 (H2L) and 25![[thin space (1/6-em)]](https://www.rsc.org/images/entities/char_2009.gif) 325 cm−1 (1) and they show intensity maxima at 29
325 cm−1 (1) and they show intensity maxima at 29![[thin space (1/6-em)]](https://www.rsc.org/images/entities/char_2009.gif) 464 cm−1 (H2L) and 27
464 cm−1 (H2L) and 27![[thin space (1/6-em)]](https://www.rsc.org/images/entities/char_2009.gif) 475 cm−1 (1), followed by an intensity decrease at higher excitation energies (>36
475 cm−1 (1), followed by an intensity decrease at higher excitation energies (>36![[thin space (1/6-em)]](https://www.rsc.org/images/entities/char_2009.gif) 000 cm−1). Therefore, the similarity in position and shape of the excitation and emission spectra of H2L and 1 provide reliable evidence for assigning the optical properties of 1 to ligand-based excitation and emission. A further indication for this assignment is the similarity between the excitation spectrum of 1 (
000 cm−1). Therefore, the similarity in position and shape of the excitation and emission spectra of H2L and 1 provide reliable evidence for assigning the optical properties of 1 to ligand-based excitation and emission. A further indication for this assignment is the similarity between the excitation spectrum of 1 (![[small nu, Greek, tilde]](https://www.rsc.org/images/entities/i_char_e0e1.gif) em = 24
em = 24![[thin space (1/6-em)]](https://www.rsc.org/images/entities/char_2009.gif) 752 cm−1, Fig. 5d) and the reflection spectrum of H2L (Fig. 4d). Thus, a decrease of the reflection intensity of H2L is observed for energies larger than 20
752 cm−1, Fig. 5d) and the reflection spectrum of H2L (Fig. 4d). Thus, a decrease of the reflection intensity of H2L is observed for energies larger than 20![[thin space (1/6-em)]](https://www.rsc.org/images/entities/char_2009.gif) 000 cm−1, more pronounced for energies higher than 26
000 cm−1, more pronounced for energies higher than 26![[thin space (1/6-em)]](https://www.rsc.org/images/entities/char_2009.gif) 000 cm−1. Moreover, there is a maximum in the absorption intensity at 29
000 cm−1. Moreover, there is a maximum in the absorption intensity at 29![[thin space (1/6-em)]](https://www.rsc.org/images/entities/char_2009.gif) 000 cm−1, strongly overlapping in position and shape with the excitation spectrum of 1. In this context, ligand-based luminescence is generally expected for coordination compounds in which the metal ion does not show d–d or f–f electronic transitions, e.g., metal ions with a d10 configuration, such as Cd2+, Zn2+ and Ag+, and little or no electronic interaction between the metal ion and the organic ligand is observed.5
000 cm−1, strongly overlapping in position and shape with the excitation spectrum of 1. In this context, ligand-based luminescence is generally expected for coordination compounds in which the metal ion does not show d–d or f–f electronic transitions, e.g., metal ions with a d10 configuration, such as Cd2+, Zn2+ and Ag+, and little or no electronic interaction between the metal ion and the organic ligand is observed.5
The strong excitation bands are therefore caused by S0→S1 transition of the aromatic units in L or H2L. Also, the emission bands can be assigned to S1 rather than T1 emission due to the relatively small differences between the emission and excitation maxima (3980 cm−1 for H2L and 2708 cm−1 for 1). If this assumption is true, the larger Stokes shift of H2L compared to 1 also indicates a larger increase in the interatomic distance of the excited state relative to the ground state in H2L and would agree with the observation of different widths of the emission bands.
The quantum yields (QY) of solid H2L (33%) and 1 (42%) are considerably high, and indicate decreased loss of efficiency of the ligand-based luminescence in 1. This enhancement is related to an increase in structural rigidity in the coordination polymer 1.5 In general, there is relatively low vibrational quenching in the case of both compounds, which is quite uncommon for such kind of compounds with large vibrational energies.
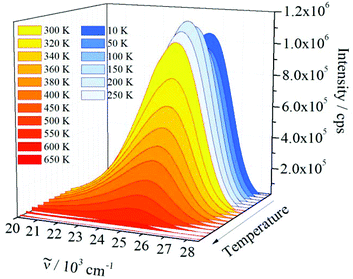
Luminescence measurements at low temperatures, e.g., at 10 K, are important for studying possible additional electronic transitions, which may be quenched at room temperature. Furthermore, 1 was heated close to the decomposition temperature (650 K, see ESI†) to investigate the effect of increasing temperature on the emission intensity and the maximum shift. As shown in Fig. 7, the emission spectrum of 1 is very similar in shape and position at temperatures between 10 and 650 K and no additional electronic transitions were detected. The maximum of the emission band located at 25![[thin space (1/6-em)]](https://www.rsc.org/images/entities/char_2009.gif) 439 cm−1 at 10 K is red-shifted to 25
439 cm−1 at 10 K is red-shifted to 25![[thin space (1/6-em)]](https://www.rsc.org/images/entities/char_2009.gif) 192 cm−1 at 650 K. Such red shifts are generally observed and can be explained by different effects: by occupation of higher vibronic levels and partly by distortion of the harmonic potentials of the excited electronic state at high temperatures.
192 cm−1 at 650 K. Such red shifts are generally observed and can be explained by different effects: by occupation of higher vibronic levels and partly by distortion of the harmonic potentials of the excited electronic state at high temperatures.
Between 10 K and room temperature (300 K), the emission intensity of 1 shows an unusual behaviour. In order to roughly quantify the variation of the emission intensity, the curves of the emission spectra presented in Fig. 7 were integrated and plotted against the temperature (Fig. 8).
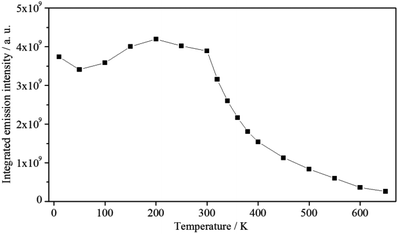 | ||
Fig. 8 Exponential decay of the integrated emission intensity (![[small nu, Greek, tilde]](https://www.rsc.org/images/entities/i_char_e0e1.gif) ex = 30 ex = 30![[thin space (1/6-em)]](https://www.rsc.org/images/entities/char_2009.gif) 303 cm−1) of 1 with increasing temperature. 303 cm−1) of 1 with increasing temperature. | ||
Initially, the intensity decreases by ca. 10% from 10 to 50 K, gradually increases by about 20%, reaching the maximum value at 200 K, and is approximately constant up to 300 K. The initial decrease in emission intensity is expected due to the enhanced loss of excitation energy by non-radiative transitions. However, the increase in emission intensity between 50 and 200 K is rather unusual. Probably, the excited states of the ligands and the states of quenching moieties are arranged relative to each other in such a way that quenching is reduced in this temperature range compared to low temperatures, while quenching processes become dominant at higher temperatures. However, further experiments are necessary to investigate and prove this assumption. Between 300 and 650 K an exponential decrease of the emission intensity is observed. Such a large energy loss caused by non-radiative transitions is commonly observed for luminescent materials at high temperatures.
Experimental section
Materials and general methods
Commercial reagents were used as purchased without further purification. (S)-4,4′-bis(4-carboxyphenyl)-2,2′-bis(diphenylphosphinoyl)-1,1′-binaphthyl (H2L) was prepared according to the literature procedure.22 The IR spectra were recorded on a Perkin-Elmer Spectrum 2000 FTIR spectrometer by using KBr pellets in the range of 4000–500 cm−1. Elemental analysis was performed with a Heraeus Vario EL CHN-O analyzer. Thermal analyses were carried out on a Netzsch STA/QMS system 409/429-403 thermal analyzer from room temperature to 900 °C with a heating rate of 10 °C min−1 under helium atmosphere.Synthesis of [{Cd2(L)2(H2O)}·18 dmf]n (1)
Solvothermal synthesis of 1 was accomplished in a stainless steel autoclave under autogenic pressure with an appropriate Teflon vessel (Parr), 15 mL volume. The temperature program in a ULE400 oven (Memmert) was regulated by using the software Celsius 2005 (Version 6.1). A mixture of Cd(NO3)2·4H2O (0.024 g, 0.078 mmol), (S)-H2L (0.02 g, 0.022 mmol) and dmf (10 mL) was progressively heated to 65, 75 and 85 °C (each for 24 h), and cooled to room temperature over 3 d. Colourless crystals of 1 were obtained, collected by filtration, washed with dmf (3 × 5 mL) and dried at room temperature. Yield: 23 mg (62.5% based on H2L). Anal. Calcd for 1−3 dmf (%): C, 61.88; H, 5.90; N, 6.72; Found: C, 60.00, H, 5.90, N, 6.50. IR (KBr pellet, cm−1): 3442 (br, OH), 3055 (w, C–H aryl), 2928 (w, C–H), 2342 (w), 1670 (s, νasCOO), 1594 (m, νsCOO), 1540 (m), 1498 (w), 1438 (m, P–C6H5), 1389 (s), 1256 (s), 1181 (s, P![[double bond, length as m-dash]](https://www.rsc.org/images/entities/char_e001.gif) O), 1098 (s), 1019 (m), 974 (w), 865 (s), 792 (s), 756 (w, C–H), 722 (s), 698 (s, P–C), 663 (s), 594 (s), 545 (s, C–H), 471 (w).
O), 1098 (s), 1019 (m), 974 (w), 865 (s), 792 (s), 756 (w, C–H), 722 (s), 698 (s, P–C), 663 (s), 594 (s), 545 (s, C–H), 471 (w).
Crystal structure determination
Data collection for colourless crystals of 1 was performed on a Gemini-S CCD diffractometer (Agilent Technologies) with Cu-Kα-radiation (λ = 1.54184 Å) at 130(2) K and omega scan rotation. Data collection and data reduction were done with CrysAlisPro including the program SCALE3 ABSPACK for empirical absorption correction.26 Anisotropic refinement of all non-hydrogen atoms, except dmf molecules, with SHELXL-97.27 All hydrogen atoms were calculated on idealised positions by using the riding model. It was possible to locate the water and eight non-disordered of the 18 dmf molecules of the asymmetric unit. With the exception of water, these eight solvent molecules were refined isotropically. 181 restraints were used to model the highly disordered dmf molecules. All other solvent molecules were found to be extremely disordered and poorly defined. The hkl file was corrected for these disordered solvent molecules by using the program SQUEEZE.28 The total SQUEEZE electron count revealed 1586 electrons for a volume of 5924 Å3 (voids smaller than 50 Å3 were not taken into account). Due to this electron count, 40 dmf molecules of the unit cell, i.e. 10 dmf molecules of the asymmetric unit were removed. The resulting volume of approximately 148 Å3 for one of these disordered dmf molecules correlates well with the reported volume for non-disordered dmf molecules (102 Å3),29 Structure figures were generated with Diamond-3.25 Crystallographic data for [{Cd2(L)2(H2O)}·18dmf]n (1): C170H204Cd2N18O31P4, M = 3344.19 g mol−1, space group C2, a = 32.8047(8), b = 16.8286(5), c = 31.6834(8) Å, α = 90, β = 91.867(2), γ = 90°, V = 17![[thin space (1/6-em)]](https://www.rsc.org/images/entities/char_2009.gif) 481.8(8) Å3, Z = 4, ρcalcd = 1.271 Mg m−3, μ(CuKα) = 2.894 mm−1. Least-squares refinements based on 48
481.8(8) Å3, Z = 4, ρcalcd = 1.271 Mg m−3, μ(CuKα) = 2.894 mm−1. Least-squares refinements based on 48![[thin space (1/6-em)]](https://www.rsc.org/images/entities/char_2009.gif) 559 reflections (18
559 reflections (18![[thin space (1/6-em)]](https://www.rsc.org/images/entities/char_2009.gif) 286 independent reflections and 1360 parameters) led to convergence. For I > 2σ(I) the final R1 = 0.0604, wR2 = 0.1578, Flack parameter = 0.009(6) and GOF = 1.000.
286 independent reflections and 1360 parameters) led to convergence. For I > 2σ(I) the final R1 = 0.0604, wR2 = 0.1578, Flack parameter = 0.009(6) and GOF = 1.000.
Luminescence measurements
Photoluminescence investigations at room and low temperature (ca. 10 K) on solid samples sealed in silica ampoules were carried out with a Jobin Yvon fluorescence spectrometer (Fluorolog 3) equipped with two 0.22 m double monochromators (SPEX, 1680) and a 450 W xenon lamp. Cooling to 10 K was achieved by a closed-cycle He cryostat (Janis Research). Measurements at high temperature (up to 650 K) were carried out with a Jobin Yvon fluorescence spectrometer (FluoroMax), equipped with two monochromators and a 150 W xenon lamp, combined with an attached oven. The emission spectra were corrected for photomultiplier sensitivity, the excitation spectra for lamp intensity and both for the transmission of the monochromators. Quantum yields of solid samples were measured with a Fluorolog 3 fluorescence spectrometer having an additional Ulbricht sphere. For reflection measurements in the UV/Vis range, a Cary 5000 instrument (Varian) was used.Conclusions
Chiral coordination polymer 1 based on cadmium(II) and (S)-4,4′-bis(4-carboxyphenyl)-2,2′-bis(diphenylphosphinoyl)-1,1′-binaphthyl (H2L) as linker was synthesised solvothermally and fully characterised. Compounds H2L and 1 show intense blue emission when excited with UV light. Emission spectra consist of nearly Gaussian shaped bands at 25![[thin space (1/6-em)]](https://www.rsc.org/images/entities/char_2009.gif) 574 cm−1 for H2L and 24
574 cm−1 for H2L and 24![[thin space (1/6-em)]](https://www.rsc.org/images/entities/char_2009.gif) 767 cm−1 for 1. Similarities between the excitation and emission spectra of 1 and H2L are indicative of S1→S0 transitions of L. Moreover, the quantum efficiency increases from 33% in H2L to the remarkably high value of 42% in 1, which indicates that incorporation of L into the rigid framework prevents the loss of excitation energy by non-radiative transitions. The emission intensity of 1 increases between 10 K and room temperature, and decreases exponentially up to 650 K.
767 cm−1 for 1. Similarities between the excitation and emission spectra of 1 and H2L are indicative of S1→S0 transitions of L. Moreover, the quantum efficiency increases from 33% in H2L to the remarkably high value of 42% in 1, which indicates that incorporation of L into the rigid framework prevents the loss of excitation energy by non-radiative transitions. The emission intensity of 1 increases between 10 K and room temperature, and decreases exponentially up to 650 K.
Acknowledgements
This work was supported by the Faculty for the Future (FFTF-Schlumberger Foundation for Women in Science and Engineering, doctoral fellowship for W.W.L.). Support from the EU COST Action CM0802 PhoSciNet is gratefully acknowledged. We thank Chemetall GmbH and BASF SE for generous donations of chemicals. We thank MSc Marcel Handke and MSc Carola Stenz for PXRD measurement and TOPOS analysis.References
- (a) O. M. Yaghi and H. Li, J. Am. Chem. Soc., 1995, 117, 10401–10402 CrossRef CAS; (b) O. M. Yaghi, D. A. Richardson, G. Li, E. Davis and T. L. Groy, Mater. Res. Soc. Symp. Proc., 1995, 371, 15–19 CrossRef CAS PubMed; (c) H. Li, M. Eddaoudi, M. O'Keeffe and O. M. Yaghi, Nature, 1999, 402, 276–279 CrossRef CAS PubMed.
- (a) M. J. Zaworotko, Nat. Chem., 2009, 1, 267–268 CrossRef CAS PubMed; (b) J. J. Perry IV, J. A. Perman and M. J. Zaworotko, Chem. Soc. Rev., 2009, 38, 1400–1417 RSC and references therein.
- S. R. Batten, D. R. Turner and M. S. Neville, in Coordination Polymers: Design, Analysis and Application, RSC, Cambridge, 2009 Search PubMed.
- (a) S.-I. Noro, S. Kitagawa, M. Kondo and K. Seki, Angew. Chem., 2000, 112, 2161–2164 ( Angew. Chem., Int. Ed. , 2000 , 39 , 2082–2084 ) CrossRef; (b) S. Shimomura, S. Horike and S. Kitagawa, Stud. Surf. Sci. Catal., 2007, 170B, 1983–1990 CrossRef CAS.
- D. Farrusseng, in Metal-Organic Frameworks—Applications from Catalysis to Gas Storage, Wiley-VCH, Weinheim, 1st edn, 2011 Search PubMed.
- (a) M. D. Allendorf, C. A. Bauer, R. K. Bhakta and R. J. T. Houk, Chem. Soc. Rev., 2009, 38, 1330–1352 RSC; (b) Y. Cui, Y. Yue, G. Qian and B. Chen, Chem. Rev., 2012, 112, 1126–1162 CrossRef CAS PubMed.
- (a) C. A. Bauer, T. V. Timofeeva, T. B. Settersten, B. D. Patterson, V. H. Liu, B. A. Simmons and M. D. Allendorf, J. Am. Chem. Soc., 2007, 129, 7136–7144 CrossRef CAS PubMed; (b) X.-L. Wang, Y.-F. Bi, H.-Y. Lin and G.-C. Liu, Cryst. Growth Des., 2007, 7, 1086–1091 CrossRef CAS; (c) Y.-Q. Huang, B. Ding, H.-B. Song, B. Zhao, P. Ren, P. Cheng, H.-G. Wang, D.-Z. Liao and S.-P. Yan, Chem. Commun., 2006, 4906–4908 RSC; (d) X. Li, X.-W. Wang and Y.-H. Zhang, Inorg. Chem. Commun., 2008, 11, 832–834 CrossRef CAS PubMed.
- (a) C. J. Holler, P. R. Matthes, M. Adlung, C. Wickleder and K. Müller-Buschbaum, Eur. J. Inorg. Chem., 2012, 33, 5479–5484 CrossRef; (b) P. J. Calderonea, A. M. Plonka, D. Banerjee, Q. A. Nizami and J. B. Parise, Solid State Sci., 2013, 15, 36–41 CrossRef PubMed; (c) X.-H. Zhou, L. Li, H.-H. Li, A. Li, T. Yanga and W. Huang, Dalton Trans., 2013, 42, 12403–12409 RSC; (d) J. Rocha, L. D. Carlos, F. A. A. Paz and D. Ananias, Chem. Soc. Rev., 2011, 40, 926–940 RSC; (e) H.-M. Wang, Y.-Y. Yang, C.-H. Zeng, T.-S. Chu, Y.-M. Zhu and S. W. Ng, Photochem. Photobiol. Sci., 2013, 12, 1700–1706 RSC.
- (a) H. C. Streit, M. Adlung, O. Shekhah, X. Stammer, H. K. Arslan, O. Zybaylo, T. Ladnorg, H. Gliemann, M. Franzreb, C. Woell and C. Wickleder, ChemPhysChem, 2012, 13, 2699–2702 CrossRef CAS PubMed; (b) W.-G. Lu, L. Jiang, X.-L. Feng and T.-B. Lu, Inorg. Chem., 2009, 48, 6997–6999 CrossRef CAS PubMed.
- (a) C.-J. Chen, X.-P. Ye, J.-Y. Gao, W.-P. Xie, X.-R. Ran, S.-T. Yue and Y.-P. Cai, Inorg. Chem. Commun., 2013, 29, 4–10 CrossRef CAS PubMed; (b) H. Wang, W. Shi, B. Zhai, J. Ma, J. Xia and P. Cheng, J. Mol. Struct., 2007, 833, 102–107 CrossRef CAS PubMed; (c) Q.-R. Fang, G.-S. Zhu, Z. Jin, Y.-Y. Ji, J.-W. Ye, M. Xue, H. Yang, Y. Wang and S.-L. Qiu, Angew. Chem., 2007, 119, 6758–6762 ( Angew. Chem., Int. Ed. , 2007 , 46 , 6638–6642 ) CrossRef; (d) L. Wen, Z. Lu, J. Lin, Z. Tian, H. Zhu and Q. Meng, Cryst. Growth Des., 2007, 7, 93–99 CrossRef CAS.
- W.-Y. Huanga, Z.-L. Chen, H.-H. Zou, D.-C. Liu and F.-P. Liang, Polyhedron, 2013, 50, 1–9 CrossRef PubMed.
- (a) Y. Cui, H. L. Ngo and W. Lin, Chem. Commun., 2003, 1388–1389 RSC; (b) Y. Cui, S. J. Lee and W. Lin, J. Am. Chem. Soc., 2003, 125, 6014–6015 CrossRef CAS PubMed; (c) C.-D. Wu and W. Lin, Chem. Commun., 2005, 3673–3675 RSC; (d) C.-D. Wu, L. Ma and W. Lin, Inorg. Chem., 2008, 47, 11446–11448 CrossRef CAS PubMed; (e) C.-D. Wu, L. Zhang and W. Lin, Inorg. Chem., 2006, 45, 7278–7285 CrossRef CAS PubMed; (f) O. R. Evans, H. L. Ngo and W. Lin, J. Am. Chem. Soc., 2001, 123, 10395–10396 CrossRef CAS.
- (a) B. Kesanli and W. Lin, Coord. Chem. Rev., 2003, 246, 305–326 CrossRef CAS PubMed; (b) Q. Gaoa, F.-L. Jianga, M.-Y. Wua, Y.-G. Huanga, L. Chena, W. Wie and M.-C. Hong, J. Solid State Chem., 2009, 182, 1499–1505 CrossRef PubMed; (c) C.-D. Wu, H. L. Ngo and W. Lin, Chem. Commun., 2004, 1588–1589 RSC; (d) S. J. Lee and W. Lin, J. Am. Chem. Soc., 2002, 124, 4554–4555 CrossRef CAS PubMed.
- (a) A. Hu, H. L. Ngo and W. Lin, J. Am. Chem. Soc., 2003, 125, 11490–11491 CrossRef CAS PubMed; (b) C.-D. Wu, A. Hu, L. Zhang and W. Lin, J. Am. Chem. Soc., 2005, 127, 8940–8941 CrossRef CAS PubMed; (c) L. Ma, C.-D. Wu, M. M. Wanderley and W. Lin, Angew. Chem., 2010, 122, 8420–8424 ( Angew. Chem., Int. Ed. , 2010 , 49 , 8244–8248 ) CrossRef; (d) L. Ma, J. M. Falkowski, C. Abney and W. Lin, Nat. Chem., 2010, 20, 838–846 CrossRef PubMed; (e) Y. Cui, O. R. Evans, H. L. Ngo, P. S. White and W. Lin, Angew. Chem., 2002, 114, 1207–1210 ( Angew. Chem., Int. Ed. , 2002 , 41 , 1159–1162 ) CrossRef; (f) L. Ma, D. J. Mihalcik and W. Lin, J. Am. Chem. Soc., 2009, 131, 4610–4612 CrossRef CAS PubMed.
- (a) M. M. Wanderley, C. Wang, C.-D. Wu and W. Lin, J. Am. Chem. Soc., 2012, 134, 9050–9053 CrossRef CAS PubMed; (b) X. Ouyang, Z. Chen, X. Liu, Y. Yang, M. Deng, L. Weng, Y. Zhou and Y. Jia, Inorg. Chem. Commun., 2008, 11, 948–950 CrossRef CAS PubMed.
- (a) L. Li, Z.-G. Ren, N.-Y. Li, Y. Zhang and J.-P. Lang, Inorg. Chim. Acta, 2009, 362, 3910–3914 CrossRef CAS PubMed; (b) N.-Y. Li, Z.-G. Ren, D. Liu, R.-X. Yuan, L.-P. Wei, L. Zhang, H.-X. Lia and J.-P. Lang, Dalton Trans., 2010, 39, 4213–4222 RSC.
- (a) M.-C. Brandys and R. J. Puddephatt, J. Am. Chem. Soc., 2001, 123, 4839–4840 CrossRef CAS; (b) M. Frik, J. Jiménez, I. Gracia, L. R. Falvello, S. Abi-Habib, K. Suriel, T. R. Muth and M. Contel, Chem.–Eur. J., 2012, 18, 3659–3674 CrossRef CAS PubMed.
- Q. Gao, M.-Y. Wu, L. Chen, F.-L. Jiang and M.-C. Hong, Inorg. Chem. Commun., 2009, 12, 1238–1241 CrossRef CAS PubMed.
- (a) J. J. Zhang, L. Wojtas, R. W. Larsen, M. Eddaoudi and M. J. Zaworotko, J. Am. Chem. Soc., 2009, 131, 17040–17041 CrossRef CAS PubMed; (b) J.-D. Lin, X.-F. Long, P. Lin and S.-W. Du, Cryst. Growth Des., 2010, 10, 146–157 CrossRef CAS; (c) A. D. Burrows, K. Cassar, T. Düren, R. M. W. Friend, M. F. Mahon, S. P. Rigby and T. L. Savarese, Dalton Trans., 2008, 2465–2474 RSC; (d) X. Shi, G. Zhu, X. Wang, G. Li, Q. Fang, G. Wu, G. Tian, M. Xue, X. Zhao, R. Wang and S. Qiu, Cryst. Growth Des., 2005, 5, 207–213 CrossRef CAS; (e) R.-Q. Zou, X.-H. Bu and R.-H. Zhang, Inorg. Chem., 2004, 43, 5382–5386 CrossRef CAS PubMed; (f) O. A. Michaelides, D. Tsaousis, S. Skoulika, C. P. Raptopoulou and A. Terzis, Acta Crystallogr., Sect. B: Struct. Sci., 1998, 54, 657–662 CrossRef; (g) I. Grosu, P. Lönnecke, L. Silaghi-Dumitrescu and E. Hey-Hawkins, Z. Anorg. Allg. Chem., 2011, 637, 1722–1727 CrossRef.
- (a) F. Guo, F. Wang, H. Yang, X. Zhang and J. Zhang, Inorg. Chem., 2012, 51, 9677–9682 CrossRef CAS PubMed; (b) H. Xu, W. Bao, Y. Xu, X. Liu, X. Shen and D. Zhu, CrystEngComm, 2012, 14, 5720–5722 RSC; (c) F. A. A. Paz, Y. Z. Khimyak, A. D. Bond, J. Rocha and J. Klinowski, Eur. J. Inorg. Chem., 2002, 2823–2828 CAS; (d) Q.-R. Fang, G.-S. Zhu, Z. Jin, Y.-Y. Ji, J.-W. Ye, M. Xue, H. Yang, Y. Wang and S.-L. Qiu, Angew. Chem., 2007, 119, 6758–6762 ( Angew. Chem., Int. Ed. , 2007 , 46 , 6638–6642 ) CrossRef; (e) R. Wang, M. Hong, J. Luo, R. Cao and J. Weng, Chem. Commun., 2003, 1018–1019 RSC; (f) W. W. Lestari, P. Lönnecke, M. B. Sárosi, H. C. Streit, M. Adlung, C. Wickleder, M. Handke, W. D. Einicke, R. Gläser and E. Hey-Hawkins, CrystEngComm, 2013, 15, 3874–3884 RSC.
- R.-Q. Zhonga, R.-Q. Zoua, D. S. Pandey, T. Kiyobayashi and Q. Xua, Inorg. Chem. Commun., 2008, 11, 951–953 CrossRef PubMed.
- W. W. Lestari, H. Zaake-Hertling, P. Lönnecke and E. Hey-Hawkins, Z. Anorg. Allg. Chem., 2013, 639, 2589–2596 CrossRef.
- TOPOS 4.0 Search PubMed; V. A. Blatov, IUCr CompComm Newsl., 2006, 7, 4–38 Search PubMed.
- M. O'Keeffe, M. A. Peskov, S. J. Ramsden and O. M. Yaghi, Acc. Chem. Res., 2008, 41, 1782–1789 CrossRef CAS PubMed.
- Diamond, Version 3.2i, Klaus Brandenburg, Crystal Impact GbR, Bonn, Germany Search PubMed.
- CrysAlisPro, Data Collection and Data Reduction Software Package Including SCALE3 ABSPACK for Empirical Absorption Correction using Spherical Harmonics, version 1.171.35.21, release 20-01-2012 CrysAlis171 .NET, Agilent Technologies Search PubMed.
- SHELX includes SHELXS97, SHELXL97: G. M. Sheldrick, Acta Cryst., 2008, A64, 112–122 CrossRef PubMed.
- SQUEEZE CrossRef; P. van der Sluis and A. L. Spek, Acta Crystallogr., Sect. A: Fundam. Crystallogr., 1990, 46, 194–201 CrossRef.
- H. Borrmann, I. Persson, M. Sandström and C. M. V. Stålhandske, J. Chem. Soc., Perkin Trans. 2, 2000, 393–402 RSC.
Footnote |
| † Electronic supplementary information (ESI) available: Powder X-ray diffraction and thermal analysis of 1. CCDC 958436. For ESI and crystallographic data in CIF or other electronic format see DOI: 10.1039/c3dt53543f |
| This journal is © The Royal Society of Chemistry 2014 |

