
 Open Access Article
 This Open Access Article is licensed under a Creative Commons Attribution-Non Commercial 3.0 Unported Licence
In operando monitoring of the state of charge and species distribution in zinc air batteries using X-ray tomography and model-based simulations†
Tobias
Arlt
*a,
Daniel
Schröder
b,
Ulrike
Krewer
b and
Ingo
Manke
a
aHelmholtz-Zentrum Berlin für Materialien und Energie GmbH, Hahn-Meitner-Platz 1, 14109 Berlin, Germany. E-mail: tobias.arlt@helmholtz-berlin.de
bInstitute of Energy and Process Systems Engineering, TU Braunschweig, Franz-Liszt-Str. 35, 38106 Braunschweig, Germany
First published on 9th September 2014
Abstract
A novel combination of in operando X-ray tomography and model-based analysis of zinc air batteries is introduced. Using this approach the correlation between the three-dimensional morphological properties of the electrode – on the one hand – and the electrochemical properties of the battery – on the other hand is revealed. In detail, chemical dissolution of zinc particles and the electrode volume were investigated non-destructively during battery operation by X-ray tomography (applying a spatial resolution of 9 μm), while simulation yielded cell potentials of each electrode and allows for the prediction of long-term operation behavior. Furthermore, the analysis of individual zinc particles revealed an electrochemical dissolution process that can be explained using an adapted shrinking-core model.
1. Introduction
Due to the shortage of conventional energy sources such as oil or natural gas, energy sources and novel energy storage approaches are currently the main focus of industry and research. Within this scope, zinc air batteries are promising for a wide range of applications. Considering their high theoretical energy density, they are appealing candidates for energy storage systems; they impress with an approximately three times higher energy density than conventional lithium ion batteries.In zinc air batteries, the stored active material zinc reacts with oxygen from the surrounding air which is not stored within the battery. This consequently reduces the total battery weight and volume. The applied zinc itself is non-toxic, of low cost and available in sufficient amounts.
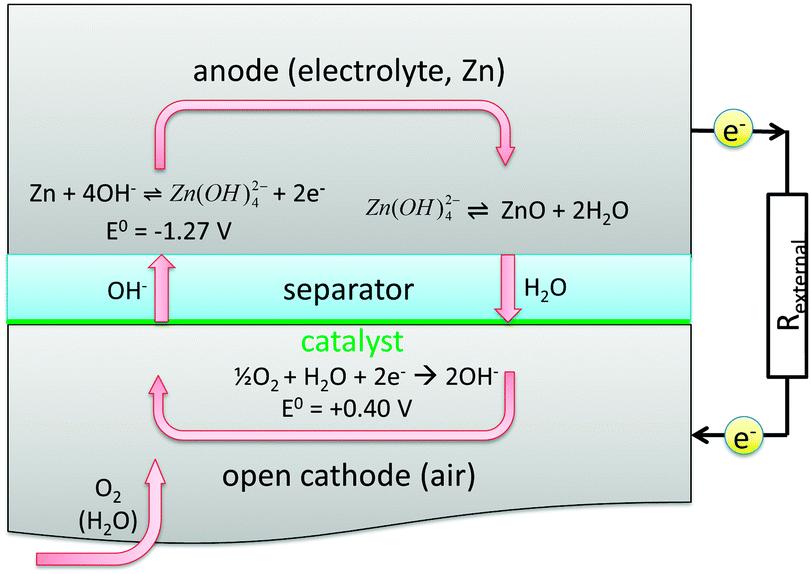
Commonly, zinc air batteries are composed of a zinc electrode, an air electrode, a liquid electrolyte and a separator. The occurring reactions and potentials with the usually applied alkaline electrolyte are shown in Fig. 1.
 | ||
| Fig. 1 Sketch of reactions in a zinc air battery during discharging.1 | ||
At the zinc electrode, solid zinc reacts electrochemically to form electrons and an intermediate zincate ion, which is then in chemical equilibrium to form zinc oxide, hydroxide and water. At the air electrode, oxygen, water and electrons electrochemically react to form hydroxide ions.2
Currently zinc air batteries are commercially available on the market as primary button cells. Obtainable practical energy densities are 200 to 400 W h kg−1.3 Using high-performance hybrid electrocatalysts, such as CoO–carbon nanotubes, the energy density can be increased to 700 W h kg−1.4 Being still far away from their theoretical value of 1353 W h kg−1, there is high potential for improvement of such cells in nearby future.
The present low practical energy density can mainly be attributed to two areas of challenge: on the material level and on the battery level.5,6 The material based research on zinc air batteries is far more common and mainly coping with experimental investigations of applied materials in the entire battery: from analyzing cycling stability of the air electrode7,8 and separator stability9 to investigating additives in the applied electrolyte.10
However, the main field of interest is the research on the zinc electrode and its cycling behavior concerning issues of dendrite formation and shape change.11–13 During discharge the zinc electrode undergoes a volume change. Since zinc is a metal with a relative high mass density of about 7.14 g cm−3 and zinc oxide possesses a mass density of 5.61 g cm−3, a completely discharged zinc air battery might have increased its active volume by approximately 27%.
On the one hand, imaging methods are capable of monitoring such complex processes as particle dissolution or material redistribution with high spatial resolution in the zinc electrode during discharge and charge. Recently, approaches for visualization of electrochemical systems by magnetic resonance imaging methods14 and for X-ray imaging of Li-ion batteries15–17 were introduced, aiming to gain a deeper insight at the electrode level. On the other hand, mathematical models help to analyze to what extend the volume change in the zinc electrode influences the water and electrolyte balance in such electrochemical cells.6 Models also provide an insight into species concentration and in addition the spatial distribution of ionic and electric currents can be predicted.
Focusing on electrical recharge, operation time is longer for secondary zinc air batteries than for primary batteries. Therewith the impact of environmental air-composition (in particular carbon dioxide and water vapor) on the open air electrode is more distinct and consequently will result in even more complex electrochemical processes within the battery and finally leads to decreased performance and stability of the battery. Those processes are difficult to access experimentally. Modeling methods help to gain a better understanding of these processes. Thus both methods, imaging and modeling, complement each other for all before mentioned challenges for zinc air batteries.
In this work we present a novel combination of the X-ray imaging method and model-based analysis. We aim to further quantify the occurring processes in the zinc electrode during battery discharge, which reveals in-depth information and helps to improve zinc air batteries.
2. Experimental: X-ray imaging and battery discharge
A commercially available ZA13 zinc air battery button cell was chosen for the experimental investigations.18 Its overall dimensions (7.9 mm diameter, 5.9 mm height) are beneficial for the analysis with X-rays, so that a large variety of zinc particles inside the battery as well as a reasonable spatial resolution, namely 9.0 μm, was ensured.The battery was discharged using an ohmic resistance of 678 Ω at a temperature of 20 °C. Due to the linear discharge profile of zinc air batteries, the applied resistance evoked a nearly constant current density of about 5.42 mA cm−2, whereas the current density was in the ohmic region of the polarization-characteristic.18 Cell potential was recorded during discharge by hand using a Voltcraft VC250 multimeter.19
As shown in Fig. 2, a conventional X-ray tube was used for tomographic measurements. The accelerating voltage was tuned to 100 kV while the current at the tungsten anode was adjusted to 100 μA. The spectrum is shown in Fig. 2a. A 1 mm copper filter was applied in order to avoid beam hardening. 1200 projections were taken for a full tomography (full range over 360°). Each angle step was exposed for 2.2 s three times to increase the signal-to-noise-ratio. The projections were taken using a Hamamatsu flat panel detector with 2316 × 2316 pixel. Tomographic measurements with an approximate duration of about 3.5 hours were taken at the initial battery state, after several discharge steps (10 in total) and finally at the end-of-life of the battery. Subsequent to measurements, tomographies were reconstructed using Octopus software.20,21 The discharge process was stopped during tomographic measurements and continued afterwards. Tomographic measurements were started after switching off the current load and after reaching a constant cell potential. This was done to avoid particle movement and zinc conversion that would occur during continuous discharge and would lead to uncorrectable errors in the reconstructed tomography.
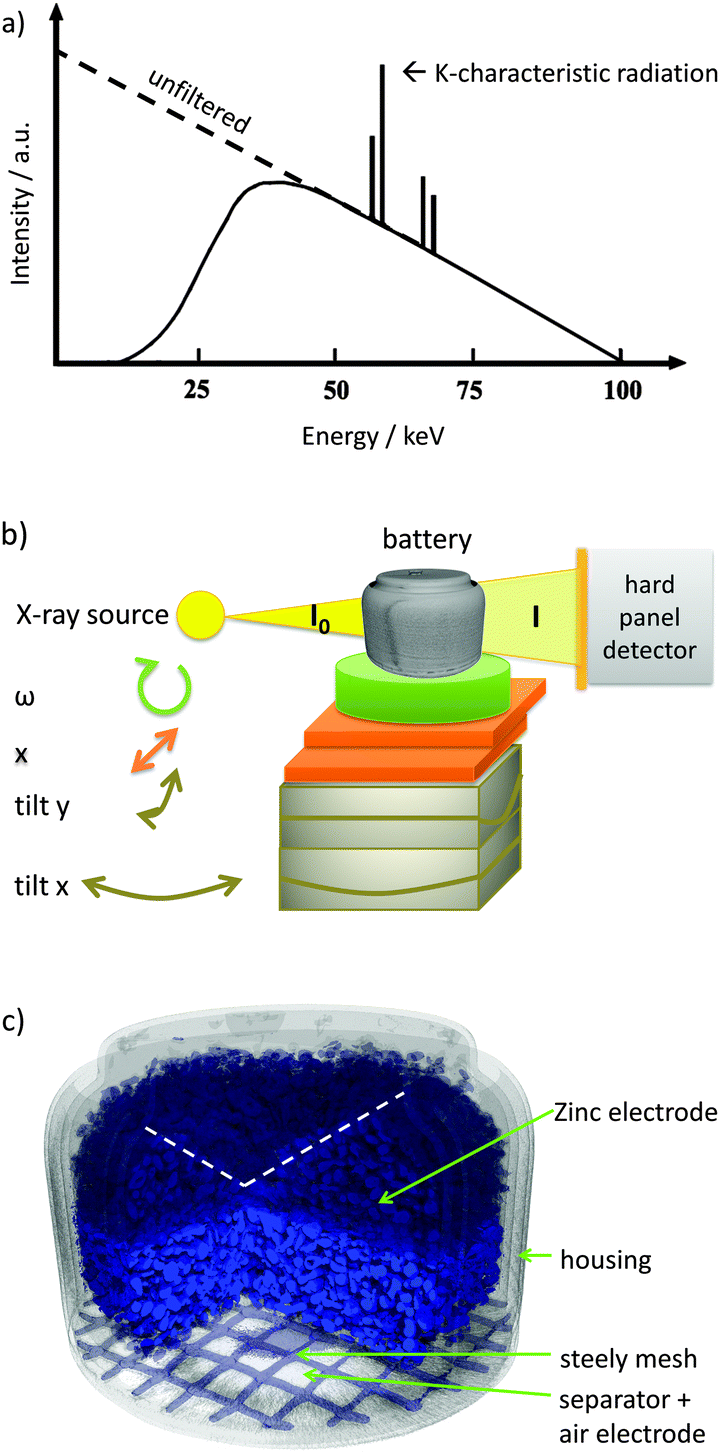 | ||
| Fig. 2 (a) X-ray spectrum at an accelerating voltage of 100 kV of a laboratory X-ray source. The intensity of low energies is decreased by a filter (Cu for this experiment). (b) Experimental set-up: “tilt x” and “tilt y” is used to adjust the rotation axis, x – translation table, ω – rotation table, I0 – initial X-ray beam, I – attenuated X-ray beam, (c) reconstructed volume of the analyzed ZA13 button cell battery. Zinc powder is shown in dark blue. Due to the inhomogeneous filling level of the zinc electrode (white dashed line), porosity calculations presented with Fig. 6e were conducted with the sub volume marked in bright blue. | ||
The reconstruction was done numerically using the well-known filtered back projection which is described in the literature.21,22 In addition to a copper filter, the module for beam hardening correction, implemented in Octopus software, was applied. Here, the logarithmic projections are corrected by a polynomial function that weighs longer attenuation paths in the specimen. The impact of lower energies and shorter attenuation paths respectively is decreased. The applied reconstruction algorithms are standard. For more complex issues, several improved and extended algorithms can be used as described by Stampanoni.23 Such improvements are crucial for high resolved synchrotron tomography which can allow for real time imaging24 of higher spatial resolutions (9 μm per pixel in the presented work, 2 μm elsewhere)25 since the photon flux of the synchrotron beamline is mostly higher than the flux of laboratory X-ray sources.
3. Model description
For the model based analysis in this work, an existing isothermal mathematical model of a secondary zinc air battery with alkaline liquid electrolyte is adapted. A detailed description of this model is given elsewhere.6 We use the ‘relative humidity scenario’ from this reference and modify it to represent the experimentally investigated ZA13 button cell zinc air battery.The model is composed of ordinary differential equations and additional algebraic equations to describe species concentrations for Zn, ZnO, Zincate, OH−, and H2O within the zinc electrode, separator and air electrode. Mass transport is accounted for convention, diffusion and migration of species (Nernst–Planck-equation). Both electrochemical reactions are implemented as sink or source terms and are described with a Butler–Volmer-approach. Chemical equilibrium between zincate and zinc oxide species is assumed, so that zinc oxide precipitates if the solubility limit of zincate in the electrolyte is reached. To account for loss and gain of water during zinc air battery operation due to interaction with the surrounding air, gas liquid equilibrium based on Henry's law is implemented. The applied geometry and initial parameters of the existing model are modified respectively and are shown in Table 1. Not mentioned parameters are as in ref. 6. A temperature of 25 °C was set for all simulations.
| Parameter | Value | Unit | Source |
|---|---|---|---|
| Zinc porosity | 0.5 | — | As in ZA13 1st image |
d
Zn![[thin space (1/6-em)]](https://www.rsc.org/images/entities/char_2009.gif) electrode electrode
|
0.0580 | dm | ZA13 dataset18 |
|
A
Znelectrode
|
2.64 × 10⁻³ | dm2 | Given by dZnelectrode |
| Rel. humidity | 0.65 | — | |
| m Zn | 0.366 | g | Estimated from rated capacity in ZA13 data sheet,18 equivalent to 5.59 × 10⁻⁴ mol |
| m ZnO | 0.050 | g | Assumed, equivalent to 6.15 × 10⁻⁴ mol |
This model approach enables us to conduct transient simulations with different cell geometries and initial parameters such as porosity and electrolyte molarity. As a model output the time-dependent ZA13 battery state with its species concentrations, and cell and electrode overpotentials during battery charge and discharge is obtained. The conducted simulations for the investigated ZA13 button cell type battery are shown schematically with model input and output variables in the flowchart shown in Fig. 3.
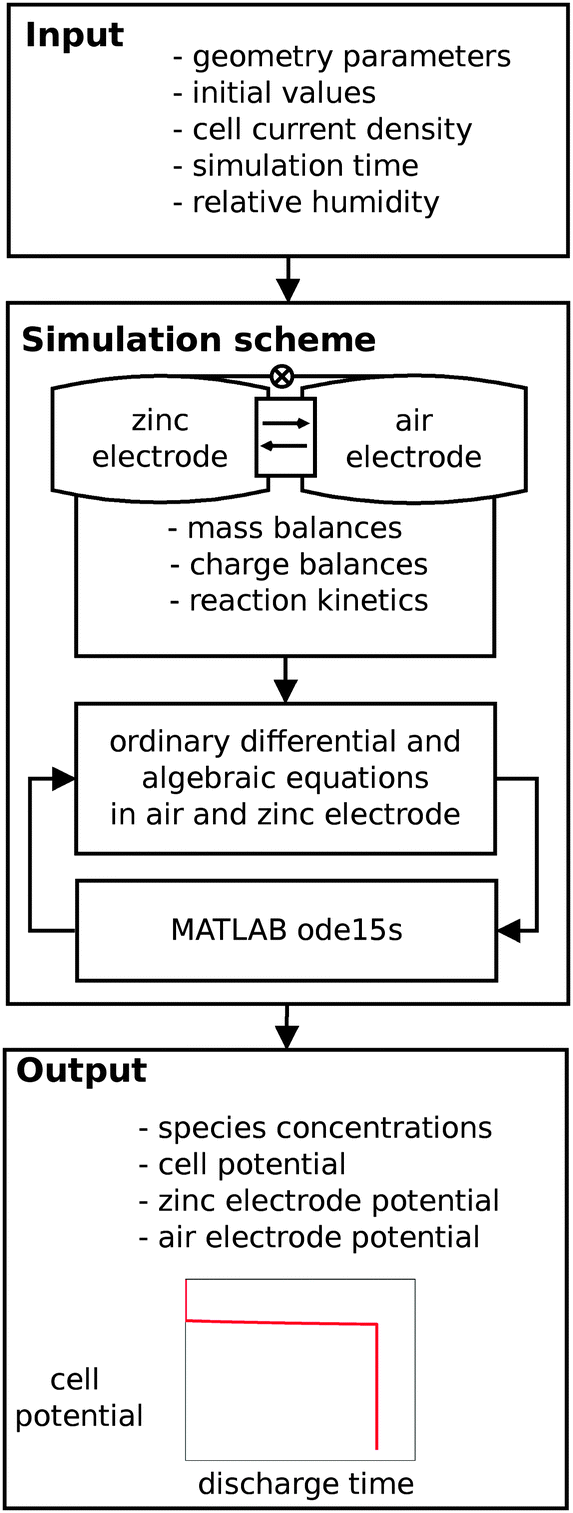 | ||
| Fig. 3 Flowchart of the conducted simulations for the investigated ZA13 button cell type battery with model input and output variables indicated. Computation time with this model approach is in the range of ten seconds (using a standard quad-core office computer). | ||
4. Results
Fig. 4 illustrates the measured discharge characteristic of the investigated battery, including an inset showing the cell potential shortly before and after tomography at 60.6% state-of-charge (SOC).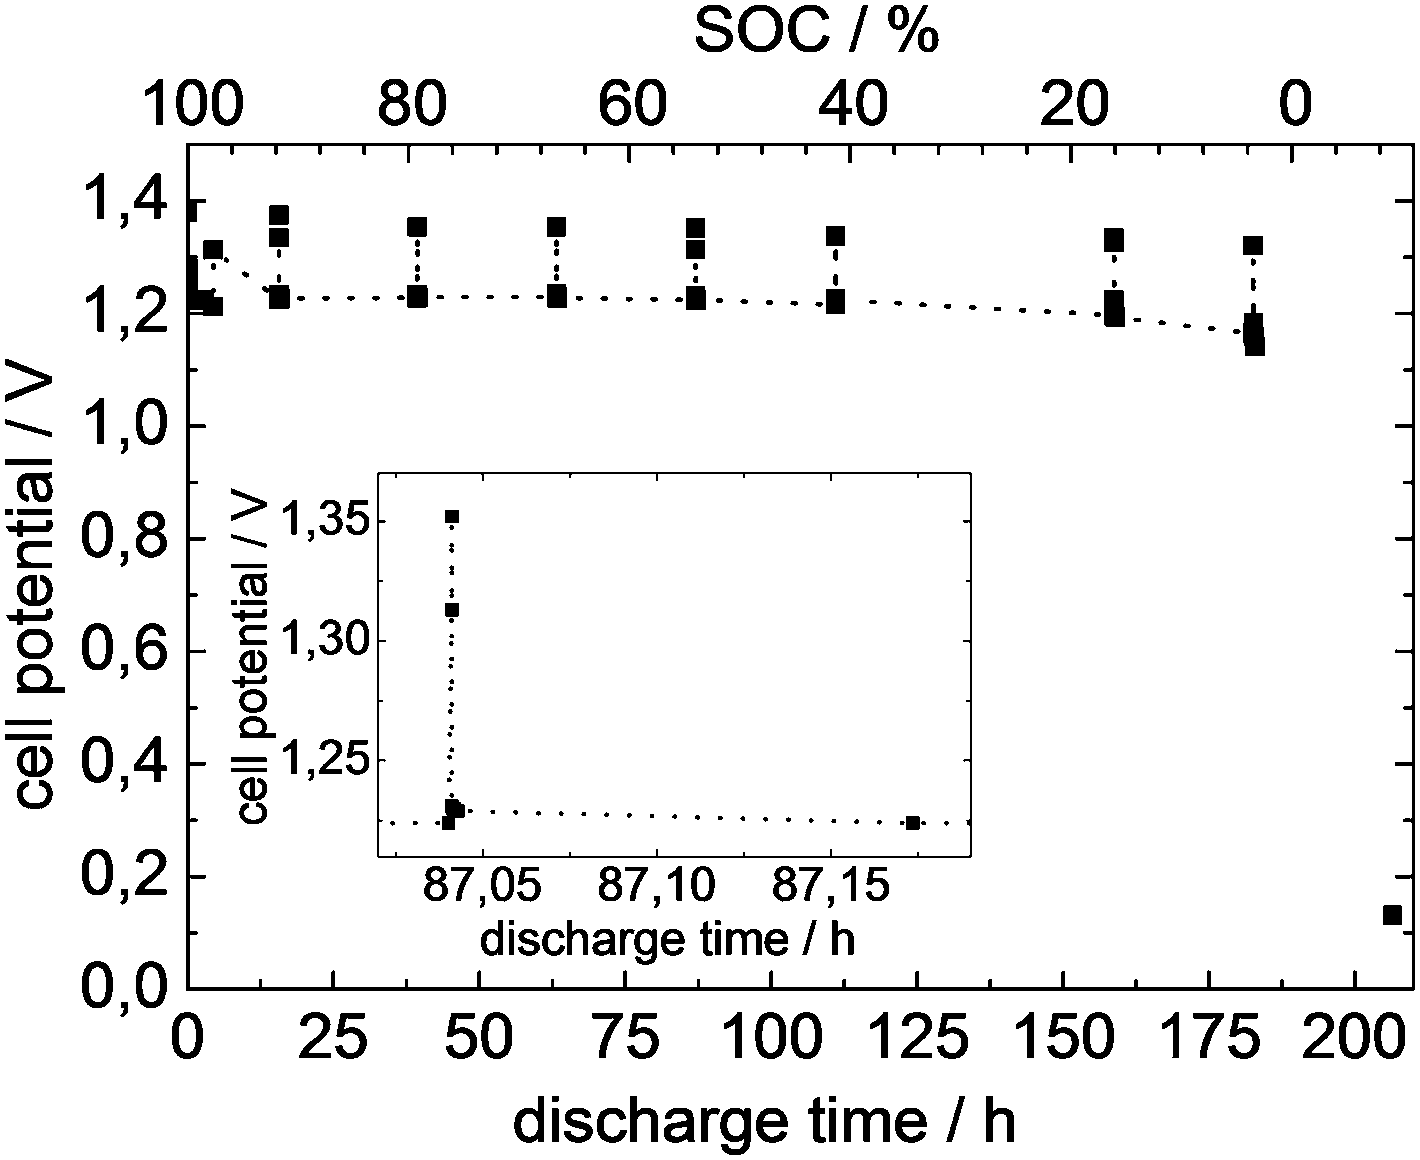 | ||
| Fig. 4 Experimentally measured discharge curve of the investigated zinc air battery. The discharge was stopped for tomographic measurements. Cell potential recovery after tomography is shown for one time step in the inset. | ||
The observed cell potential is almost constant and stays at approximately 1.250 V during the discharge time of 182.40 hours. Since the electrical load was switched off for tomography, cell potential rises to constant open circuit potential before tomography. The electrical load was switched on again after each tomography, resulting in a decrease of cell potential to a similar level as before.
Sectional cutouts of the full battery at different states-of-charge are shown in Fig. 5a. Zinc and the casing are represented by bright gray values, while dark gray values represent the electrolyte. Gas phases are shown in black gray values. Mid-level gray values represent oxidized zinc. The zinc electrode occupies most of the battery volume while the air electrode can be seen as a small stripe between the separator and a wire mesh current collector at the bottom. Almost all particles have been oxidized at 3.8% SOC. Only gas phases (black gray values), oxidized zinc (mid-level gray values) and heavy metal additives such as Bismuth, Mercury and Lead (bright gray values), originating from the initial zinc powder, can be observed below 3.8% SOC inside the zinc electrode. It is shown that zinc particles near the separator have been electrochemically oxidized first. Particles located far from the separator have been electrochemical oxidized at the end of battery discharge. One single particle located near the separator is shown in more detail in Fig. 5c. Here, zinc is shown in gray, oxidized zinc is shown in blue color and additives are shown in red. The oxidation process of zinc and the accompanying volume increase can be observed. Oxidized zinc seems to be dissolved in the electrolyte (appearing as transparent) partly, and is then transported away from its initial place (blue colored “cloud”). Agglomerations of the additives are mainly located at places of zinc particles at 100% SOC.
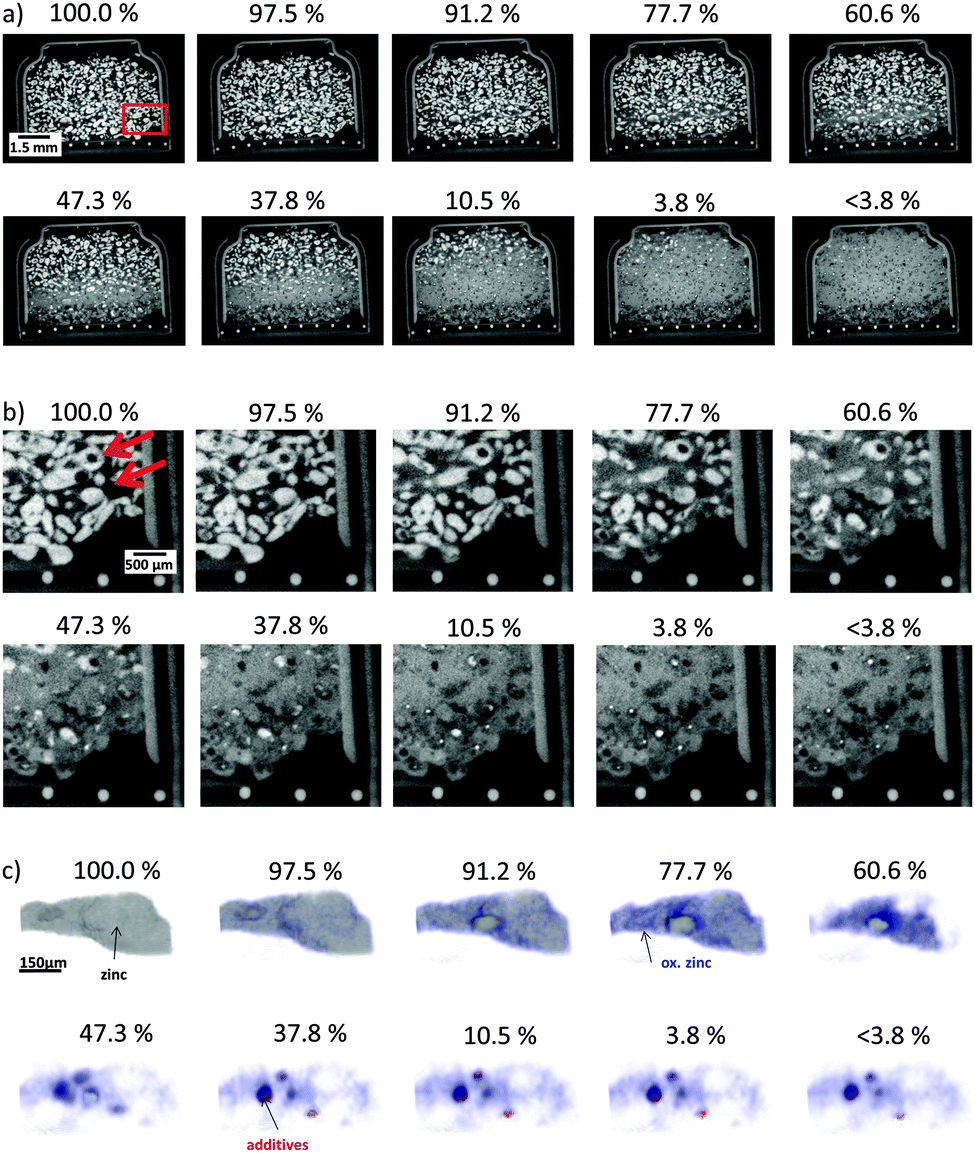 | ||
| Fig. 5 Light gray values represent metals as zinc or battery housing, while air and electrolyte are indicated by dark gray values. (a) Cuts through the battery with decreasing SOC. Zinc oxide formation and volume changes are observable. The area marked with the red rectangle is shown in more detail with (b). (b) Enlargement of the zinc electrode for decreasing SOC. High attenuating phases are formed at former locations of zinc particles. One torus-like particle and one sphere-like particle are highlighted by red arrows. (c) Enlargement of a single zinc particle which is electrochemically converted. | ||
Fig. 5b depicts enlarged insets of Fig. 5a at a location near the battery separator (see red rectangle in Fig. 5a). These images allow for an interpretation of the oxidation process of individual particles in more detail. It can be clearly seen that oxidation starts at the outer surface of the particles. Areas inside the particles are oxidized afterwards. This effect is independent of the previously mentioned effect that particles have been oxidized near the separator first.
Fig. 6f shows the frequency distribution of gray values of the reconstructed zinc electrode. This figure shows the distribution of the gray value frequencies, i.e. the relative volume amount of the different chemical species in dependence of the battery state of charge. With increasing discharge time, a decrease of zinc was found, while the amount of oxidized zinc (partly dissolved in the electrolyte) increases. Even a decrease of gas volume can be observed. These quantitative results confirm the visual impression obtained from Fig. 5(a) and (b).
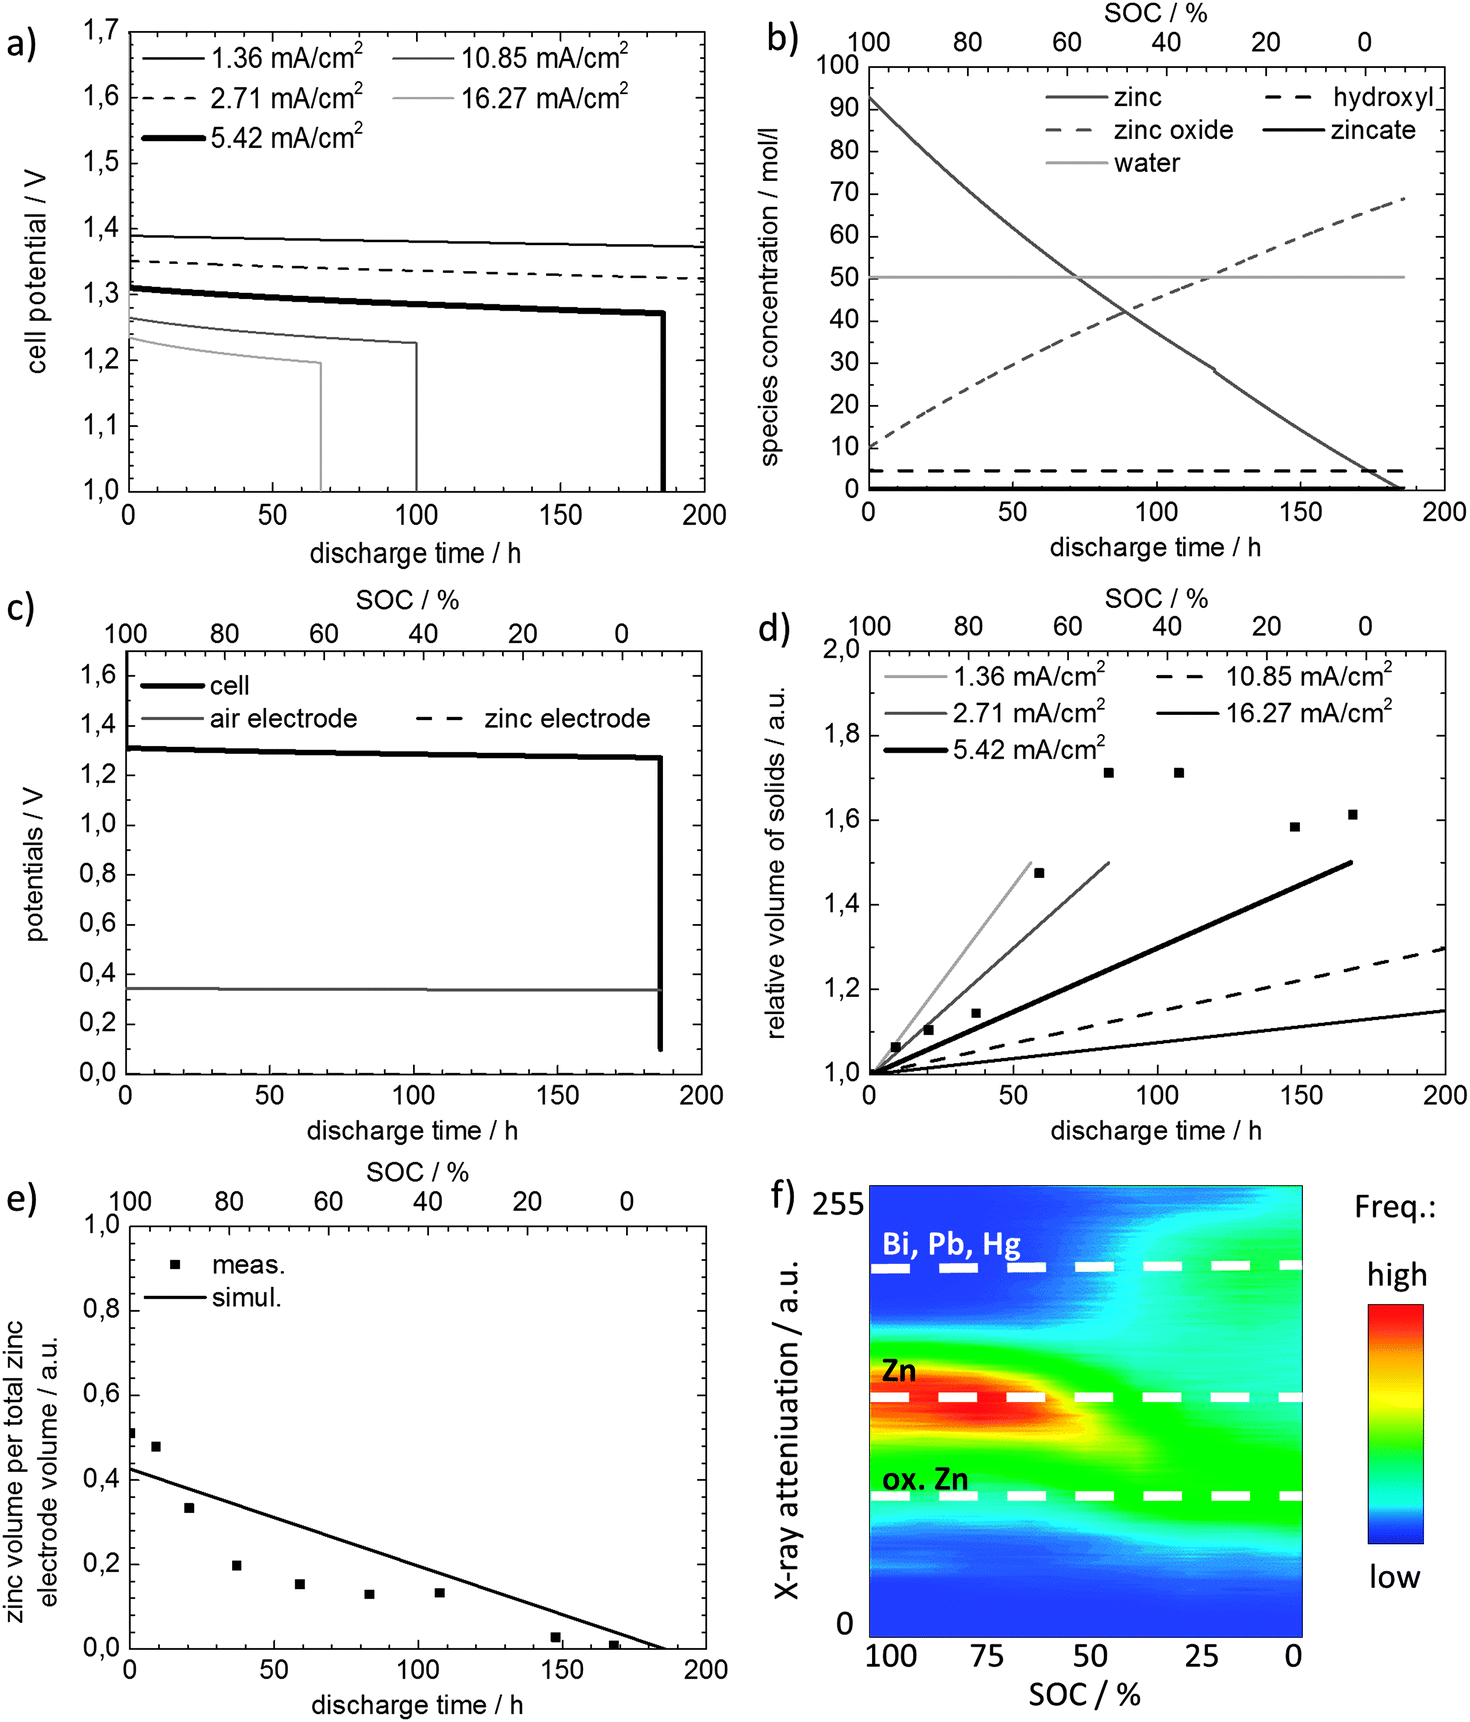 | ||
| Fig. 6 Results of simulation (lines) and measurement (dots). The bold black line resembles simulation results for the same current density as used in the experimental work. (a) Discharge simulation results depicting cell potential for increasing cell current density. (b) Discharge simulation results for a current density of 5.42 mA cm−2, showing the species concentrations during ZA13 discharge. (c) Potentials of the cell and the single electrodes. (d) Relative volume of solids in the zinc electrode for a current density of 5.42 mA cm−2. A more pronounced increase of volume in measured data can be attributed to the applied imaging analysis techniques and particle movements during the tomographic measurement. (e) Relative amount of zinc volume in the zinc electrode. (f) x-Axis: discharge state of the battery, y-axis: attenuation coefficient, whereas air possesses a value of approximately zero. | ||
Fig. 6a illustrates the simulated cell potential for increasing discharge time at various discharge current densities. It can be observed that, as in the experimentally obtained discharge curve shown in Fig. 4, the progression of cell potential is flat and decreases rapidly if discharge time is close to end-of-life. For the discharge with 5.42 mA cm−2 (bold black line), cell potential progresses from 1.310 V to 1.270 V, where a maximal discharge time of 166.70 h is obtained. Lower or higher applied current densities extend or diminish the maximal achievable discharge time, respectively. In addition, cell potential becomes higher for low current densities and lower for high current densities, respectively. This trend is in line with results from other experimental studies.26,27
Fig. 6(b) and (c) elucidate additional information about the electrode potentials and species concentrations. Fig. 6b depicts the species concentrations in the zinc electrode during discharge. The concentration of solid zinc in the electrode decreases in a non-linear way and approaches zero, whereas the concentration of solid zinc oxide increases respectively with discharge time. In addition, the hydroxide concentration and water concentration can be observed as constant. For long term and stable operation it is crucial to know these concentration values as drying out of the battery might occur, especially if zinc air batteries are meant to be operated as a secondary battery with longer operation times.6 Whereas imaging is limited in answering which species is present, the presented simulation results enable the determination of the ratio of species in the zinc electrode during battery discharge. Furthermore, Fig. 6c gives further information on each electrode overpotential during discharge. In detail, the overpotential at the air electrode is much higher than other polarization losses and impacts the cell potential at the set current of 5.42 mA cm−2. During battery discharge, a slight increase of the zinc electrode overpotential as well as a slight increase of the air electrode overpotential can be observed. This implies that the change in SOC causes a change in the amount of electrolyte in the zinc electrode and consequently has an impact on the flooding of the air electrode and its overpotential, which is also observed by other experimental findings.26
Fig. 6e gives a comparison between simulated (a) and measured (b) zinc volume in the zinc electrode. The amount of solid zinc decreased for both methods, whereas it decreased linearly for the simulation results shown in Fig. 6e. The figure additionally shows the experimentally determined relative zinc volume in the zinc electrode, evaluated by means of the relative frequency of gray values (shown as symbols). This information can be seen as free void volume in the zinc electrode structure. At a SOC of 100%, the free void volume is 0.5 and at the end of battery discharge, it approaches zero as zinc has been nearly completely electrochemically oxidized.
Fig. 6d shows the total solid volume obtained by simulation. Simulation results are shown for several current densities, whereas the highest current density applied, yields the highest relative volume of solids after complete discharge of the battery. The solid volume measured inside the zinc electrode, including zinc and zincate volumes, is also depicted in Fig. 6d. Compared to the volume changes achieved by the conducted simulations, deviations are observable. However, both techniques show comparable trends. The relative volume of solids increases up to 50% for the simulation data and up to 60% for the experimental data. This implies a more pronounced increase for the volume of solids for the experimental method. Some measuring points around 60–110 h discharge time even show higher relative solid volumes up to 70%. This can be caused by imaging artifacts as beam hardening or varying the signal-noise-ratio which can cause problems with binarisation. Furthermore, particle movement due to volume increase cannot be completely neglected and corrected.
5. Discussion
Both experimentally obtained and model-based results comply well with each other. However, some differences are observable. In particular, the simulated cell potential is marginally higher than in the obtained experimental discharge curve at 5.42 mA cm−2. This is most likely due to the usage of kinetic parameters fitted to perovskite-type catalyst,6 whereas in the investigated ZA13 the air electrode catalyst is different, most likely MnO2-based. Nevertheless, the simulated discharge curves in Fig. 6c are well in line with the experimentally determined discharge profile.The deviation of the total discharge times obtained with simulation and experiments of approximately 16 hours (see Fig. 4 and 6c), resulting in a difference of discharge capacity of approximately 30 mA h, can be explained by the fact that the button cell was operated rheostatically, whereas the simulations were conducted with galvanostatic discharge. Another reason can be observed in the upper region of a cut through the battery at an SOC of 3.8 w% in Fig. 5a: some zinc particles are not utilized. They are, contrary to the assumptions of the model, not completely oxidized during battery discharge. Consequently, a flatter decay of cell potential was observed in the experiment leading to a longer possible operation time.
Based on spatially resolved experimental data, preferential locations in the electrode for the oxidation of zinc particles are apparent. The observations can be explained by a shrinking-core-concept. As shown in Fig. 5b, zinc particle oxidization starts from the outer particle surface, while inner parts of the particles are oxidized subsequently. This corresponds adequately to a shrinking-core-concept which is described by Levenspiel and Guria.28,29 A sketch for the experimentally observed mechanism for sphere-like and torus-like particles is given in Fig. 7. Both shapes schematically represent typical particle shapes which can be found in the analyzed battery (see Fig. 5b). Zinc particles for the completely charged battery state are shown in Fig. 7(a) and (c). A thin oxidation layer around zinc particles at the start of the discharge experiment cannot be excluded completely. Such an oxidation layer can be formed during battery or zinc powder fabrication if the manufacturing is done under atmospheric conditions. Fig. 7(b) and (d) show particles in partly discharged zinc electrodes. These schematic drawings are used to explain two different effects:
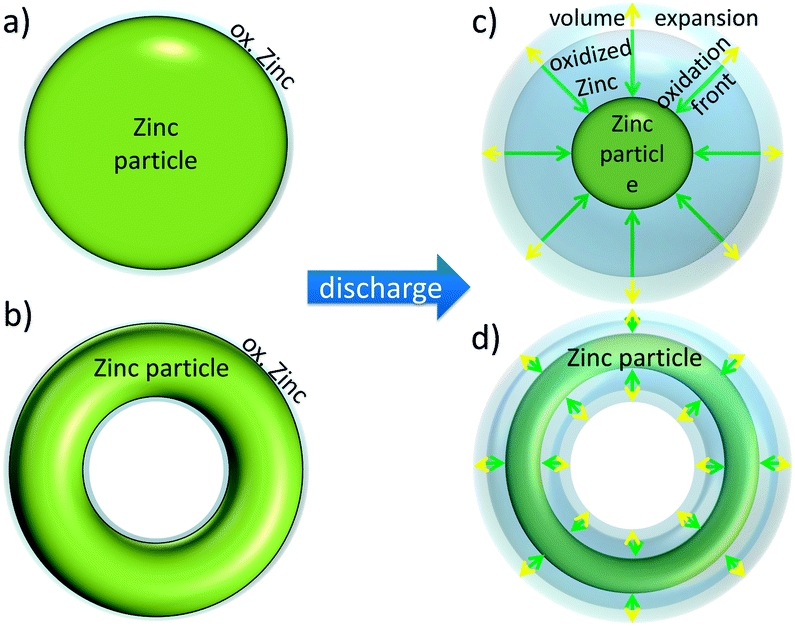 | ||
| Fig. 7 Shrinking-core-concept for zinc oxidation during battery discharge for (a) and (c) sphere-like zinc particles and (b) and (d) torus-like particles. (a) and (b) represent particles in a fully charged battery while (c) and (d) represent particles in a partly discharged battery (at a SOC of around 60% in our measurements, see Fig. 5). Oxidation front (green arrows) starts at the particle surface, while volume changes due to the higher density of oxidized zinc are indicated by yellow arrows. | ||
• Zinc oxidation: as described by the shrinking-core-concept, oxidation takes place at all outer surfaces of a particle. This also includes the inner surface of the torus-like particles. Thus one obtains a very broad oxidation front, which is marked by green arrows in Fig. 7. This oxidation ideally proceeds until all zinc particles are completely oxidized as shown in Fig. 5.
• Volume expansion: volume changes are a direct effect of the zinc oxidation, since the mass density of zinc and zinc oxide is 7.14 g cm−3 and 3.05/5.61 g cm−3 (Zn(OH)42−/ZnO), respectively. Assuming a constant molar amount of zinc, the material volume inside the zinc electrode increases during battery discharge. Taking solely solid volume into account, the density is 4.46 g cm−3. This implies a mixed state, consisting of ZnO and ZnOH42− under discharged battery conditions.
As mentioned above, oxidation and volume changes will ideally proceed until all zinc atoms are electrochemically oxidized. This is not given by the presented thoughts on the shrinking-core-concept in Fig. 7, but was experimentally investigated in Fig. 5. For this reason the battery was discharged further without the potential limit for several hours. A cell potential of 0.131 V was measured at the end of discharge (corresponding to <3.8% SOC). This condition does not reflect common operation conditions of zinc air batteries, as the battery is not designed for lower cell potential than 0.9 V by the manufacturer.18 However, it gives an impression of the material distribution and its composition inside the battery near its end-of-life. Only small amounts of non-oxidized zinc can be found in the upper part of the zinc electrode, located farthest from the separator. They are separated from the bulk and have either no electrical connection or no contact with the electrolyte. Consequently, they were not oxidized.
Experimentally obtained and model-based volume changes are consistent with each other. An increase of about 20% to 25% is observable for both applied methods. As shown in Fig. 6(d) and (e), values obtained from tomographic measurements and from simulation fit well with each other. Using X-ray tomography, an unambiguous distinction between zinc and oxidized zinc can be carried out if the size of oxidized zinc particles is above the resolution limit (here: 9 μm per pixel). As shown in Fig. 6b relative amounts of zinc can be predicted by the simulation. On the other hand, higher spatial resolution for model-based predictions would require far more complex 1D–1D (1D along the battery and 1D in particle direction) models as commonly applied in Li-ion batteries. Tracing particle dissolution over time, as depicted in Fig. 5a, is easily observable with tomographic measurements.
As both imaging and simulation complement each other for same battery operation parameters like temperature, current density, zinc amount and battery dimensions, further operation states can be simulated in order to investigate extreme operating conditions. Fig. 6d presents the zinc volume as a function of SOC for several current densities. Comparable tomographic experiments, as for different current densities or cycling, would be time consuming; simulations pave the way for future virtual material and cell designs.
6. Conclusions
A button cell zinc air battery of type ZA13 was analyzed by a combination of in operando X-ray tomography during discharge and battery discharge simulations. Both experimentally obtained and model-based results comply mostly well with each other. The combination of the introduced in operando X-ray investigations and conducted simulations gives detailed insights into the processes occurring during discharge of zinc air batteries. In summing up, the main results and their implications are as follows:• Combining both X-ray imaging and model-based analysis helps to gain further knowledge on structural properties of zinc air batteries at the electrode level.
• During battery discharge, zinc particles are electrochemically oxidized near the separator first. Particles located far from the separator have been electrochemically oxidized at the end of battery discharge.
• Volume changes at the zinc electrode due to zinc oxidation can be traced by X-ray imaging methods as well as by the conducted simulations with a customized mathematical battery model. The simulation results obtained with the presented model fit well with experimental results. A relative increase of solid volume in the zinc electrode by a factor of 1.5 was found by simulation, while tomographic measurements showed a relative increase of 1.6 after discharge. Deviations of the cell potential for simulation and experiment are approximately 7%.
• Experimentally observed volume changes and zinc oxidation were successfully explained by using a shrinking-core-concept. Two classes of particle shapes were found in the zinc electrode: sphere-like and torus-like particles. It is shown that oxidation of zinc particles does not take place inside zinc particles but at their outer surfaces. Thus, we assume the build-in zinc particles to be non-porous, or alternatively, the porosity does not allow for penetration of electrolyte into the zinc and zinc-oxide-particles.
• The density of the increased solid volume (zinc and oxidized zinc) at 3.8% SOC was 4.41 g cm−3 corresponding to a mixed state of ZnO and ZnOH42−.
• Model-based simulations help to gain further information during battery discharge like electrode overpotentials and species concentration distributions; they are a valuable supplement accompanying imaging methods which allows for a spatial resolved analysis of material distribution and material composition.
For successful application of zinc air batteries in the nearby future, for example in automotive applications, further investigations on zinc electrode structures are needed. Application of zinc air batteries, especially as a secondary battery, can benefit in various ways from the here introduced combination of methods.
References
- E. Linden, Handbook of Batteries, Mcgraw-Hill Professiona, 4th edn, 2011, ch. 13, p. 17 Search PubMed.
- O. Haas, S. Müller and K. Wiesener, Chem. Ing. Tech., 1996, 68(5), 524–542 CrossRef CAS PubMed.
- E. Linden, Handbook of Batteries, Mcgraw-Hill Professiona, 4th edn, 2011, ch. 13, p. 22 Search PubMed.
- Y. Li, M. Gong, Y. Liang, J. Feng, J.-E. Kim, H. Wang, G. Hong, B. Zhang and H. Dai, Nat. Commun., 2013, 4, 1805, DOI:10.1038/ncomms2812.
- U. Krewer, Chem. Ing. Tech., 2011, 83(11), 1974–1983 CrossRef CAS PubMed.
- D. Schröder and U. Krewer, Electrochim. Acta, 2014, 117, 541–553 CrossRef PubMed.
- S. Müller, F. Holzer and O. Haas, J. Appl. Electrochem., 1998, 28, 895–898 CrossRef.
- Y. Takeshita, S. Fujimoto and M. Sudoh, ECS Trans., 2013, 50, 3–12 CrossRef CAS PubMed.
- P. Arora and Z. J. Zhang, Chem. Rev., 2004, 104(10), 4419–4462 CrossRef CAS.
- H. Yang, J. Power Sources, 2004, 128(1), 97–101 CrossRef CAS PubMed.
- S. Müller, K. Striebel and O. Haas, Electrochim. Acta, 1994, 39(11/12), 1661–1668 CrossRef.
- S. H. Lee, Y.-J. Jeong, S.-H. Lim, E.-A. Lee, C.-W. Yi and K. Kim, J. Korean Electrochem. Soc., 2010, 13(1), 45 CrossRef CAS.
- S. Siahrostami, V. Tripković, K. T. Lundgaard, K. E. Jensen, H. Hansen, J. S. Hummelshøj and J. Rossmeisl, Phys. Chem. Chem. Phys., 2013, 15(17), 6416–6421 RSC.
- M. M. Britton, P. M. Bayley, P. C. Howlett, A. J. Davenport and M. Forsyth, J. Phys. Chem. Lett., 2013, 4, 3019 CrossRef CAS PubMed.
- M. Ebner, F. Marone, M. Stamponi and V. Wood, Science, 2013, 342, 716–720 CrossRef CAS PubMed.
- C. Hoch, H. Schier, C. Kallfaß, C. Tötzke, A. Hilger and I. Manke, Micro Nano Lett., 2012, 7, 262 Search PubMed.
- F. Wieder, C. Kallfaß, I. Manke, A. Hilger, C. Tötzke, C. Hoch, H. Schier, K. Graf and J. Banhart, ECS Trans., 2013, 53, 211 CrossRef CAS PubMed.
- Data sheet, http://www.produktinfo.conrad.com/datenblaetter/650000-674999/650496-da-01-en-HOERGERAETEBATTERIEN_ZINK_LUFT_ZA13.pdf, accessed: June 2014.
- Data sheet, http://www.produktinfo.conrad.com/datenblaetter/100000-124999/124501-an-01-ml-VC250_sl_sv_ba_hu_sk.pdf, accessed: June 2014.
- Octopus, version 6.5, University of Ghent, Ghent, Netherlands, 2013, http://www.inct.be/en/software/octopus, accessed: June 2014 Search PubMed.
- M. Dierick, B. Masschaele and L. Van Hoorebeke, Meas. Sci. Technol., 2004, 15, 1366–1370 CrossRef CAS.
- A. C. Kak and M. Slaney, Principles of Computerized Tomographic Imaging, IEEE Press, 1988 Search PubMed.
- M. Stampanoni, A. Groso, A. Isenegger, G. Mikuljan, Q. Chen, A. Bertrand, S. Henein, R. Betemps, U. Frommherz, P. Böhler, D. Meister, M. Lange and R. Abela, Proc. SPIE, 2006, 6318, 63180M CrossRef PubMed.
- F. Marone and M. Stampanoni, J. Synchrotron Radiat., 2012, 19, 1029–1037 CrossRef CAS PubMed.
- J. Haußmann, H. Markötter, R. Alink, A. Bauder, K. Dittmann, I. Manke and J. Scholta, J. Power Sources, 2013, 239, 611–622 CrossRef PubMed.
- D. Schröder, T. Arlt, I. Manke and U. Krewer, Electrochem. Commun., 2014, 40, 88–91 CrossRef PubMed.
- E. Deiss, F. Holzer and O. Haas, Electrochim. Acta, 2002, 47(25), 3995–4010 CrossRef CAS.
- O. Levenspiel, Chemical Reaction Engineering, John Wiley & Sons New York, New York, 2nd edn, 1972, p. 361 Search PubMed.
- C. Guria and M. Chanda, Trans. Inst. Chem. Eng., 1994, 72, 503 CAS.
Footnote |
| † Electronic supplementary information (ESI) available. See DOI: 10.1039/c4cp02878c |
| This journal is © the Owner Societies 2014 |