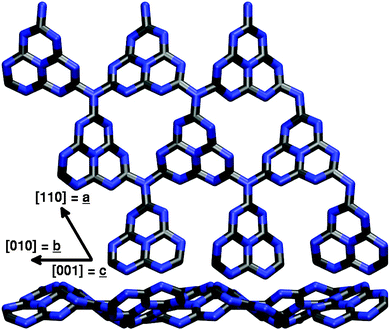
 Open Access Article
Creative Commons Attribution 3.0 Unported Licence
Adsorption and photocatalytic splitting of water on graphitic carbon nitride: a combined first principles and semiempirical study
Jonas
Wirth
*a,
Rainer
Neumann
a,
Markus
Antonietti
b and
Peter
Saalfrank
a
aUniversity of Potsdam, Institute of Chemistry, Karl-Liebknecht-Straße 24-25, 14476 Potsdam, Germany. E-mail: jowirth@uni-potsdam.de
bMax-Planck Institute of Colloids and Interfaces, Research Campus Golm, Am Mühlenberg 1, 14476 Potsdam, Germany
First published on 25th June 2014
Abstract
Graphitic carbon nitride, g-C3N4, is a promising organic photo-catalyst for a variety of redox reactions. In order to improve its efficiency in a systematic manner, however, a fundamental understanding of the microscopic interaction between catalyst, reactants and products is crucial. Here we present a systematic study of water adsorption on g-C3N4 by means of density functional theory and the density functional based tight-binding method as a prerequisite for understanding photocatalytic water splitting. We then analyze this prototypical redox reaction on the basis of a thermodynamic model providing an estimate of the overpotential for both water oxidation and H+ reduction. While the latter is found to occur readily upon irradiation with visible light, we derive a prohibitive overpotential of 1.56 eV for the water oxidation half reaction, comparing well with the experimental finding that in contrast to H2 production O2 evolution is only possible in the presence of oxidation cocatalysts.
1 Introduction
In recent years graphitic carbon nitride of the approximate composition C3N4 has attracted broad attention due to its promising electronic properties.1,2 Being an electron rich organic semiconductor with an experimental band gap of 2.7 eV, graphitic carbon nitride (g-C3N4) has been found to drive a variety of photo-catalytic redox reactions such as water3,4 and CO2 (ref. 5) reduction, alcohol oxidation and oxidative dehydrogenation of amines.6 At the same time the material is relatively easy to prepare, inexpensive and of high mechanical, thermal and chemical stability,1 rendering g-C3N4 a promising catalyst for large-scale applications.In this context one major advantage of graphitic carbon nitride as compared to conventional catalysts is being metal-free and therefore tolerating chemical functionality in reactant molecules.2 Still, the catalytic rates for most reactions are rather low if pure g-C3N4 is used. It can be increased by adding cocatalysts such as platinum for water reduction4 which sacrifices, however, some of the material's before-mentioned advantages. In a different approach the material itself was modified, e.g. by doping with heteroatoms such as fluorine or sulfur or via copolymerization with barbituric acid, significantly raising H2 production rates (see ref. 1, 7 and references therein). To further improve the material properties in a systematic manner, however, a microscopic understanding of g-C3N4 photocatalysis is crucial.
Being of potential technological interest in the context of “green” energy conversion and storage and at the same time being “simple” enough, the photocatalytic water splitting reaction is a natural starting point for a theoretical approach to photocatalysis on graphitic carbon nitride. As estimated from photoelectrochemical studies and density functional theory (DFT) band structure calculations for g-C3N4,1,8 its valence and conduction bands seem to perfectly engulf the redox potentials of both water splitting half reactions according to eqn (1) and (2) (see Fig. 1). Therefore, in principle and purely following these energetic arguments, graphitic carbon nitride should be able to catalyze both H2O oxidation and H+ reduction independently and without any help of additional reagents:
| 2H2O → O2 + 4H+ + 4e− | (1) |
| 4H+ + 4e− → 2H2 | (2) |
In practice, however, a sacrificial electron donor (e.g. triethanolamine) is needed for H2 production and an electron acceptor such as AgNO3 for water oxidation, respectively,3,4 to avoid recombination of intermediates (otherwise spatial separation of anodic and cathodic reaction would be required). Additionally, both half reactions are subject to an intrinsic overpotential increasing the effective (photo-generated) potential bias needed for the individual half reaction to take place. In fact, the water oxidation reaction seems to suffer from a very high overpotential preventing the reaction to proceed without help of additional cocatalysts.3,4
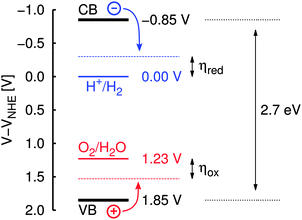 | ||
| Fig. 1 Schematic illustration of band positions in g-C3N4 (at pH = 7) relative to the normal hydrogen electrode (NHE) as given in ref. 8. VB/CB: valence/conduction band; ηox/ηred: overpotential for water oxidation/H+ reduction. | ||
Accordingly, two major steps towards a microscopic picture of g-C3N4 photocatalysis are:
1. Understanding the microscopic interaction between catalyst, reactants and products which contribute to observable overpotentials.
2. Understanding charge separation, localization and exciton lifetime in graphitic carbon nitride.
The focus of this article is on the first point, especially on the question of water adsorption as a prerequisite for photocatalytical water oxidation. Different graphitic carbon nitride surfaces were studied systematically in terms of the adsorption of water molecules on variable surface terminations. Subsequently, a four-step mechanism for the photocatalytic water oxidation reaction, previously applied to transition metal oxide surfaces, was adopted and the corresponding overpotential was derived by means of first principles thermodynamics; for comparison, a similar approach was set up for H+ reduction, as well.
The article is organized as follows: After this introduction the applied methodology will be explained, followed by a detailed account on the studied model systems (Section 2). In Section 3 first the water adsorption on two different surface terminations will be discussed, subsequently the overpotentials for the two water decomposition half reactions on a carbon nitride substrate will be derived using a thermodynamic model. Finally, the findings of this account will be summarized and further steps towards a detailed understanding of g-C3N4 photocatalysis will be proposed.
2 Models and methods
2.1 Computational details
To allow for the study of different structural patterns including not only two-dimensional but also multilayer periodic models, a combined first-principles and semiempirical approach was chosen. Gradient-corrected density functional theory (DFT) was used for the purpose of benchmarking and for obtaining quantitative results, complemented by density functional based tight-binding (DFTB) calculations for gaining more qualitative information on the basis of extended models and otherwise inaccessible geometries.Periodic first-principles total energy calculations were performed within the framework of Kohn–Sham DFT9 using the projector augmented wave (PAW) approach10,11 as implemented in the Vienna ab initio simulation package (VASP).12–14 Electron exchange and correlation were treated within the generalized gradient approximation (GGA) using the PBE functional.15,16 Total energies were corrected for dispersion interaction by applying Grimme's semiempirical D3 scheme17 with the damping function for short interatomic distances according to Becke and Johnson (see ref. 18 and references therein). In case of radical species involved in the model description of water decomposition on the substrate, spin-polarized calculations were performed.
After systematic convergence studies, total and adsorption energies were found to be sufficiently accurate using a plane-wave basis set truncated at an energy cutoff of 400 eV and a Γ-point centered (3 × 3 × 1) Monkhorst–Pack grid19 (resulting in a set of 5 irreducible k-points) for sampling the Brillouin zone of the hexagonal supercell. Self-consistent field convergence was considered sufficient for a total energy difference of less than 10−4 eV between iterations; ionic relaxation was stopped when the forces acting on ions dropped below 0.01 eV Å−1.
To treat larger systems, semiempirical DFTB calculations were performed using the DFTB + package.20 A self-consistent charge (SCC) approach was chosen to account for possible asymmetric charge distributions using the B3LYP/6-31G* parametrization according to Elstner and coworkers;21 dispersion forces were included by introducing pair-wise interatomic potentials of the Lennard-Jones type with parameters taken from the Universal Force Field (UFF)22 and a damping scheme for short interatomic distances.23 To sustain consistency with first-principles calculations in case of periodic calculations, the Brillouin zone of the hexagonal supercell was also sampled using a Γ-point centered (3 × 3 × 1) Monkhorst–Pack grid. SCC convergence was found to be ensured for a limit of 10−5e difference for any charge between two consecutive cycles; ionic relaxation was stopped when every individual force component dropped below 0.005 eV Å−1.
Both in DFT and SCC-DFTB optimizations all atoms were free to move unless stated otherwise. This also applies for normal mode analysis, i.e. diagonalization of the dynamical (Hessian) matrix; energy derivatives with respect to the nuclear coordinates were evaluated numerically using centered finite differences. To reduce the computational effort, vibrations were obtained at the Γ-point only. This approximation is justified by the large unit cell on the one hand, on the other hand enthalpy contributions due to phonon dispersion will cancel out by a large extent, since we are mainly interested in free energy differences.
2.2 Thermodynamics and photoelectrochemistry
The adsorption energy for any adsorbate species A was evaluated as the energy difference| ΔEads = E*A − (E* + EA), | (3) |
Free energies G(T) = E + H(T) − TS(T), with E denoting the self-consistent field energy for a given species, were calculated including all relevant finite temperature contributions to enthalpy H(T) and entropy S(T), i.e. vibration, rotation and translation for gas phase species; for adsorbed species only vibrational contributions were considered since rotational and translational motions become frustrated. The individual contributions were calculated following standard procedures as outlined in ref. 24.
The water-splitting reaction was modelled according to an approach originally used by Nørskov and coworkers to clarify the origin of the overpotential for oxygen reduction on a platinum (111) surface.25 The method was later also applied to water oxidation on different metal oxide surfaces.26–28 In this approach the overall anodic reaction according to eqn (1) is decomposed into four one-electron steps A–D, each one providing a proton and an electron:
| A: * + H2O → *OH + H+ + e−, | (4) |
| B: *OH → *O + H+ + e−, | (5) |
| C: *O + H2O → *OOH + H+ + e−, | (6) |
| D: *OOH → * + O2 + H+ + e−. | (7) |
For each reaction step the free energy difference under influence of finite pH and a potential bias U can be written as follows:26–28
| ΔGA = G*OH + ½GH2 − GH2O − G* − ΔpH − eU, | (8) |
| ΔGB = G*O + ½GH2 − G*OH − ΔpH − eU, | (9) |
| ΔGC = G*OOH + ½GH2 − GH2O − G*O − ΔpH − eU, | (10) |
| ΔGD = G* + ½GH2 − GO2 − G*OOH − ΔpH − eU. | (11) |
Here, the free energy of H+ and e− has been replaced by ½GH2 considering the reaction ½H2 → H+ + e− at standard conditions of pressure and temperature. Furthermore, an overall shift of the free energy is imposed on every reaction step to include both the pH dependence of the redox potential (ΔpH = kBT![[thin space (1/6-em)]](https://www.rsc.org/images/entities/char_2009.gif) ln(10)·pH) as well as a potential bias due to a light-induced exciton and/or external potential (−eU). All thermochemistry data was obtained for T = 300 K; the translational finite-temperature contribution to the free energy of H2O was calculated at the equilibrium pressure of 0.035 bar to simulate liquid water, whereas GO2 and GH2 were calculated at 1 bar. Note, that (in contrast to ref. 27 for example) the free energy difference for the water decomposition reaction H2O → 0.5O2 + H2 was not fixed at the experimental value here; thus, only DFT-derived free energies enter the equations and support a consistent description of thermodynamics.
ln(10)·pH) as well as a potential bias due to a light-induced exciton and/or external potential (−eU). All thermochemistry data was obtained for T = 300 K; the translational finite-temperature contribution to the free energy of H2O was calculated at the equilibrium pressure of 0.035 bar to simulate liquid water, whereas GO2 and GH2 were calculated at 1 bar. Note, that (in contrast to ref. 27 for example) the free energy difference for the water decomposition reaction H2O → 0.5O2 + H2 was not fixed at the experimental value here; thus, only DFT-derived free energies enter the equations and support a consistent description of thermodynamics.
Similarly, the cathodic H+ reduction half reaction can be decomposed into two one-electron steps E and F, each consuming a proton and an electron:
| E: * + H+ + e− → *H, | (12) |
| F: *H + H+ + e− → * + H2. | (13) |
Or, assuming the involvement of another water molecule:
| E′: *H2O + H+ + e− → *H3O, | (14) |
| F′: *H3O + H+ + e− → *H2O + H2. | (15) |
Accordingly, the free energy difference under influence of finite pH and a potential bias U can be written as
| ΔGE = G*H − G* − ½GH2 − ΔpH − eU, | (16) |
| ΔGF = G* + GH2 − G*H − ½GH2 − ΔpH − eU, | (17) |
| ΔGE′ = G*H3O − G*H2O − ½GH2 − ΔpH − eU, | (18) |
| ΔGF′ = G*H2O + GH2 − G*H3O − ½GH2 − ΔpH − eU, | (19) |
It should be noted that in this approach no explicit photoexcitation is described but the effect of photo-generated electrons is included via the shift of the individual reaction free energies by −eU. In ref. 27 the notion that the difference between the potential of a hole in the valence band of the catalytic substrate and the redox potential for O2 evolution is basically the driving force for photocatalytic water oxidation was used to decide whether or not the reaction will proceed spontaneously upon irradiation of the sample. This can be done by testing if each step in the free energy profile according to eqn (8) to (11) is downhill under the influence of the potential of a hole in the substrate valence band or, alternatively, by comparing the free energy of this hole with the reaction free energy of the water splitting reaction plus its associated overpotential. The latter is given by the difference between the potential needed for the overall reaction to be energetically neutral and the one causing every individual reaction step to be downhill in energy.
2.3 Structural models
Different g-C3N4 structural models with increasing complexity were set up for this study. All of them are based on the tri-s-triazine 4 building block that is believed to form from melamine 3 at around 390 °C in the thermal synthesis of graphitic carbon nitride starting from cyanamide 1 or dicyandiamide 2 (see ref. 2 and Fig. 2). The resulting tri-s-triazine based pattern 5 was shown to be thermodynamically more favourable than other possible triazine based g-C3N4 allotropes, both by plane-wave DFT within the local density29 and generalized gradient approximations,30 as well as by using a localized Gaussian-type basis in combination with the B3LYP hybrid functional.31 Furthermore, tri-s-triazine based g-C3N4 sheets were found to be subject to strong lateral reconstruction, resulting in a wave-like pattern of the individual units.30,31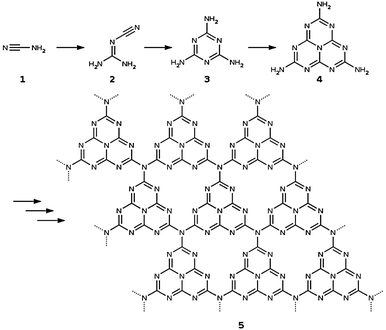 | ||
| Fig. 2 Schematic representation of the reaction sequence starting from cyanamide 1 and leading via dicyandiamide 2, melamine 3 and tri-s-triazine 4 to the formation of graphitic carbon nitride 5 in its thermodynamically most stable form (according to ref. 2). | ||
In a second step, following previous work of Gracia and Kroll,30 we also studied the effect of additional g-C3N4 layers stacked in a graphite-like manner by means of SCC-DFTB calculations. Consistently, an ABAB stacking pattern of corrugated g-C3N4 layers was found to be the most stable conformation, placing holes and tri-s-triazine units of consecutive layers on top of each other (cf.Fig. 4). The lattice parameters of the corresponding bulk structure with a unit cell of two (3 × 3) layers were optimized as a = b = 20.98 Å and c = 6.65 Å, showing hardly any stacking effect on the lateral cell size as compared to the single-layer optimization; the corresponding interlayer distance of 3.33 Å compares almost perfectly with the experimental value of 3.26 Å derived from wide-angle X-ray scattering (WAXS) measurements.2 Concerning the electronic band gap of the system, a value of 2.80 eV was found for the single-layer model using DFTB, comparing very well with the experimental 2.7 eV; this almost perfect agreement, however, is rather likely to result from error compensation, given the much higher 3.82 eV found in a corresponding B3LYP study.31 Just as the lattice parameters, also the band gap was found to be largely independent from additional layers (2.85 eV for the bulk model), supporting the idea that a single-layer description of the surface is sufficient for the problems at hand. This, however, we can only tell from the point of view provided by the applied methodology, which includes only empirical dispersion corrections to the total energy and is not able to capture possible effects due to explicit electron–electron interaction. The influence of additional layers on the (0001) surface and its adsorption properties will be discussed in Section 3.1.
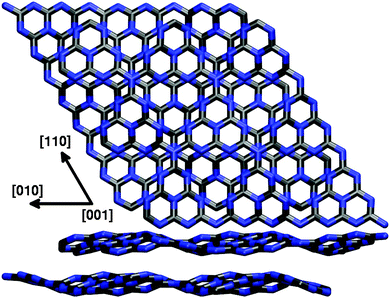 | ||
| Fig. 4 Top and side view of the SCC-DFTB optimized (3 × 3) bulk unit cell for an ABAB g-C3N4 crystal. | ||
Introducing the third dimension most naturally raises the question of different crystal surfaces that might play a role in experiment. Especially the six identical surfaces of the (![[1 with combining macron]](https://www.rsc.org/images/entities/char_0031_0304.gif) 010) type that can be created by clean cuts along a row of tri-s-triazine units in the direction of in-plane lattice vector a or b might exhibit different properties due to residual hydrogen atoms from synthesis (cf.Fig. 2) which saturate the bridging nitrogens between neighbouring tri-s-triazine units. Since the corresponding unit cell (see Fig. 5) needs to consist of at least two g-C3N4 layers, this structure was studied using the computationally less demanding SCC-DFTB approach only.
010) type that can be created by clean cuts along a row of tri-s-triazine units in the direction of in-plane lattice vector a or b might exhibit different properties due to residual hydrogen atoms from synthesis (cf.Fig. 2) which saturate the bridging nitrogens between neighbouring tri-s-triazine units. Since the corresponding unit cell (see Fig. 5) needs to consist of at least two g-C3N4 layers, this structure was studied using the computationally less demanding SCC-DFTB approach only.
3 Results and discussion
3.1 Water adsorption
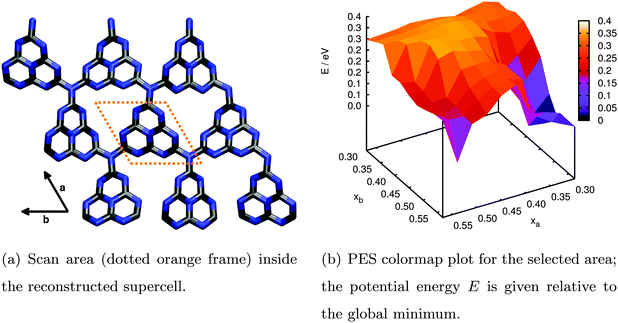 | ||
| Fig. 6 Relaxed PES scan of water adsorption in the (3 × 3) supercell model for an extended g-C3N4 sheet performed by periodic DFT calculations. | ||
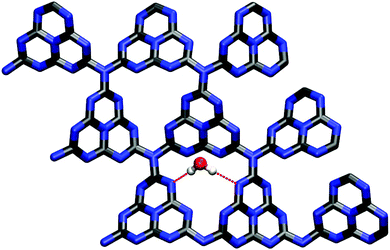
The resulting PES is presented in Fig. 6(b). The two lateral coordinates are given in units of fractions xa and xb of the length of the full lattice vectors a and b. First of all we find one distinct minimum around xa = 0.33 and xb = 0.51 above the triangular hole in the slab (the apparent minimum at large xa and xb is in fact the same but in the next subcell). This minimum is more stable by approximately 0.37 eV with respect to the least favourable water position on top of the tri-s-triazine unit at xa = 0.51 and xb = 0.42. The reason for this stabilization becomes clear from the fully optimized adsorption geometry shown in Fig. 7, allowing for hydrogen bonding interaction between the water H atoms and the electron lone pairs at the N atoms of opposing tri-s-triazine units. The tilted orientation of the water molecule with respect to the surface normal maximizes electrostatic interaction between the negatively polarized water oxygen (−1.3e) and the closest, positively polarized carbon atom (+1.5e) in the tri-s-triazine unit as estimated from Bader charge analysis33 (note, however, that this is a purely qualitative measure for the charge distribution inside the system). The adsorption energy according to eqn (3) for this configuration is Eads = −0.62 eV, corresponding to strong physisorption. For comparison and to rule out possible overbinding of the PBE-D3 scheme, the adsorption energy was also calculated using the non-local van-der-Waals density functional of Dion and coworkers,34–36 including re-optimization of the structures obtained in the PBE-D3 approach but retaining the preassigned lattice constants as well as all computational settings. The resulting water adsorption geometry, however, hardly changes with respect to the PBE-D3 case and gives rise to a marginally shifted adsorption energy of −0.55 eV, confirming our original computational protocol.
To the authors' knowledge there is only one previous publication about water adsorption on graphitic carbon nitride to compare with.37 This periodic first-principles (PBE) study, however, finds very different adsorption geometries and energies. This might be, in part, due to it being based on a non-reconstructed (1 × 1) surface model, possibly not allowing for the favourable hydrogen bonded configuration in the substrate's pore. Therefore, direct comparison of our results to those of ref. 37 is not attempted here.
Apart from visualizing the preferred adsorption sites, Fig. 6(b) also allows for a semi-quantitative estimate of the diffusion barrier of water for transitions from one triangular substrate pore to a neighbouring one. Specifically, the saddle at xa = 0.42 and xb = 0.57 is about 0.3 eV higher in energy than the minimum configuration. Since most likely the actual barrier will be slightly lower considering the limited resolution of the PES scan, a barrier of 0.2 eV could be assumed as a lower limit guess yielding a diffusion rate of around 109 s−1 according to Eyring transition state theory.38 This suggests a rather stable adsorption minimum on the timescale of molecular vibrations and charge transfer.
Subsequently, water adsorption was studied for the analogous (3 × 3) supercell in periodic SCC-DFTB calculations. For direct comparison, only a single g-C3N4 layer was considered in the first place, perfectly reproducing the previously found adsorption behaviour with the global minimum corresponding to the same hydrogen bonding situation in the triangular hole between two tri-s-triazine units. In contrast, regarding the absolute adsorption energy of Eads = −0.34 eV as compared to −0.62 eV in the DFT calculation no perfect match can be observed (Table 1). This is, however, considering the method's semiempirical nature and its parametrization based on a different (hybrid) functional, not quite surprising and does not belittle the qualitative predictive power of these supporting calculations.
| (0001) surface | (![[1 with combining macron]](https://www.rsc.org/images/entities/char_0031_0304.gif) 010) surface 010) surface |
||
|---|---|---|---|
| Method | PBE | DFTB | DFTB |
| E ads/eV | −0.62 | −0.34 | −0.51 |
Therefore, in a next step the influence of additional g-C3N4 layers stacked along the [0001] direction in ABAB fashion on the water adsorption was studied by means of SCC-DFTB calculations. No difference in adsorption geometry or energy (ΔEads < 0.01 eV) was observed for up to four substrate layers, confirming our original choice of a single-layer model (in the limitations of the applied methodology, see above) as sufficient for the description of g-C3N4-water interaction.
![[1 with combining macron]](https://www.rsc.org/images/entities/b_char_0031_0304.gif) 010) surface.
Starting from the unit cell of a perfect ABAB crystal consisting of g-C3N4 layers stacked along the [0001] direction (cf.Fig. 4), four symmetrically equivalent surfaces of the (
010) surface.
Starting from the unit cell of a perfect ABAB crystal consisting of g-C3N4 layers stacked along the [0001] direction (cf.Fig. 4), four symmetrically equivalent surfaces of the (![[1 with combining macron]](https://www.rsc.org/images/entities/char_0031_0304.gif) 010) type can be created by vertical cuts along the cell's lattice vectors a and b as described in Section 2.3. This kind of hydrogen bearing surface is likely to feature different adsorption characteristics than its (0001) counterparts, although it is not quite clear how abundant it really is in experiment (or if it occurs at all), since individual g-C3N4 layers are mainly bound by dispersion forces and the barrier for lateral shearing might be rather small. Still, the hydrogen-rich situation present on this crystal cut can be regarded as a model also for defects stemming from incomplete condensation during synthesis which have been found to be relatively frequent.2
010) type can be created by vertical cuts along the cell's lattice vectors a and b as described in Section 2.3. This kind of hydrogen bearing surface is likely to feature different adsorption characteristics than its (0001) counterparts, although it is not quite clear how abundant it really is in experiment (or if it occurs at all), since individual g-C3N4 layers are mainly bound by dispersion forces and the barrier for lateral shearing might be rather small. Still, the hydrogen-rich situation present on this crystal cut can be regarded as a model also for defects stemming from incomplete condensation during synthesis which have been found to be relatively frequent.2
In contrast to the (0001) surface, the (![[1 with combining macron]](https://www.rsc.org/images/entities/char_0031_0304.gif) 010) crystal cut offers three-dimensional adsorption pockets, stabilizing the water molecule not only by hydrogen bonds with the nitrogen lone pairs (bond length ≈ 2.0 to 2.5 Å) but also between the terminating amine groups and the water oxygen (distance ≈ 2.5 to 2.8 Å). Consistently, three different stable conformations were found in SCC-DFTB calculations, both varying in water orientation and adsorption energy (cf.Fig. 8). Interestingly, the latter, amounting to −0.43 eV (Fig. 8(c) and (b)) and −0.51 eV (Fig. 8(a)), only slightly exceeds the corresponding value for the (0001) surface and is clearly on the same order.
010) crystal cut offers three-dimensional adsorption pockets, stabilizing the water molecule not only by hydrogen bonds with the nitrogen lone pairs (bond length ≈ 2.0 to 2.5 Å) but also between the terminating amine groups and the water oxygen (distance ≈ 2.5 to 2.8 Å). Consistently, three different stable conformations were found in SCC-DFTB calculations, both varying in water orientation and adsorption energy (cf.Fig. 8). Interestingly, the latter, amounting to −0.43 eV (Fig. 8(c) and (b)) and −0.51 eV (Fig. 8(a)), only slightly exceeds the corresponding value for the (0001) surface and is clearly on the same order.
Overall, the stabilizing effect of residual hydrogen atoms terminating all but the (0001) surface does not seem to play a dominant role. Thus, the importance of these surfaces and/or similar defects for experimental observations will rather be governed by the question of their abundance, i.e. the question about the degree of polymerization of the sample which is highly preparation-dependent.2 In the following, we can therefore restrict ourselves on the photocatalytic water decomposition on a well-defined (0001) surface, that is likely to be the dominant structure in highly ordered samples.
3.2 Photocatalytic water splitting
In the following, both half reactions of water decomposition according to eqn (1) and (2) are studied using a methodology described above. This approach, as outlined in Section 2.2, allows to estimate the respective overpotentials on the basis of a thermodynamic description of one-electron reaction steps and to identify the rate-limiting step. All calculations in this part are based on the periodic (3 × 3) single-layer model justified in the previous section, using DFT-PBE.Furthermore, the resulting geometries (see Fig. 9) all come with rather high adsorption energies (Table 2), restraining potential diffusion processes and thus suggesting stable configurations on the timescale of electron transfer. Both the OH radical and OOH radical intermediate are stabilized mainly by electrostatic and hydrogen bonding interaction (Eads = −0.61 and −0.66 eV, respectively), whereas the single oxygen intermediate is covalently bound to a substrate nitrogen, forming an N-oxide group which is also reflected in its exceptionally high adsorption/binding energy of −2.73 eV.
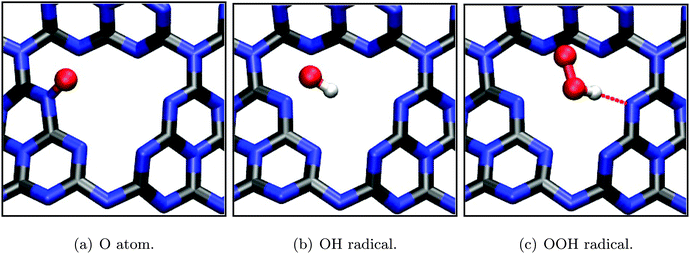 | ||
| Fig. 9 Optimized adsorption geometries (PBE) of intermediates during the water oxidation half reaction according to eqn (4) to (7). Selected bond lengths/atom distances: (a) r(N–O) = 1.28 Å; (b) r(N–O) = 2.28 Å, r(O–H) = 0.99 Å; (c) r(O–C) = 2.89 Å, r(O–O) = 1.34 Å. | ||
| Species | H2O molecule | O atom | OH radical | OOH radical | H atom | H3O radical |
|---|---|---|---|---|---|---|
| E ads/eV | −0.55 | −2.73 | −0.61 | −0.66 | −2.43 | −3.39 |
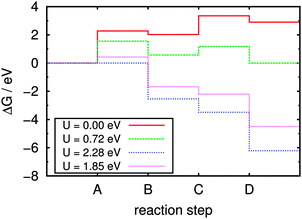
After optimization of the relevant gas phase molecules (namely H2, O2, and H2O) using the same cell geometry and computational settings, normal mode analyses were performed for all species. These are used in eqn (8) to (11) for the corresponding free energy contributions. Assuming pH = 7, the resulting free energy steps during the reaction sequence are visualized in Fig. 10. Four different cases regarding the light-induced potential bias U are of special interest here:
(a) U = 0, describing the situation without any external potential, i.e. without irradiation of the sample. This energy profile is indicated by the continuous red line in Fig. 10, disclosing the first step (A, splitting of adsorbed water into adsorbed OH and formation of H+ and e−) with its pronounced endergonicity as rate-limiting for the whole process. The free energy difference required for step A is 2.28 eV under these conditions, which is a lower bound for the activation free energy. Note that in the Nørskov approach, activation energies are in fact not calculated and reaction energies serve as lower bounds for them. Obviously, the water dissociation reaction is hardly promoted by the g-C3N4 substrate which is in contrast to the situation previously found on metal oxide surfaces such as TiO2(110)27 or RuO2(110),28 where the water molecule is covalently bound to surface metal atoms, weakening the intramolecular bonds.
(b) The equilibrium situation (dashed green line in Fig. 10), marking the lower limit of bias U in which the overall reaction begins to be exergonic; this is the case above 0.72 V under the chosen conditions.
(c) The “all downhill” case (dotted blue line) starting from U = 2.28 V, in which all individual reaction steps are exergonic and the overall reaction will proceed spontaneously without kinetic hindrance (assuming the absence of individual barriers for the reaction steps).
(d) The case of the irradiated sample (dotted pink line) with all reaction steps shifted according to the potential of a photo-generated hole in the substrate valence band relative to the NHE; in ref. 8 this was estimated to be UVB = 1.85 V at pH = 7 (see also Fig. 1).
Considering only the thermodynamic contribution to the overpotential, the latter is given by the difference between the potential biases in equilibrium and the “all downhill” case, yielding ηox = (2.28 − 0.72) V = 1.56 V at 300 K and pH = 7. Temperature effects are generally small, because they influence the overpotential only via the enthalpic and entropic contributions to the free energies. There is no effect due to the pH term which is only imposing a constant shift on the energy scale; for the same reason there is no pH dependence of the overpotential in this model (as long as the pH term does not shift the overall reaction free energy to negative values).
In comparison, the free energy profile for the irradiated sample (dotted pink line in Fig. 10) still features one endergonic reaction step, which means that irradiation of the sample does not provide enough overpotential for the water oxidation half reaction to proceed spontaneously; according to this model an additional external bias of (2.28 − 1.85) V = 0.43 V would be needed to drive the whole sequence at pH = 7. According to ref. 8 the band positions relative to the NHE depend on the pH via eUVB ≈ (2.20 − 0.05·pH) eV which is on the same order as the pH dependence of the redox potentials (ΔpH = kBT![[thin space (1/6-em)]](https://www.rsc.org/images/entities/char_2009.gif) ln(10)·pH ≈ 0.06 eV·pH). Therefore, the additional external potential needed for the reaction to take place despite irradiation of the sample only slightly changes from 0.50 V at pH = 0 to 0.36 V at pH = 14, i.e. the process cannot be driven by light at any pH. This finding is perfectly in line with the experimental observation that cocatalysts (such as Co3O4) are needed for water oxidation in any case,4 lowering individual thermodynamic (and/or kinetic) barriers.
ln(10)·pH ≈ 0.06 eV·pH). Therefore, the additional external potential needed for the reaction to take place despite irradiation of the sample only slightly changes from 0.50 V at pH = 0 to 0.36 V at pH = 14, i.e. the process cannot be driven by light at any pH. This finding is perfectly in line with the experimental observation that cocatalysts (such as Co3O4) are needed for water oxidation in any case,4 lowering individual thermodynamic (and/or kinetic) barriers.
Again, adsorption geometries of intermediate species (H atom, H3O radical) were optimized on the hollow site (see Fig. 11), yielding large adsorption energies on the order of several eV (Table 2). This is easily understood by the strong covalent bond that is formed between a substrate N and adsorbate H atom, even subtracting one hydrogen atom in case of the H3O radical, leaving the remaining water molecule in a hydrogen bonded configuration (Fig. 11(b)).
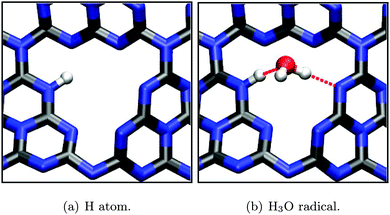 | ||
| Fig. 11 Optimized adsorption geometries (PBE) of intermediates during the H+ reduction half reaction according to eqn (12) and (14). Selected bond lengths/atom distances: (a) r(N–H) = 1.05 Å; (b) r(N–H) = 1.04 Å, r(O–C) = 2.81 Å, hydrogen bonds (dotted red lines) ≈ 2.85 Å. | ||
Evaluation of the free energy differences according to equations (16) to (19) at 300 K and pH = 0 or pH = 7 yields the values compiled in Table 3 for reaction steps E/E′ and F/F′, respectively. Here, in fact the pH plays a certain role, since the pH-related term easily overcompensates the slight endergonicity of step E/E′ in the two-step process. At pH = 0, cancelling the pH term in eqn (12) to (15), the U = 0 case is equal to the equilibrium situation and imposing a small bias of U = 0.03 V (U = 0.08 V, if including an additional water molecule), would cause the reaction sequence to proceed spontaneously, corresponding to a tiny overpotential of U = 0.03 V (U = 0.08 V). This overpotential is easily provided by a photo-generated electron in the conduction band whose corresponding potential relative to the NHE was estimated to be UCB ≈ −0.50 V at pH = 0 in ref. 8. At pH = 7, however, the pH term already causes the sequence to be “all downhill” even without the influence of any potential bias, i.e. the H+ reduction half reaction is not subject to any overpotential under these conditions. The presence of an additional water molecule does not change the thermodynamics of the process significantly, as can be seen from the modest variations in Table 3.
| pH = 0 | pH = 7 | |||
|---|---|---|---|---|
| Isolated H | Additional H2O | Isolated H | Additional H2O | |
| ΔGE/E′ | +0.03 | +0.08 | −0.38 | −0.33 |
| ΔGF/F′ | −0.03 | −0.08 | −0.45 | −0.50 |
The model applied here, however, does not consider possible effects due to additional potential barriers between the individual reaction steps as outlined above. Especially for the H+ reduction half reaction featuring an extraordinarily large binding energy for the H intermediate which is most likely to hinder the following step, this approximation might not be sufficient for describing the kinetic origin of the overpotential. Here, also the effect of an additional water molecule in the proximity of the hydrogen atom will possibly play an important role in lowering the kinetic barrier for desorption. Still, the general finding that H+ reduction on the g-C3N4 (0001) surface should be subject to a much smaller overpotential than H2O oxidation is in very good agreement with the experimental observation that H2 production is indeed possible under irradiation with visible light without any help of cocatalysts.4
4 Conclusions and outlook
In this combined first-principles and semiempirical study we systematically investigated water adsorption on graphitic carbon nitride, taking into account not only a perfectly crystalline sheet of the material but also the role of additional layers and surface terminations. The influence of layer stacking on the adsorption properties of the (0001) surface was found to be rather small, rendering a single-layer description of the system sufficient. Water adsorption was studied systematically for an infinite g-C3N4 sheet, revealing an optimal geometry with the water molecule bridging the triangular pore between three tri-s-triazine units by forming hydrogen bonds with substrate N atoms. The hydrogen-saturated (![[1 with combining macron]](https://www.rsc.org/images/entities/char_0031_0304.gif) 010) surface of a layered g-C3N4 ABAB crystal, possibly suitable as a model for defects in the material, was found to exhibit only slightly different adsorption qualities, mainly due to its amine functions.
010) surface of a layered g-C3N4 ABAB crystal, possibly suitable as a model for defects in the material, was found to exhibit only slightly different adsorption qualities, mainly due to its amine functions.
Since, however, in a highly crystalline sample the (0001) surface should be by far most abundant, photocatalytic water splitting was studied on this surface afterwards. A method originally introduced by Nørskov and coworkers was used to model the water oxidation half reaction in a sequence consisting of four steps each of which providing an electron for H+ reduction. Analysis of the individual reaction free energies revealed that, in contrast to similar investigations for metal oxide catalysts, the rate-limiting step in the oxidation process is in fact the water dissociation reaction on the substrate surface, possibly providing a starting point for the improvement of catalytic performance. A huge overpotential of 1.56 V was derived for this half reaction, preventing water oxidation from proceeding spontaneously upon irradiation of the sample irrespective of the solution's pH. This result is consistent with the experimental observation that O2 evolution is in fact only possible in the presence of oxidation cocatalysts.
A similar formalism was set up for the H+ reduction half reaction, consisting of two steps consuming an electron each. According to this model, hardly any overpotential (or none at all for larger values of pH) was found for H+ reduction, rendering the photo-generated potential bias due to an electron in the substrate conduction band sufficient for driving the process at any condition of pH. This is, again, consistent with experiment, observing H2 production under irradiation with visible light without help of cocatalysts.
Especially for the latter half reaction but also for water oxidation, further studies should concentrate on the “real” kinetic barriers of the individual reaction steps, adding to the overall overpotential. These could be found for example using a climbing-image nudged-elastic band scheme.39–41 Also, the influence of additional water molecules on the overpotential, i.e. its coverage-dependence, should be studied in some detail since experiments are generally conducted in aqueous solution. Apart from structural effects on the adsorption geometries of intermediates and their impact on the thermodynamics of the reaction sequence, especially the role of the water layer as a “source” or “sink” of protons is likely to influence both half reactions and the associated overpotentials. Another important step towards a direct interpretation of experimental observations would be to incorporate the role of cocatalysts in the model description of photocatalysis.
Concerning the goal of understanding charge separation, localization and exciton lifetime in graphitic carbon nitride as formulated in the introduction of this article, from the point of methodology a different approach than the one applied here has to be taken in order to calculate electronically excited states. On the basis of cluster models the whole toolbox of quantum chemistry is available, giving access also to excited states; additionally, the model for the description of water decomposition used in the present work could be reformulated in terms of charged intermediates in that case.42 We already took first steps towards finding suitable g-C3N4 clusters, largely reproducing the water adsorption characteristics of our periodic model, and plan to improve on our description of photocatalytic water oxidation and H+ reduction on graphitic carbon nitride in the near future.
References
- X. Wang, S. Blechert and M. Antonietti, ACS Catal., 2012, 2, 1596–1606 CrossRef CAS.
- A. Thomas, A. Fischer, F. Goettmann, M. Antonietti, J.-O. Müller, R. Schlögl and J. M. Carlsson, J. Mater. Chem., 2008, 18, 4893–4908 RSC.
- X. Wang, K. Maeda, A. Thomas, K. Takanabe, G. Xin, J. M. Carlsson, K. Domen and M. Antonietti, Nat. Mater., 2009, 8, 76–80 CrossRef CAS PubMed.
- K. Maeda, X. Wang, Y. Nishihara, D. Lu, M. Antonietti and K. Domen, J. Phys. Chem. C, 2009, 113, 4940–4947 CAS.
- F. Goettmann, A. Thomas and M. Antonietti, Angew. Chem., Int. Ed., 2007, 46, 2717–2720 CrossRef CAS PubMed.
- F. Su, S. C. Mathew, G. Lipner, X. Fu, M. Antonietti, S. Blechert and X. Wang, J. Am. Chem. Soc., 2010, 132, 16299–16301 CrossRef CAS PubMed.
- Y. Zhang, Z. Schnepp, J. Cao, S. Ouyang, Y. Li, J. Ye and S. Liu, Sci. Rep., 2013, 3, 2163 Search PubMed.
- Y. Zhang and M. Antonietti, Chem. – Asian J., 2010, 5, 1307–1311 CAS.
- W. Kohn and L. J. Sham, Phys. Rev., 1965, 140, A1133–A1138 CrossRef.
- P. E. Blöchl, Phys. Rev. B: Condens. Matter Mater. Phys., 1994, 50, 17953–17979 CrossRef.
- G. Kresse and D. Joubert, Phys. Rev. B: Condens. Matter Mater. Phys., 1999, 59, 1758–1775 CrossRef CAS.
- G. Kresse and J. Hafner, Phys. Rev. B: Condens. Matter Mater. Phys., 1993, 47, 558–561 CrossRef CAS.
- G. Kresse and J. Hafner, Phys. Rev. B: Condens. Matter Mater. Phys., 1993, 48, 13115–13118 CrossRef CAS.
- G. Kresse and J. Hafner, Phys. Rev. B: Condens. Matter Mater. Phys., 1994, 49, 14251–14269 CrossRef CAS.
- J. P. Perdew, K. Burke and M. Ernzerhof, Phys. Rev. Lett., 1996, 77, 3865–3868 CrossRef CAS.
- J. P. Perdew, K. Burke and M. Ernzerhof, Phys. Rev. Lett., 1997, 78, 1396 CrossRef CAS.
- S. Grimme, J. Antony, S. Ehrlich and H. Krieg, J. Chem. Phys., 2010, 132, 154104 CrossRef PubMed.
- S. Grimme, S. Ehrlich and L. Goerigk, J. Comput. Chem., 2011, 32, 1456–1465 CrossRef CAS PubMed.
- H. J. Monkhorst and J. D. Pack, Phys. Rev. B: Solid State, 1976, 13, 5188–5192 CrossRef.
- B. Aradi, B. Hourahine and T. Frauenheim, J. Phys. Chem. A, 2007, 111, 5678–5684 CrossRef CAS PubMed.
- M. Elstner, D. Porezag, G. Jungnickel, J. Elsner, M. Haugk, T. Frauenheim, S. Suhai and G. Seifert, Phys. Rev. B: Condens. Matter Mater. Phys., 1998, 58, 7260–7268 CrossRef CAS.
- A. K. Rappe, C. J. Casewit, K. S. Colwell, W. A. Goddard and W. M. Skiff, J. Am. Chem. Soc., 1992, 114, 10024–10035 CrossRef CAS.
- L. Zhechkov, T. Heine, S. Patchkovskii, G. Seifert and H. A. Duarte, J. Chem. Theory Comput., 2005, 1, 841–847 CrossRef CAS.
- F. Jensen, Introduction to Computational Chemistry, Wiley, 2007 Search PubMed.
- J. K. Nørskov, J. Rossmeisl, A. Logadottir, L. Lindqvist, J. R. Kitchin, T. Bligaard and H. Jónsson, J. Phys. Chem. B, 2004, 108, 17886–17892 CrossRef.
- J. Rossmeisl, Z.-W. Qu, H. Zhu, G.-J. Kroes and J. Nørskov, J. Electroanal. Chem., 2007, 607, 83–89 CrossRef CAS PubMed.
- A. Valdés, Z.-W. Qu, G.-J. Kroes, J. Rossmeisl and J. K. Nørskov, J. Phys. Chem. C, 2008, 112, 9872–9879 Search PubMed.
- J. Wirth, S. Monturet, T. Klamroth and P. Saalfrank, EPL, 2011, 93, 68001 CrossRef.
- E. Kroke, M. Schwarz, E. Horath-Bordon, P. Kroll, B. Noll and A. D. Norman, New J. Chem., 2002, 26, 508–512 RSC.
- J. Gracia and P. Kroll, J. Mater. Chem., 2009, 19, 3013–3019 RSC.
- M. Deifallah, P. F. McMillan and F. Cora, J. Phys. Chem. C, 2008, 112, 5447–5453 CAS.
- J. P. Perdew, Int. J. Quantum Chem., 1985, 28, 497–523 CrossRef.
- W. Tang, E. Sanville and G. Henkelman, J. Phys.: Condens. Matter, 2009, 21, 084204 CrossRef CAS PubMed.
- M. Dion, H. Rydberg, E. Schröder, D. C. Langreth and B. I. Lundqvist, Phys. Rev. Lett., 2004, 92, 246401 CrossRef CAS PubMed.
- J. Klimeøs, D. R. Bowler and A. Michaelides, J. Phys.: Condens. Matter, 2010, 22, 022201 CrossRef PubMed.
- J. c. v. Klimeš, D. R. Bowler and A. Michaelides, Phys. Rev. B: Condens. Matter Mater. Phys., 2011, 83, 195131 CrossRef.
- S. M. Aspera, M. David and H. Kasai, Jpn. J. Appl. Phys., 2010, 49, 115703 CrossRef.
- H. Eyring, Chem. Rev., 1935, 17, 65–77 CrossRef CAS.
- G. Mills, H. Jónsson and G. K. Schenter, Surf. Sci., 1995, 324, 305–337 CrossRef CAS.
- H. Jónsson, G. Mills and K. W. Jacobsen, Classical and Quantum Dynamics in Condensed Phase Simulations, World Scientific, 1995 Search PubMed.
- G. Henkelman, B. P. Uberuaga and H. Jónsson, J. Chem. Phys., 2000, 113, 9901–9904 CrossRef CAS PubMed.
- A. Valdés and G.-J. Kroes, J. Phys. Chem. C, 2010, 114, 1701–1708 Search PubMed.
| This journal is © the Owner Societies 2014 |

