 Open Access Article
 This Open Access Article is licensed under a Creative Commons Attribution-Non Commercial 3.0 Unported Licence
Hydrogen bonding of nitroxide spin labels in membrane proteins
P.
Gast
*a,
R. T. L.
Herbonnet
a,
J.
Klare
b,
A.
Nalepa
c,
C.
Rickert
b,
D.
Stellinga
a,
L.
Urban
b,
K.
Möbius
cd,
A.
Savitsky
c,
H.-J.
Steinhoff
b and
E. J. J.
Groenen
a
aHuygens-Kamerlingh Onnes Laboratory, Department of Physics, Leiden University, P.O. Box 9504, NL-2300 RA Leiden, The Netherlands. E-mail: gast@physics.leidenuniv.nl
bDepartment of Physics, University of Osnabrück, Barbarastrasse 7, D-49076 Osnabrück, Germany. E-mail: hsteinho@uni-osnabrueck.de
cMax Planck Institute for Chemical Energy Conversion, Stiftstrasse 34-36, D-45470 Mülheim an der Ruhr, Germany. E-mail: anton.savitsky@cec.mpg.de
dDepartment of Physics, Free University Berlin, Arnimallee 14, D-14195 Berlin, Germany. E-mail: moebius@physik.fu-berlin.de
First published on 20th June 2014
Abstract
On the basis of experiments at 275 GHz, we reconsider the dependence of the continuous-wave EPR spectra of nitroxide spin-labeled protein sites in sensory- and bacteriorhodopsin on the micro-environment. The high magnetic field provides the resolution necessary to disentangle the effects of hydrogen bonding and polarity. In the gxx region of the 275 GHz EPR spectrum, bands are resolved that derive from spin-label populations carrying no, one or two hydrogen bonds. The gxx value of each population varies hardly from site to site, significantly less than deduced previously from studies at lower microwave frequencies. The fractions of the populations vary strongly, which provides a consistent description of the variation of the average gxx and the average nitrogen-hyperfine interaction Azz from site to site. These variations reflect the difference in the proticity of the micro-environment, and differences in polarity contribute marginally. Concomitant W-band ELDOR-detected NMR experiments on the corresponding nitroxide in perdeuterated water resolve population-specific nitrogen-hyperfine bands, which underlies the interpretation for the proteins.
Introduction
Site-directed spin labeling using nitroxide radicals has opened up the possibility to probe the local polarity and proticity in a protein with continuous-wave electron paramagnetic resonance (EPR). In frozen solution, the EPR spectra reveal the g-tensor and the nitrogen-hyperfine tensor, which are both sensitive to the micro-environment of the nitroxide label. Such an approach has been successfully applied to various membrane and water soluble proteins,1,2 and the variation of the EPR parameters from site to site was analyzed in terms of the effects of local polarity and of hydrogen bonding. In particular, the Azz component of the nitrogen-hyperfine tensor (in the coordinate system with the x axis along the N–O bond and the z axis perpendicular to the nitroxide ring plane) has been argued to present a measure of the polarity and the behaviour of gxxversus Azz to reflect the interplay of polarity and proticity, where the latter represents the propensity to form hydrogen bonds. Recently, pulsed and continuous-wave EPR were combined to disentangle the sources of protons involved in hydrogen bonding.3For nitroxide radicals, Lebedev and co-workers4 noticed by high-field EPR already in the early 1980's a linear correlation between gxx and Azz, where gxx decreases and Azz increases with increasing solvent polarity. The influence of hydrogen bonding on gxx has been referred to first for five-membered ring nitroxide spin labels5 and on Azz for the perdeuterated six-membered ring nitroxide spin label tempone in perdeuterated ethanol.6 Polarity effects on the EPR parameters are small at higher dielectric constants in aqueous environments where the effect of hydrogen bonds was found to become dominant.7 These observations were theoretically analyzed by semi-empirical molecular orbital methods,8 by density-functional-theory calculations,7 and by unrestricted Hartree–Fock calculations.9 Trends were reproduced, but the contribution of polarity and of hydrogen bonding to the observed variation of the EPR parameters remained undecided.
At X-band (9.5 GHz) microwave frequency, values of gzz and Azz of nitroxides can be obtained from rigid-limit spectra. At W-band (95 GHz) microwave frequency, all g-tensor components become resolved. The gxx region of the EPR spectra of nitroxides in frozen polar/protic solution shows, besides nitrogen hyperfine/quadrupole structure, different components related to distinct local environments.10 Corresponding differences in the nitrogen-hyperfine coupling Azz are expected, but remain hidden in the broad EPR lines. Recently, distinct Azz contributions were observed in ELDOR-detected NMR (EDNMR) experiments on a pyrroline-type nitroxide radical in 2-propanol, and described in terms of nitroxides in different situations of hydrogen bonding.11
For nitroxide-labeled proteins the hyperfine structure is no longer resolved in the gxx region of the EPR spectra. Instead, for such systems the gxx line at W-band reveals a complex structure.12 In an extensive study, nitroxide spin labels covalently attached to many sites in both membrane and water-soluble proteins were investigated, mostly at W-band.2 A consistent description of the gxx region of the EPR spectra was obtained in terms of the contributions of three populations characterized by distinct gxx values, gixx (i = 0, 1, 2), for each investigated position of the spin label at the protein. The gixx values and the fractions of the different spin-label populations were correlated to the average hyperfine splitting 〈Azz〉 and the populations were discussed in terms of hydrogen bonding to the nitroxide moiety. In this study, a few experiments at 275 and 360 GHz were included, which clearly showed that a further increase of the Zeeman resolution would facilitate the interpretation of the sub-structure in the gxx region of the spectrum.
Here we benefit from the higher resolution at 275 GHz and present the results of an EPR study at this microwave frequency of a number of spin label sites in the membrane proteins sensory rhodopsin and bacteriorhodopsin. Supporting data are reported for the deuterated nitroxide radical 3-hydroxymethyl-2,2,5,5-tetramethylpyrrolin-1-oxyl (R1-D16) dissolved in D2O. Analysis of the variation of gixx, of the average gxx, and of the average Azz with the protein site reveals the dominant role of hydrogen bonding.
Materials and methods
Sample preparation
Protein expressions, spin labeling and sample preparation by reconstitution in purple membrane lipids were carried out as described previously.13,14 The spin label (1-oxyl-2,2,5,5-tetramethylpyrroline-3-methyl)methanethiosulphonate (MTSSL; TRC, Toronto) was covalently attached to the cysteine residues of the protein cysteine exchange mutants according to the method described in ref. 14. The proteins contained spin labels at the following positions: sensory rhodopsin (sr): sr16, sr17, sr34, sr36, sr89, sr90, sr95 and sr136, and bacteriorhodopsin (br): br129 and br166. The samples were concentrated by either first concentrating the solution in an Eppendorf centrifuge or concentrating the sample inside the EPR sample tube using a table top swing-out centrifuge.The perdeuterated nitroxide spin probe R1-D16 used in this study was synthesized as described previously.10 The solvents D2O and glycerol-D8 were obtained from Deutero GmbH and Sigma Aldrich, respectively.
EPR at 275 GHz
The 275 GHz continuous-wave (cw) EPR and pulsed electron-nuclear double resonance (ENDOR) spectra have been recorded using a home-built spectrometer operating at 275.7 GHz.15 The spectrometer is equipped with a TE011 cylindrical cavity with a diameter of 1.4 mm. The quartz sample tubes (VitroCom Inc.) have an outer diameter of 0.25 mm and an inner diameter of 0.15 mm. The effective sample volume inside the cavity is approximately 27 nl.All cw spectra have been measured at a temperature of 40 K. The modulation frequency was 1.380 kHz, and the modulation amplitude approximately 0.4 mT (0.12 mT for the deuterated sample). The microwave power of 1 mW was attenuated by 36.5 to 40 dB. The scans were all performed over the same field range (9.7950 T to 9.8550 T), at the same scan rate (0.12 mT s−1), and with 2000 data points.
The inner chamber of the cryostat, holding the probe head, was deoxygenated by pumping out the air at a temperature of about 120–160 K and filling with helium gas.
Calibration of the magnetic field sensed by the EPR sample was accomplished by measuring the proton Larmor frequency in a Mims-type 1H-ENDOR experiment at 9.8200 T and 5 K. The measured EPR spectra were subsequently corrected for the difference between the calculated magnetic-field value and the set value of 9.8200 T. The correction varied between 0.8 and 1.5 mT. For the deuterated nitroxide in deuterated solvent, the calibration of the magnetic field was based on gzz = 2.00221.
For the determination of the three gixx values only the data points between 9.8000 T and 9.8150 T were used. The EPR spectra contained in some cases a minor contribution of dispersion and of Mn(II) signals. This made a simulation of the entire EPR spectrum less accurate in the gxx region than a fit of only this part of the spectrum. The fits of the EPR spectra in the gxx region with four Gaussians were obtained using OriginPro 7.5. Three of the Gaussians represent the individual components g0xx, g1xx and g2xx, while the tail of a fourth is used as a baseline to compensate for the residual contribution of the rest of the spectrum, most notably the gyy peak. The starting parameters (line width, field position, intensity and offset) for these “3 + 1” Gaussian fits were left unrestricted. The peak positions of the Gaussians are then used to calculate the gixx values and the area under each Gaussian as a measure of the fraction of each population. Error margins for the measured gixx values were determined from fits of EPR spectra, which were recorded twice. Before fitting the gxx region a linear baseline correction was executed and the whole spectrum was shifted along the magnetic field axis according to the results from the 1H-ENDOR experiment.
W-band EPR
The W-band cw EPR measurements have been performed at 80 K with a home-built spectrometer operating at a microwave frequency of 95 GHz.16 The magnetic field was modulated at 8 kHz with an amplitude of 30 μT.The W-band EDNMR experiments have been performed on a modified Bruker Elexsys E680 spectrometer operating at about 94 GHz.11 The EDNMR experiments made use of a two-pulse Hahn-echo detection at microwave frequency ν1, matched to the cavity resonance. The high-turning angle (HTA) microwave pulse was applied at the microwave frequency ν2. The spectra were acquired by continuously sweeping ν2 at a fixed magnetic field, in steps of 70 kHz. The length and amplitude of the HTA pulse were adjusted to obtain an ELDOR π-pulse on the forbidden transition of interest at the gzz, mI = −1 field position. The HTA pulse length was set to 2.5 μs at a 2.6 × 10⁷ rad per s pulse amplitude. The detection sequence was set 7 μs after the HTA pulse to ensure the decay of electron-spin coherencies. The length of the detection π/2 pulse was set to 100 ns, and the pulse separation to 1 μs. The echo was integrated over 1.4 μs around its maximum for optimal resolution. For the two-dimensional EDNMR data surface, EDNMR traces were recorded in the field range of 1.2 mT around the gzz, mI = −1 spectral field position. A measurement repetition rate of 500 Hz was used to allow the echo signal to restore between consecutive pulse trains. The EDNMR data were analysed according to the procedure reported previously.11
X-band EPR
The X-band cw EPR measurements have been performed at 160 K with a home-built spectrometer equipped with an AEG H103 rectangular cavity. The microwave power was set to 0.2 mW and the magnetic field modulated with an amplitude of 0.25 mT. A B-NM 12 B-field meter (Bruker) was employed to measure the magnetic field and a flow cryostat (Oxford ESR 900) to stabilize the sample temperature. Sample volumes of 40 μl at protein concentrations of 15–20 mg ml−1 were loaded into EPR quartz capillaries of 3 mm inner diameter.The Azz values were determined by fitting simulated spectra to the experimental ones using the program DIPFIT,17 with an estimated error of ±0.01 mT. These values are more accurate than corresponding values determined from cw spectra at higher microwave frequencies.
Results and discussion
Fig. 1a shows the cw EPR spectrum at 275 GHz and 40 K of sensory rhodopsin spin-labeled at position 90, which is a typical example of the spectra that we have obtained for all ten systems. The spectrum reflects a nitroxide powder spectrum in which the principal g regions are fully resolved owing to the high microwave frequency and correspondingly high magnetic field. The gzz region, around 9.838 T, shows three nitrogen-hyperfine transitions split by Azz. Some of the spectra contain small spurious signals in this region at 9.830, 9.839 and 9.848 T, which derive from the presence of Mn(II). The gxx region of the spectrum, between 9.800 and 9.815 T, clearly shows structure. In Fig. 1b, this spectral region is represented for all samples, from top to bottom in the order of increasing nitrogen-hyperfine splitting. In most spectra three peaks can be discerned. As outlined in Materials and methods and illustrated for sr90 in the inset of Fig. 1a, a Gaussian fit was performed of the gxx region of the spectra. The results of these fits in terms of the distinct contributions (fractions fr0, fr1, and fr2) of three gxx-tensor components (g0xx, g1xx and g2xx) are summarized in Table 1.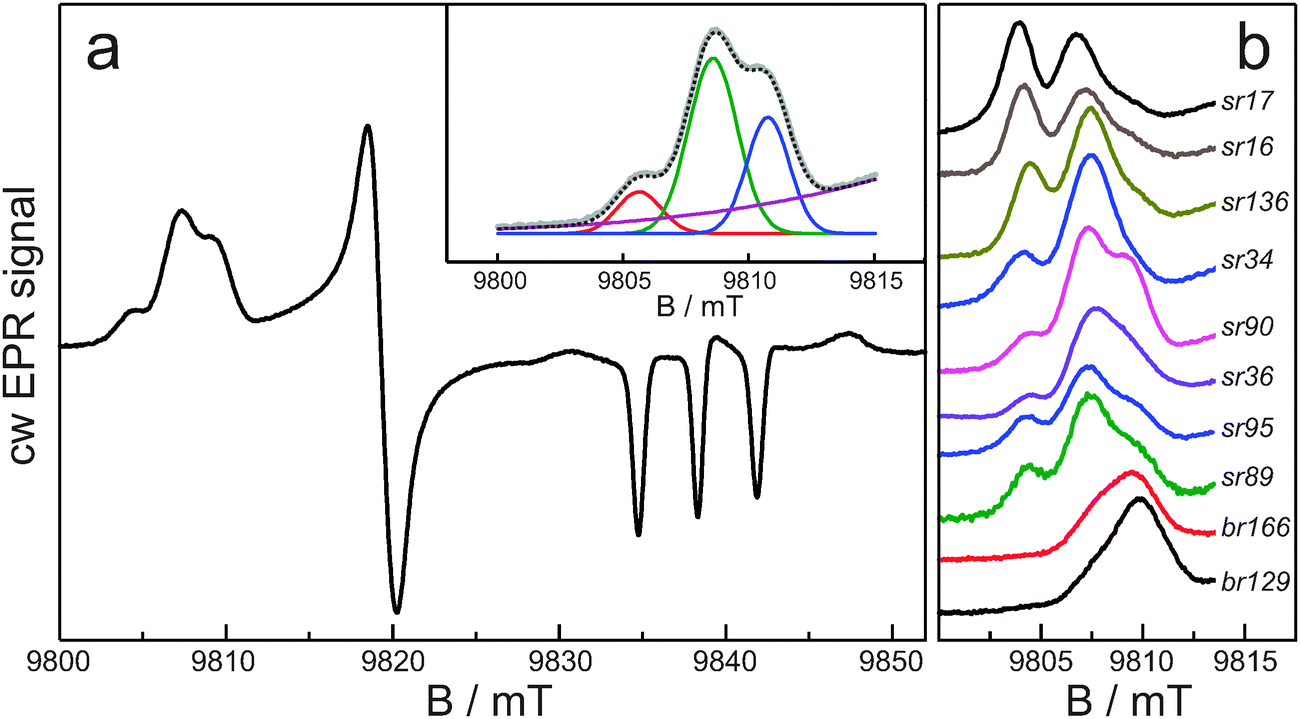 | ||
| Fig. 1 Continuous-wave EPR spectra at 275 GHz and 40 K of spin-labeled proteins. (a) Full spectrum for sensory rhodopsin spin-labeled at position 90; the inset shows the result of the Gaussian fit of the gxx region of this spectrum. (b) The gxx region of the spectra of all spin-labeled proteins in this study. | ||
| Spin-labeled protein | g 0 xx | g 1 xx | g 2 xx | fr0 | fr1 | fr2 | 〈Azz〉/mT | 〈gxx〉 | 〈gxx〉C |
|---|---|---|---|---|---|---|---|---|---|
| sr17 | 92.2 | 86.4 | 82.5 | 0.48 | 0.34 | 0.18 | 3.42 | 88.9 | 88.5 |
| sr16 | 91.9 | 85.8 | 81.3 | 0.39 | 0.48 | 0.14 | 3.43 | 87.6 | 87.6 |
| sr136 | 91.3 | 85.3 | 80.8 | 0.30 | 0.58 | 0.12 | 3.49 | 86.5 | 86.6 |
| sr34 | 92.2 | 85.2 | 80.6 | 0.21 | 0.72 | 0.07 | 3.54 | 86.6 | 86.4 |
| sr90 | 91.6 | 85.6 | 81.1 | 0.10 | 0.55 | 0.35 | 3.55 | 84.9 | 84.6 |
| sr36 | 91.4 | 85.0 | 80.9 | 0.07 | 0.60 | 0.33 | 3.55 | 84.1 | 84.1 |
| sr95 | 91.8 | 85.6 | 81.0 | 0.19 | 0.58 | 0.23 | 3.58 | 85.6 | 85.7 |
| sr89 | 91.5 | 85.4 | 80.7 | 0.19 | 0.53 | 0.28 | 3.63 | 85.2 | 85.2 |
| br166 | — | 84.6 | 80.6 | 0 | 0.34 | 0.66 | 3.64 | 82.0 | 82.0 |
| br129 | — | 85.0 | 80.15 | 0 | 0.16 | 0.84 | 3.67 | 80.9 | 81.0 |
| 〈gixx〉 | 91.7 | 85.3 | 81.1 | ||||||
The observation of sub-structure in the gxx region, which does not derive from nitrogen-hyperfine or quadrupole splitting, is consistent with EPR spectra at lower microwave frequency. In a study of about 100 spin-labeled sites in various proteins at W-band,2 the EPR spectra were simulated as the sum of three components characterized by different gxx values. The three components were interpreted as nitroxide populations carrying no hydrogen bond, one hydrogen bond and two hydrogen bonds. The presence of different populations was clear from the W-band experiments, but the strong overlap of the EPR lines limited the accuracy of the determination of the corresponding gixx values.
The improved g-resolution of the EPR spectra at 275 GHz confirms the presence of three nitroxide populations for the spin-labeled protein sites and allows for a more precise analysis. We find gxx values in narrow ranges: g0xx between 2.00913 and 2.00922, g1xx between 2.00846 and 2.00864, and g2xx between 2.00801 and 2.00825 (Table 1). The difference between g0xx and g1xx is on average 640 ppm and between g1xx and g2xx is on average 420 ppm. These differences agree with those theoretically predicted for the change of gxx upon formation of one and two hydrogen bonds to a nitroxide, which corroborates the assignment of the populations.7,8,18
Fig. 2 shows a plot of the gixx values of the protein sites as a function of the z component of the nitrogen-hyperfine splitting, the latter being obtained from X-band cw EPR spectra. We label the splitting by 〈Azz〉, anticipating that the observed value of Azz can be the average of distinct Azz values, each associated with one of the gxx components. The Azz peaks in the EPR spectra show no structure, which means that distinct hyperfine transitions, if present, are hidden in the inhomogeneously broadened line. The linear fits in Fig. 2 correspond to small slopes, from −0.17 T−1 for the spin label carrying no hydrogen bond to −0.52 T−1 for the spin label carrying two hydrogen bonds. For 〈Azz〉 values between 3.43 and 3.63 mT, the variation of gixx (i = 0, 1, 2) is even negligible, taken into account the accuracy of 10 ppm. The slopes are significantly smaller than the slopes of −1.2 to −1.6 T−1 derived from similar EPR experiments at W-band.2 The difference results from the limitation in the determination of gixx at the lower microwave frequency due to the fact that the decomposition of the EPR spectra at W-band is less accurate. The few data at 275 and 360 GHz in ref. 2 are fully consistent with the present findings. The slopes derived from the 275 GHz data are at least an order of magnitude smaller than the value of −5.1 and −6.5 T−1 predicted theoretically for nitroxides in aprotic and protic solvents.8 The observed slopes are also smaller than the value of −0.8 T−1, which was obtained from measurements of the unbound nitroxide spin label MTSSL in solvents of different polarity.7 Apparently, polarity is not decisive as regards the variation of gixx with 〈Azz〉. This conclusion needs further discussion after consideration of the factors that determine 〈Azz〉.
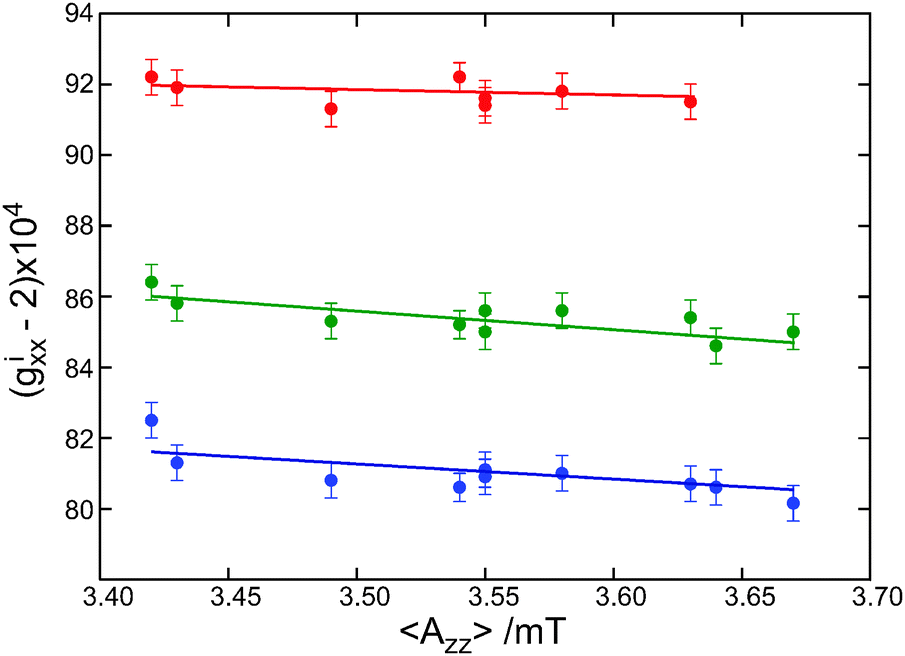 | ||
| Fig. 2 The variation of gixx (i = 0 red, i = 1 green and i = 2 blue) as a function of 〈Azz〉 for all spin-labeled proteins. | ||
The nitrogen-hyperfine lines at gzz do not show structure, but, as seen in Fig. 1a, the outer lines corresponding to mI = ±1 are broader than the central line corresponding to mI = 0 (FWHM 0.80 mT vs. 0.69 mT). This difference could derive from a distribution of Azz values, but the observation of distinct gxx populations rather suggests distinct Azz values. This interpretation is supported by EPR experiments on the nitroxide radical R1. This radical is relevant because the methanethiosulphonate substituted derivative of R1 corresponds to the spin label of the proteins. We have investigated R1-D16 in D2O with 5% and 10% (v/v) of glycerol-D8, which concerns an aqueous micro-environment of the nitroxide radical and in that sense can be considered a limiting case in relation to the spin-label sites in the proteins. Fig. 3a shows the high-field cw EPR spectrum of the nitroxide radical at 275 GHz and, for comparison, that of bacteriorhodopsin labeled at position 129 (br129). The spectra are indeed similar. The R1-D16 spectra in D2O containing 5% or 10% (v/v) of glycerol-D8 are identical, which indicates the dominant interaction of the nitroxide radical with water molecules. The gxx region of the nitroxide spectrum reveals two spectral contributions with different g-tensor principal values: g1xx = 2.00831 ± 0.00004 and g2xx = 2.00790 ± 0.00004. The two contributions in the gxx region can also be distinguished in the cw EPR spectrum at W-band (Fig. 3b). The overall shape of the gxx band at W-band is different from that at 275 GHz because of nitrogen-hyperfine/quadrupole structure, which is still partly resolved at the lower microwave frequency.10 The two contributions are ascribed to two fractions of the nitroxide radical, which forms either one (population 1) or two (population 2) hydrogen bonds with the water molecules. The difference of 400 ppm in the g-values is virtually identical to the difference observed for the corresponding singly and doubly hydrogen-bonded populations of the spin-labeled sites in the proteins. As for the spin-labeled proteins, the gzz, mI = ±1 EPR lines are broader than the gzz, mI = 0 line (FWHM 0.45 mT vs. 0.32 mT at 275 GHz), and different Azz values of the two populations are not resolved. Here the high resolution of EDNMR spectroscopy comes to help.
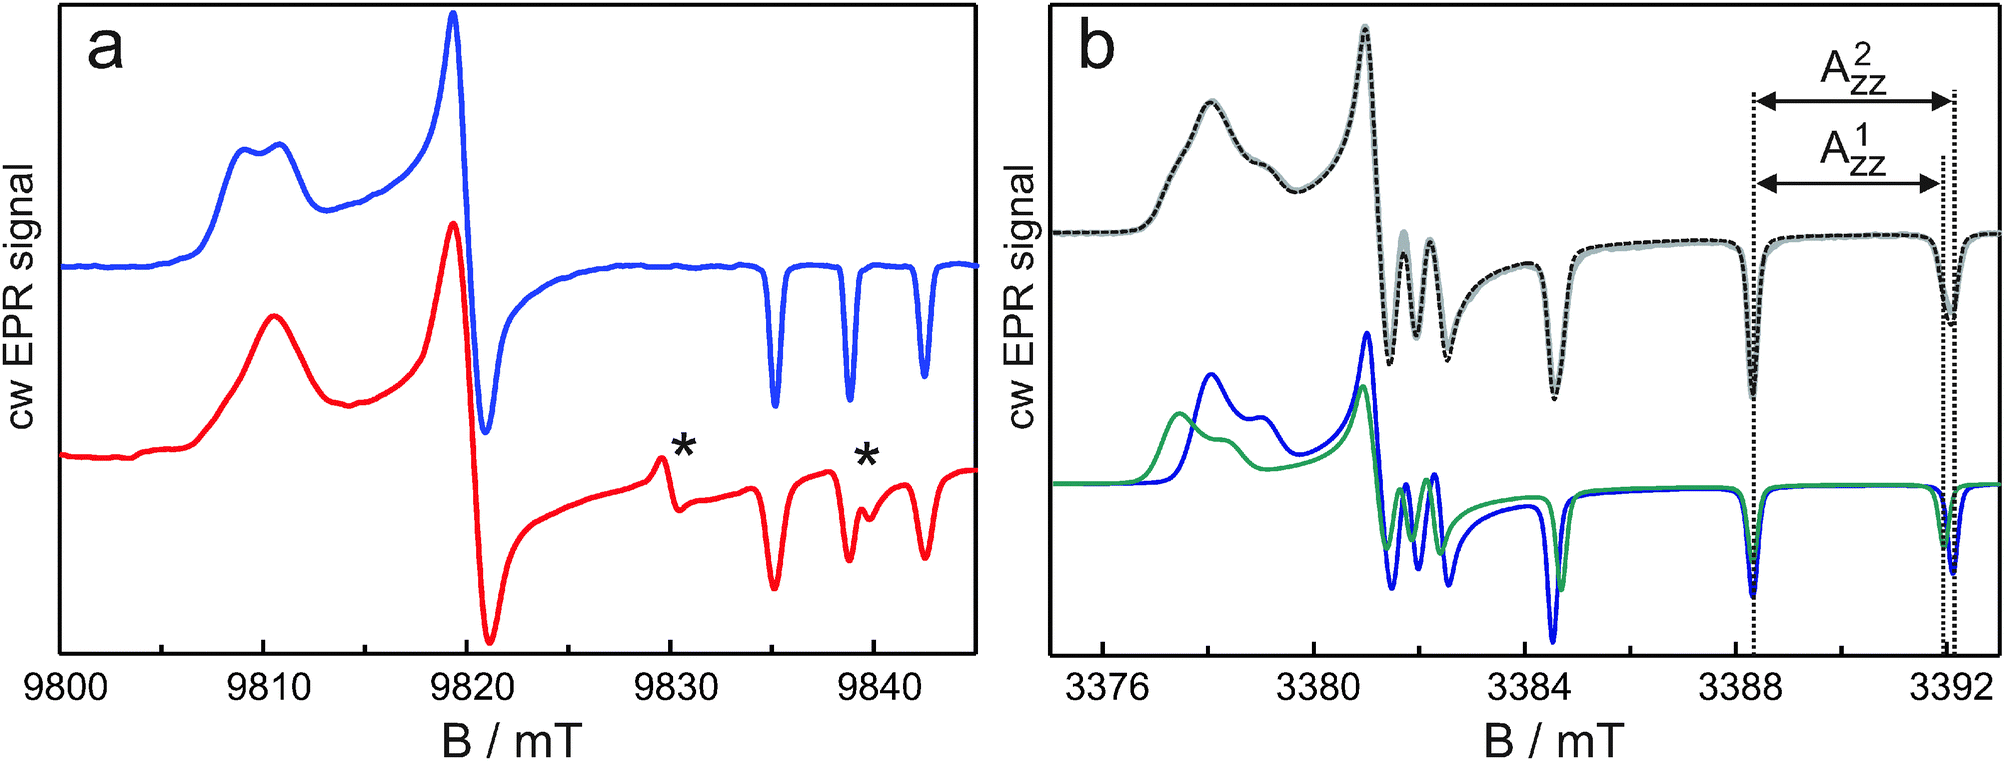 | ||
| Fig. 3 Continuous-wave EPR spectra: (a) at 275 GHz and 40 K of 1 mM R1-D16 in D2O–5 vol% glycerol-D8 (top) and of br129 (bottom), (b) at W-band (94.95 GHz) and 80 K of 1 mM R1-D16 in D2O–5 vol% glycerol-D8. The spectra at the top in (b) concern the experimental spectrum (gray line) overlaid with the calculated spectrum (dashed line) obtained by numerical solution of the spin Hamiltonian including the electron Zeeman, nuclear Zeeman, nitrogen-hyperfine and nitrogen-quadrupole interaction, making use of the experimentally determined EPR parameters and fractional weights of the two populations. The spectra at the bottom in (b) concern the calculated spectra of the individual populations. * indicates the location of two Mn2+ lines. | ||
Fig. 4 shows the W-band EDNMR spectra of R1-D16 in D2O with 5% (v/v) glycerol-D8. In the gzz, mI = −1 spectral region, the lines originating from forbidden single-quantum transitions, |mS = −1/2, mI = −1〉 → |1/2, 0〉 and |−1/2, 0〉 → |1/2, −1〉, are observed at positive frequencies Δν = ν2 − ν1. At the gzz, mI = −1 canonical field position, the lines are centered around the principal Azz/2 value. Instead of one pair of lines, however, two partially resolved pairs of lines of different intensities and positions are observed similar to the situation found previously for R1-D16 in 2-propanol.11 These pairs are assigned to two nitroxide populations with distinct Azz values. The EDNMR recordings at each magnetic field in Fig. 4a have been analysed by using four Gaussian lines (for more details concerning the data analysis, see ref. 11). Fig. 4b presents an example of such a fit. The analysis of the EDNMR spectrum yields A1zz = 101.6 ± 0.1 MHz (3.629 ± 0.005 mT) and A2zz = 106.0 ± 0.1 MHz (3.786 ± 0.005 mT) with spectral weights of the two nitroxide populations of 0.34 ± 0.02 and 0.66 ± 0.02, respectively. Additionally, the 14N quadrupole parameters, Pzz, have been obtained for the two sub-ensembles, P1zz = −1.54 ± 0.05 MHz and P2zz = −1.49 ± 0.05 MHz. The data obtained from the analysis of the EDNMR spectra quantitatively describe the cw EPR spectrum. Numerical calculation of the W-band cw EPR spectrum of R1-D16 as the sum of two spectra corresponding to two populations with their experimentally determined weights and EPR parameters (g values, nitrogen-hyperfine and quadrupole values, and an orientation dependent line width) yields a spectrum virtually identical to the experimental one (Fig. 3b).
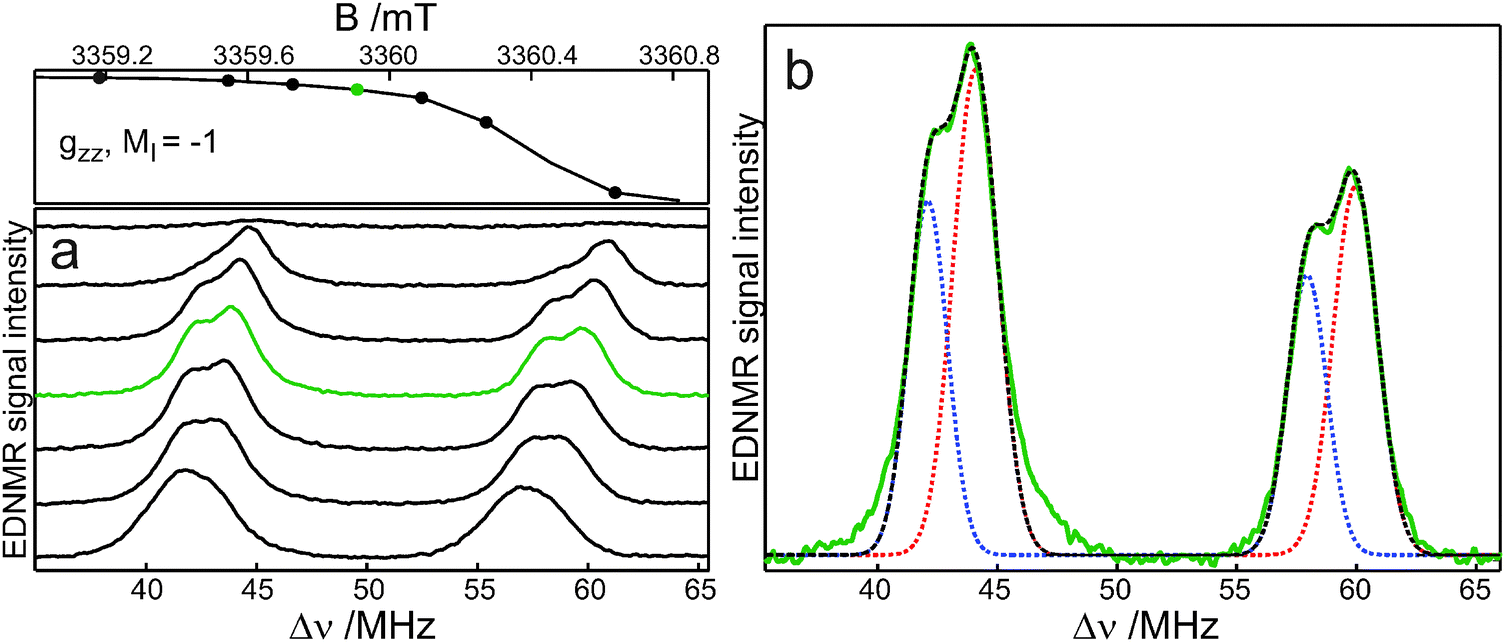 | ||
| Fig. 4 W-band (94.02 GHz) EDNMR spectra of 1 mM R1-D16 in D2O–5 vol% glycerol-D8 at 50 K acquired in the gzz, mI = −1 spectral region: (a) at the magnetic-field positions indicated by dots, (b) at the field position marked in green, including the best fit of this spectrum by two Gaussians. | ||
The A1zz and P1zz values, which are assigned to the nitroxide radical hydrogen bonded to a single water molecule, are close to those observed for the hydrogen-bonded fraction of nitroxide radicals in 2-propanol (99.6 MHz, −1.62 MHz)11 and glycerol (101.4 MHz, −1.59 MHz).10 The A2zz value is significantly larger than in alcohols where a single hydrogen bond is formed10,11 and, thus, is assigned to the nitroxide radicals hydrogen bonded to two water molecules. This assignment is in agreement with the outcome of molecular-dynamics simulations, which predict the formation of one and preferentially two hydrogen bonds for a nitroxide spin probe in water, with a stepwise increase of Azz as compared to the bare nitroxide.19 Additionally, the quadrupole value P2zz is lower than P1zz, supporting the assignment of the second fraction.10
As noticed above, also for the spin-labeled protein sites the gzz, mI = ±1 lines are significantly broader than the gzz, mI = 0 line (Fig. 1). The observation of populations with distinct Azz/Pzz values for R1 in water suggests that also for the protein sites the broadening results from the overlap of lines corresponding to differently hydrogen-bonded species. We infer that both the sub-structure in the gxx region and the different width of the Azz lines in the 275 GHz EPR spectra point to the presence of distinct populations of spin labels, which differ in the extent of hydrogen bonding. In Fig. 5a, the fractions of the populations, as obtained from the analysis of the gxx region of the 275 GHz cw EPR spectrum, are represented as a function of 〈gxx〉. The 〈gxx〉 values have been obtained as the first moment of the EPR spectrum between 9.8000 T and 9.8150 T. In this way we are independent of the Gaussian decomposition. Alternatively, we have calculated the 〈gxx〉 value according to fr0·g0xx + fr1·g1xx + fr2·g2xx. These values are virtually identical (cf.Table 1), which underscores the quality of the Gaussian fits. Fig. 5a shows that the fraction of doubly hydrogen-bonded spin labels decreases with increasing 〈gxx〉, the fraction of non-hydrogen-bonded spin labels increases with increasing 〈gxx〉, and the fraction of singly hydrogen-bonded spin labels goes through a maximum. This course of the fractions reflects the shift of the protonation equilibria. Interestingly, the plot of the fractions as a function of 〈Azz〉 in Fig. 5b shows large similarity with Fig. 5a. The increase of 〈gxx〉 and the decrease of 〈Azz〉 correlate similarly with the change in the composition, which supports the interpretation that both gxx and Azz are primarily determined by hydrogen bonding. The increase of gxx and the decrease of Azz going from two to one to zero hydrogen bonds are in line with theoretical predictions.19 In addition, not only the values of g2xx but also of 〈Azz〉 support the interpretation of population 2 as doubly hydrogen bonded spin labels. When fr2 is large, for br166 and br129 herein and for a number of other protein sites studied at 95 GHz,2 the value of 〈Azz〉 is larger than 3.63 mT. This value, observed in water, is the maximum value of Azz observed for singly hydrogen-bonded nitroxides, which means that doubly hydrogen-bonded spin labels have to be present to get an average value larger than 3.63 mT. In this analysis it remains an open question which potential hydrogen-bond donors qualify for the doubly hydrogen-bonded spin labels.
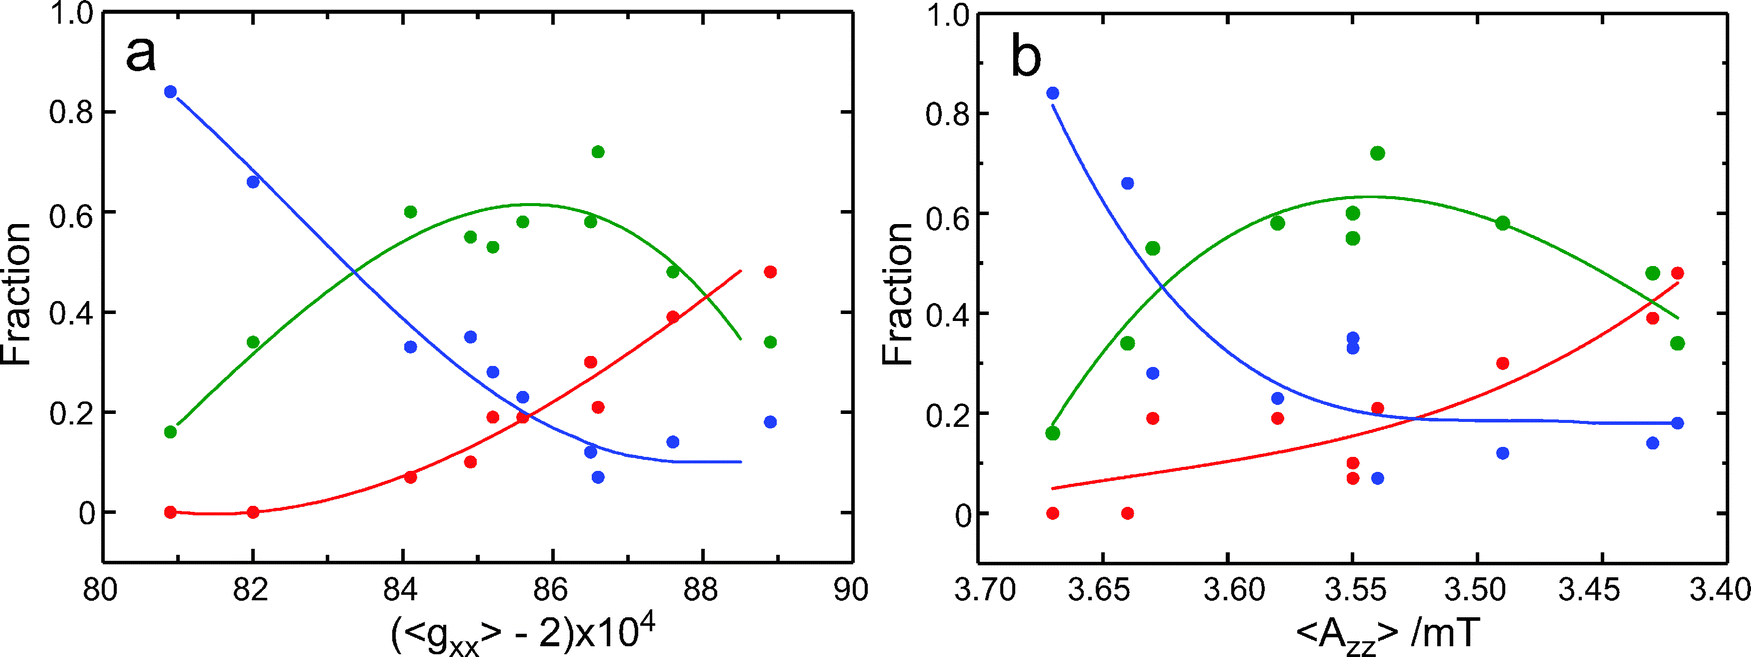 | ||
| Fig. 5 Fractions (fr0 red, fr1 green, fr2 blue) as a function of 〈gxx〉 (a) and of 〈Azz〉 (b). The dots represent the experimental values of the fractions as determined from the analysis of the gxx region of the cw EPR spectra at 275 GHz. The lines only serve as a guide to the eye. | ||
We summarize that the increase of 〈gxx〉 and the decrease of 〈Azz〉 follow the availability of proton donors, i.e., the proticity of the micro-environment at the spin-labeled protein site. This insight offers a description for the linear variation of 〈gxx〉 with 〈Azz〉 commonly derived from low-frequency cw EPR spectra. As shown in Fig. 6, the data for the spin-labeled protein sites at 275 GHz also follow this behavior. The line that corresponds to the best linear fit of these data virtually coincides with the line that corresponds to the best linear fit to the data for the free nitroxide radical R1 in frozen solutions of (non-)hydrogen-bonding solvents. The slope of the variation of the average parameter 〈gxx〉 for the spin-labeled protein sites is much larger than the slope of gixx for the individual components. The small variation of each gixx reflects the small variation from one protein site to the other of the gxx value of the spin label carrying a definite number of hydrogen bonds. The large variation of 〈gxx〉 mostly reflects the variation in proticity from one protein site to the other.
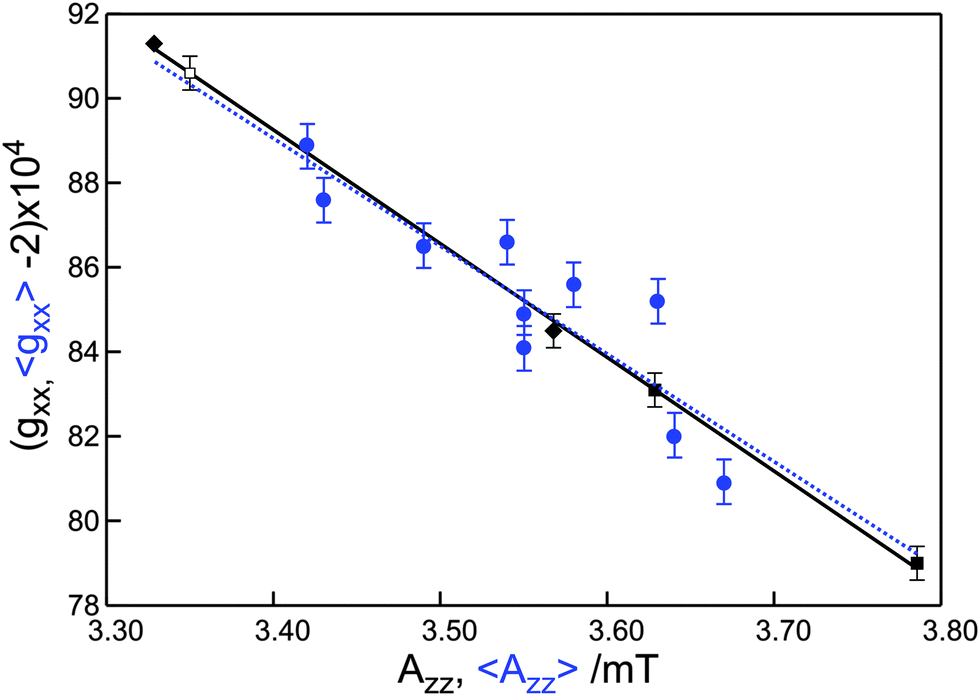 | ||
| Fig. 6 Plot of gxx as a function of Azz. The blue dots represent the average values 〈gxx〉 and 〈Azz〉 for the spin-labeled protein sites (cf.Table 1). The black dots represent values of gixx and Aizz for the free nitroxide radical R1 in frozen water (■, i = 1, 2), 2-propanol (◆, i = 0, 1),11 and ortho-terphenyl/benzene (□, i = 0).11 The dashed and solid lines with slopes of −2.6 ± 0.5 T−1 and −2.69 ± 0.05 T−1 represent the best linear fits to the experimental data for the spin-labeled protein sites and the nitroxide radical, respectively. | ||
Conclusion
Continuous-wave 275 GHz EPR has provided the g-resolution necessary to achieve an unequivocal analysis of the gxx region of the spectrum of spin-labeled proteins in terms of the contributions of three distinct populations. For ten samples of spin-labeled membrane proteins we have determined the fraction of each population and the corresponding gxx value.The populations correspond to spin labels that carry no, one and two hydrogen bonds. The gxx value of each population varies hardly from site to site, while the fractions of the different populations do. The change of 〈Azz〉 from one to the other protein site follows the extent of hydrogen bonding. The 〈gxx〉 and 〈Azz〉 values both reflect the local proticity.
The cw EPR spectra present no clue as regards the nature of the hydrogen-bond donors. Both protein (amide and hydroxyl) and water protons qualify and it would be most relevant for a better functional understanding to identify the site-specific proton donors. In a recent study, a first attempt was made to disentangle the sources of protons involved in hydrogen bonding.3 Further progress requires the combination of cw and pulsed EPR studies with molecular-dynamics simulations.
Acknowledgements
R1 was kindly provided by Herbert Zimmermann (Max-Planck Institute for Medical Research, Heidelberg). The research was supported with financial aid by the Netherlands Organization for Scientific Research (NWO), project DN63-248 (A Dutch-German Cross-Border Initiative in Biosciences). Financial support by the Deutsch Forschungsgemeinschaft (DFG) is gratefully acknowledged (SFB 944; STE 640/6-2; MO 132/19-2), as is continued support by the Max Planck Gesellschaft and Freie Universität Berlin.References
- H. J. Steinhoff, A. Savitsky, C. Wegener, M. Pfeiffer, M. Plato and K. Möbius, Biochim. Biophys. Acta, 2000, 1457, 253 CrossRef CAS
.
- E. Bordignon, H. Brutlach, L. Urban, K. Hideg, A. Savitsky, A. Schnegg, P. Gast, M. Engelhard, E. J. J. Groenen, K. Möbius and H. J. Steinhoff, Appl. Magn. Reson., 2010, 37, 391 CrossRef
- L. Urban and H. J. Steinhoff, Mol. Phys., 2013, 111, 2873 CrossRef CAS
- M. A. Ondar, O. Y. Grinberg, A. A. Dubinskii, A. F. Shestakov and Y. S. Lebedev, Khim. Fiz., 1983, 2, 54 CAS
- M. A. Ondar, O. Y. Grinberg, A. A. Dubinskii and Y. S. Lebedev, Sov. J. Chem. Phys., 1985, 3, 781 Search PubMed
- J. S. Hwang, R. P. Mason, L.-P. Hwang and J. H. Freed, J. Phys. Chem., 1975, 79, 489 CrossRef CAS
- R. Owenius, M. Engström, M. Lindgren and M. Huber, J. Phys. Chem. A, 2001, 105, 10967 CrossRef CAS
- M. Plato, H. J. Steinhoff, C. Wegener, J. T. Törring, A. Savitsky and K. Möbius, Mol. Phys., 2002, 100, 3711 CrossRef CAS
- Z. Ding, A. F. Gullá and D. E. Budil, J. Chem. Phys., 2001, 115, 10685 CrossRef CAS PubMed
- A. Savitsky, A. A. Dubinskii, M. Plato, Y. S. Grishin, H. Zimmermann and K. Möbius, J. Phys. Chem. B, 2008, 112, 9079 CrossRef CAS PubMed
- A. Nalepa, K. Möbius, W. Lubitz and A. Savitsky, J. Magn. Reson., 2014, 242, 203 CrossRef CAS PubMed
- H. Brutlach, E. Bordignon, L. Urban, J. P. Klare, H.-J. Reyer, M. Engelhard and H. J. Steinhoff, Appl. Magn. Reson., 2006, 30, 359 CrossRef CAS
- A. A. Wegener, I. Chizhov, M. Engelhard and H.-J. Steinhoff, J. Mol. Biol., 2000, 301, 881 CrossRef CAS PubMed
- M. Pfeiffer, T. Rink, K. Gerwert, D. Oesterhelt and H.-J. Steinhoff, J. Mol. Biol., 1999, 287, 163 CrossRef CAS PubMed
- H. Blok, J. A. J. M. Disselhorst, S. B. Orlinskii and J. Schmidt, J. Magn. Reson., 2004, 166, 92 CrossRef CAS PubMed
- K. Möbius, A. Savitsky, A. Schnegg, M. Plato and M. Fuchs, Phys. Chem. Chem. Phys., 2005, 7, 19 RSC
- H.-J. Steinhoff, N. Radzwill, W. Thevis, V. Lenz, D. Brandenburg, A. Antson, G. Dodson and A. Wollmer, Biophys. J., 1997, 73, 3287 CrossRef CAS
- M. Pavone, P. Cimino, O. Crescenzi, A. Sillanpää and V. Barone, J. Phys. Chem. B, 2007, 111, 8928 CrossRef CAS PubMed
- M. Pavone, A. Sillanpää, P. Cimino, O. Crescenzi and V. Barone, J. Phys. Chem. B, 2006, 110, 16189 CrossRef CAS PubMed
| This journal is © the Owner Societies 2014 |