 Open Access Article
 This Open Access Article is licensed under a
 Creative Commons Attribution 3.0 Unported Licence
C K-edge NEXAFS spectra of graphene with physical and chemical defects: a study based on density functional theory†
Christopher
Ehlert
ab,
Wolfgang E. S.
Unger
*a and
Peter
Saalfrank
*b
aBAM Bundesanstalt für Materialforschung und –prüfung, D-12203 Berlin, Germany. E-mail: wolfgang.unger@bam.de
bUniversität Potsdam, Institut für Chemie, Karl-Liebknecht-Str. 24-25, 14476 Potsdam-Golm, Germany. E-mail: petsaal@uni-potsdam.de
First published on 23rd May 2014
Abstract
Recently, C K-edge Near Edge X-ray Absorption Fine Structure (NEXAFS) spectra of graphite (HOPG) surfaces have been measured for the pristine material, and for HOPG treated with either bromine or krypton plasmas (Lippitz et al., Surf. Sci., 2013, 611, L1). Changes of the NEXAFS spectra characteristic for physical (krypton) and/or chemical/physical modifications of the surface (bromine) upon plasma treatment were observed. Their molecular origin, however, remained elusive. In this work we study by density functional theory, the effects of selected point and line defects as well as chemical modifications on NEXAFS carbon K-edge spectra of single graphene layers. For Br-treated surfaces, also Br 3d X-ray Photoelectron Spectra (XPS) are simulated by a cluster approach, to identify possible chemical modifications. We observe that some of the defects related to plasma treatment lead to characteristic changes of NEXAFS spectra, similar to those in experiment. Theory provides possible microscopic origins for these changes.
1 Introduction
Graphene is a single layer of graphite, first manufactured and investigated in detail in 2004 by Novoselov, Geim and coworkers.1 This quasi two-dimensional material features a plethora of interesting electronic properties,2,3 which are promising for future applications, e.g., in nano-electronics.4One route towards applications is the functionalization of graphitic surfaces or graphene layers.5 A promising strategy is halogenation, e.g., bromination, since brominated HOPG (Highly Ordered Pyrolytic Graphite) surfaces are chemically reactive and versatile precursors to obtain alcohol or amine functional groups. The latter in turn serve to bind covalently, organic molecules for specific applications (see ref. 6 and references therein).
Recently, Lippitz et al.6 reported on a bromine plasma treatment of graphene-like HOPG. It was found that such treatment leads to modifications in the C K-edge NEXAFS spectra compared to pristine HOPG. Because NEXAFS is a reliable, surface-sensitive tool for investigations of the electronic structure of materials, NEXAFS spectra are valuable tools to also unravel surface modifications due to functionalization.
C K-edge NEXAFS spectra for pristine and Br-plasma treated HOPG surfaces of ref. 6 are reproduced in Fig. 1(a). The spectra arise from transitions from the C 1s orbital to various empty, bound final states. At the low-energy side, the NEXAFS spectrum of pristine HOPG shows a sharp resonance at a photon energy of 285.4 eV, corresponding to a C 1s → π* transition. A second dominant feature is the double-structured resonance around 292 eV, corresponding to C 1s → σ*. This double-resonance arises from excitonic (the sharp resonance at 291.8 eV) and band-like contributions (the broader signal at around 293 eV), according to ref. 8. Here, π* and σ* refer to antibonding molecular orbitals (more precisely: bands) of π and σ symmetry, respectively.
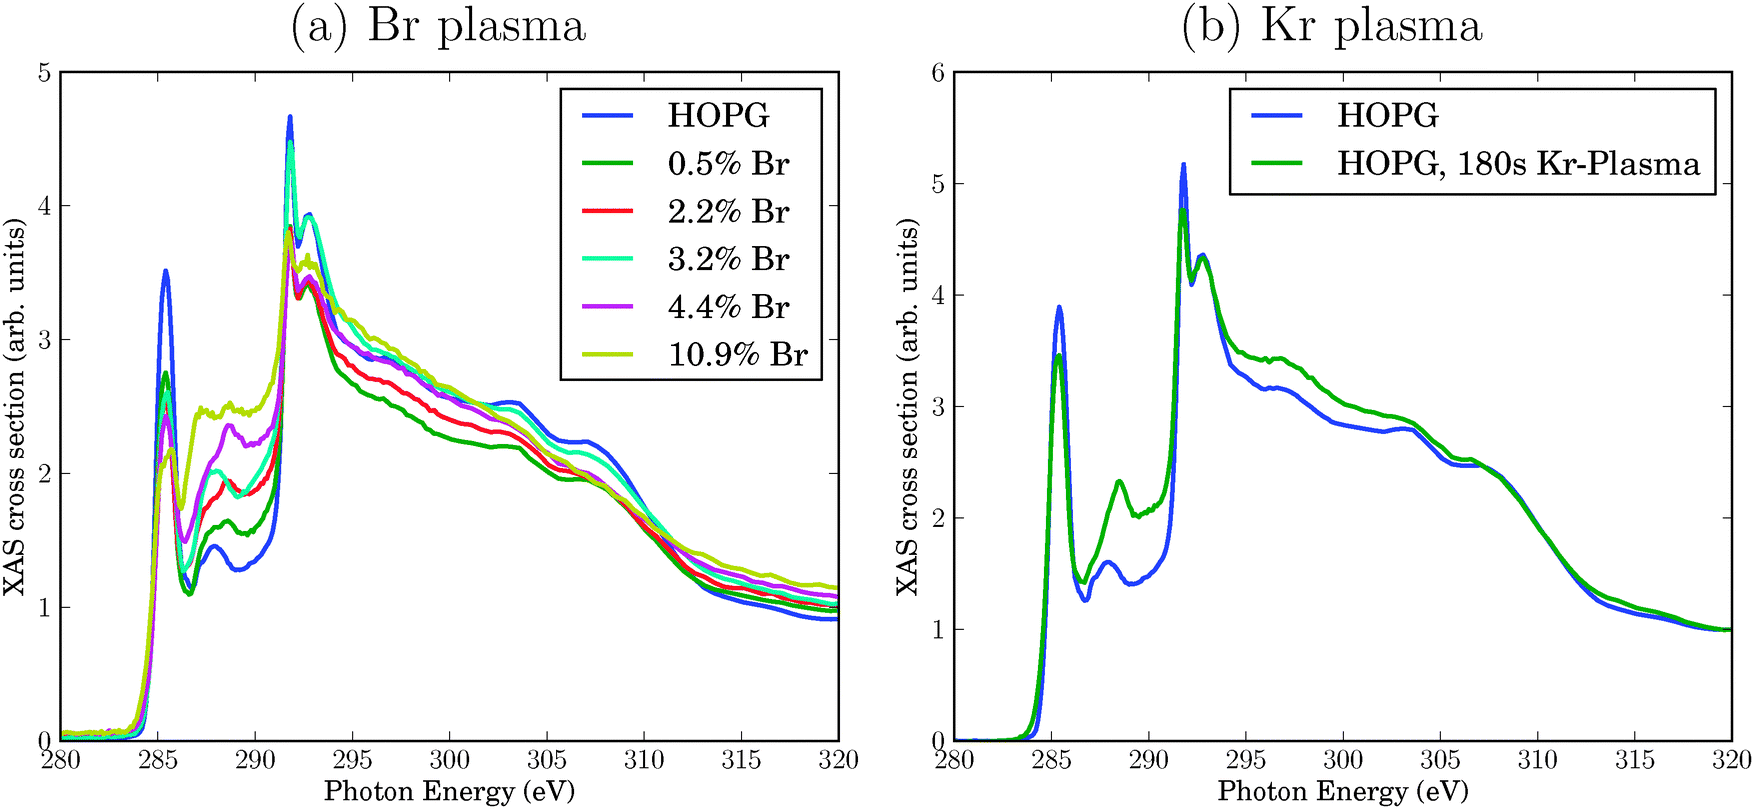 | ||
| Fig. 1 Experimental C K-edge NEXAFS spectra of HOPG, treated with a bromine plasma leading to variable Br concentrations determined by XPS (a), or a krypton plasma applied for 180 s (b), respectively.6 The spectra for the pristine material are always shown for comparison. All spectra have been normalized as usual to the absorption jump such that the intensity at a photon energy of 330 eV is 1.7 | ||
Upon bromination, the NEXAFS spectra change. The bromination with Br2 plasma in experiment was realized to different degrees, measured by Br atom percentages found by Br 3d XPS in ref. 6. In Fig. 1(a), different curves refer to different Br percentages. Specifically, the following changes were observed upon Br2 treatment:
• The π* signal decreases with increasing Br content. Simultaneously, the σ* resonance increases, however, to a lesser extent.
• New resonances arise between the π* and the σ* resonance, in the energy range between 286 eV and 290 eV. We shall sometimes call this region the “fingerprint” region in what follows.
• As a minor finding at very high Br concentrations, one observes a splitting of the π* resonance.
At this stage, the precise origin of these modifications is not known. In principle, Br plasma treatment can lead to physical effects (e.g., vacancy defects) or chemical effects (e.g., due to addition or substitution reactions involving bromine). To disentangle physical and chemical effects, in ref. 6 HOPG was also treated with a krypton plasma. Kr is chemically inert but may still cause physical damage. In Fig. 1(b), we compare the NEXAFS spectrum of pristine HOPG with a spectrum obtained after 180 s treatment with Kr plasma (see ref. 6 for details). Again, some characteristic changes are observed (we discuss changes only in the energy region up to about 294 eV in what follows):
• The intensities of π* and σ* resonance intensities decrease slightly.
• The biggest change is found in the “fingerprint” region between about 286 and 290 eV, where Kr plasma treatment leads to higher intensities. (Also, a shift of the feature from 287.9 eV (for HOPG), to 288.4 eV (for Kr-HOPG) is observed.)
In passing we note that all experimental spectra have been arbitrarily normalized such that the intensity at a photon energy of 330 eV is 1.7
Also here, the precise atomic/molecular origin of spectral changes is largely unknown. In what follows we examine by means of electronic structure calculations, the two possible causes by which plasma treatment of graphite surfaces can influence their NEXAFS signatures: physical modification by creation of point and line defects, and, in case of Br plasma treatment, additional chemical modification by substitution and addition reactions of Br atoms. In both cases the hybridization of C atoms may change, from sp2 to sp3, and also the chemical environment will be affected, resulting in new spectral features.
In order to account for physical effects, we shall consider a single (graphene) layer, adopting models for various defect types whose character and energies have recently been investigated by density functional theory and by experiment in ref. 9. We note that related work exists in the literature where NEXAFS spectra of graphene nano-sheets have been measured before and after treatment with an acid, which also introduces defects by bond cleavage in the C–C network.10 In this work, electronic structure calculations (density-of-state curves) have been used to rationalize the experimental findings. Furthermore, Schiros et al.11 measured and calculated the NEXAFS resonances of nitrogen-doped graphene. However, a detailed discussion of various types of defects and notably their impact on NEXAFS spectra, is still elusive. We shall further study models containing bromine, in order to make contact to the Br plasma experiments.
The paper is organized as follows. In the next Section 2 we shall describe details of the theoretical models, which are all based on density functional theory to calculate C K-edge NEXAFS spectra (and Br 3d XP spectra). In Section 3 and 4 results will be presented and discussed, first for NEXAFS of a single defect-free graphene layer as a reference, then for graphenes with “physical defects” and finally “chemical defects” involving bromine, respectively. A final Section 5 summarizes and concludes this work.
2 Computational details
In general, one can use two different approaches to characterize the electronic structure of graphene and defective variants of it. The first is based on a local cluster model, where molecular representatives are adopted to mimick a graphene layer (see, for example, ref. 12 and 13). Clearly, this introduces unwanted edge effects due to cutting of C–C bonds and saturation with H atoms. The second approach uses periodic boundary conditions instead (see, for example14–16). In this way artificial boundaries are avoided, however, large unit cells may be necessary to model low-density defects and/or to avoid repeated interactions between defects. In what follows, we shall use periodic models for NEXAFS spectra, using large unit cells. For brominated species we will also compute Br 3d ionization potentials to obtain peak positions of X-ray Photoelectron Spectra (XPS), via cluster models.2.1 C K-edge NEXAFS spectra
For NEXAFS spectra, all calculations are based on periodic density functional theory (DFT) within the Kohn–Sham scheme,17 along with plane wave bases and pseudopotentials. Calculations were performed with the Quantum ESPRESSO program.18 The generalized gradient-corrected exchange–correlation functional Exc due to Perdew, Burke, Ernzerhof (PBE) was used,19 and a plane-wave energy cutoff Vc = 60 Ry was adopted.Two different types of atomic pseudopotentials were utilized (as described in http://www.quantum-espresso.org). For “normal” C, as well as H and Br we adopted norm-conserving pseudopotentials of the Martins–Troullier type (keywords C.pbe-mt_gipaw.UPF, H.pbe-mt_fhi.UPF and Br.pbe-mt_fhi.UPF, respectively).20 To determine C K-edge spectra, we also adopt special pseudopotentials for the C atoms of interest, which contain a C 1s core hole (keyword C.star1s-pbe-mt_gipaw.UPF). This latter procedure corresponds roughly to replacing a neutral C pseudopotential by an N-like pseudopotential, and considering five instead of four valence electrons for the target atom. As a consequence, the supercell remains uncharged. All calculations are done in spin-unpolarized fashion, even for odd numbers of electrons.
For our graphene models, we used 7 × 7 supercells in a slab geometry, with individual layers separated along the perpendicular direction by a large vacuum gap of 15 Å. A defect-free elementary cell contains 98 C atoms. Four different types of “physical defects” were considered: (1) a Stone–Wales defect, (2) a single-vacancy defect, (3) a double-vacancy defect, and (4) a line-defect. Defects (1) and (3) can be realized by all-C models, while (2) and (4) contain also saturating H atoms. Further, two different “chemical defects” containing both H and up to two Br atoms in addition to C, were considered. We optimized the geometry and the cell parameters for all models at the Γ point (i.e., using a single k-point). Structures will be displayed below.
To obtain NEXAFS spectra, we adopted a pseudopotential-based, iterative procedure as suggested elsewhere.21 Accordingly, the X-ray absorption cross section is calculated from the Golden Rule expression
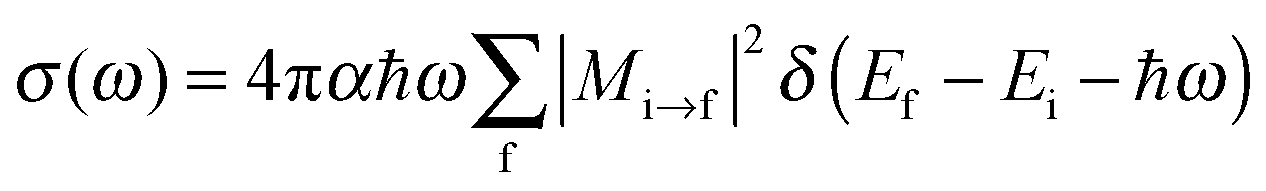 | (1) |
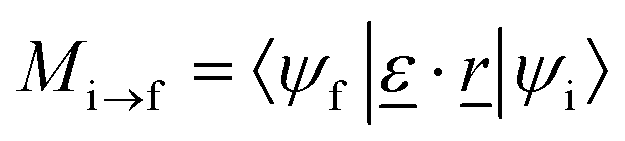 | (2) |
 is the polarization vector of the photon beam.
In our case, ψi is a core state, i.e., a C 1s orbital which can be reconstructed from the ground state density and non-core excited pseudopotentials (see below). Further, ψf is a final state, i.e., an excited empty state obtained from solving the Kohn–Sham equations in which the pseudopotential for the one C-atom of interest has been replaced by the special pseudopotential with a C 1s core hole. The explicit, direct calculation of all possible final states at every k-point can be costly. We therefore use a two-step procedure. First, the charge density, with the core-hole pseudopotential for one C-atom is obtained by directly solving the Kohn–Sham equations self-consistently, on a 4 × 4 Monkhorst k-point grid.22 In a second step, an iterative procedure based on a Lanczos recursion method as suggested in ref. 21 is used, to determine empty final states iteratively, adopting a denser Monkhorst k-point grid, 10 × 10.
This method is implemented in the XSpectra program23 as used here, and which also gives the cross section σ as a function of photon energy. The program computes transition amplitudes Mi→f from all-electron functions ψi and ψf. How the latter can be reconstructed when PAW-type (Projected Augmented Wave) pseudopotentials24 are used, is described in detail in ref. 21. Also a broadening factor γ has to be specified to represent the delta functions in eqn (1), which we choose as γ = 0.2 eV throughout. Finally, since the final and initial state energies have been calculated from (different) pseudopotentials, the computed spectra were shifted such that the theoretical C 1s → π* resonance for pristine graphene coincide with the experimental value, of 285.4 eV. Note that in our approach many-body corrections to Kohn–Sham energies25 or electron–phonon couplings are absent, however, for a comparative study of similar systems we expect this method to be sufficiently accurate.
2.2 Br 3d XP spectra
In NEXAFS, the final states are bound in contrast to XPS where they are part of the ionization continuum. The XPS measurements of ref. 6 on Br plasma treated species are not only useful to monitor the Br content of samples, but also to unravel structural details. To make contact to experiment, we have also simulated XP (Br 3d) spectra for brominated graphene models, using the Δ-Kohn–Sham (Δ-KS) method.26 Cluster (rather than periodic) models for XP spectra are adopted in this case, to determine core ionization potentials| IPi = Eion(i) − Eneu. | (3) |
Here, Eion(i) is the energy of a cation obtained after removing an electron from a 3d orbital of a Br atom (i is a combined orbital and atom index). Eneu is the energy of the neutral cluster. In order to compute these quantities, we applied the Δ-KS methodology as implemented in the StoBe program.27 In a preparation step, a neutral cluster model comprising C, Br, and H atoms was geometry-optimized with Gaussian09,28 using the PBE exchange–correlation functional, the D3 dispersion29 energy correction, and a 6-311G** atomic orbital basis set.30 Using this geometry, two separate KS calculations were done with StoBe. First, the energy Eneu of the neutral cluster was recalculated with the PBE xc-functional, using now an effective core potential for C atoms together with the corresponding triple-ζ basis set as implemented in StoBe, an effective core potential for Br atoms (with 18 core electrons), and its corresponding double-ζ basis set. For H, a double-ζ basis set was used. In a second step, the cation and Eion(i) was self-consistently determined by an unrestricted KS (UKS) calculation, by adopting the so-called “supersymmetry” option to remove an electron from a selected 3d-orbital of a selected Br atom and preserving this occupation pattern during the entire SCF procedure. The obtained ionization potentials are interpreted as peak positions of XP spectra of brominated graphene. Note that our approach yields no XPS intensities. Also, spin–orbit splitting of Br 3d orbitals is neglected.
3 Results and discussion
3.1 Single, defect-free graphene sheet
First, we present the theoretical NEXAFS spectrum of a single sheet of graphene and compare it with experiment6 in Fig. 2(a). To make this comparison more meaningful, the theoretical and experimental spectra were normalized such that the maximum intensity of the resonance feature at 285.4 eV is 1.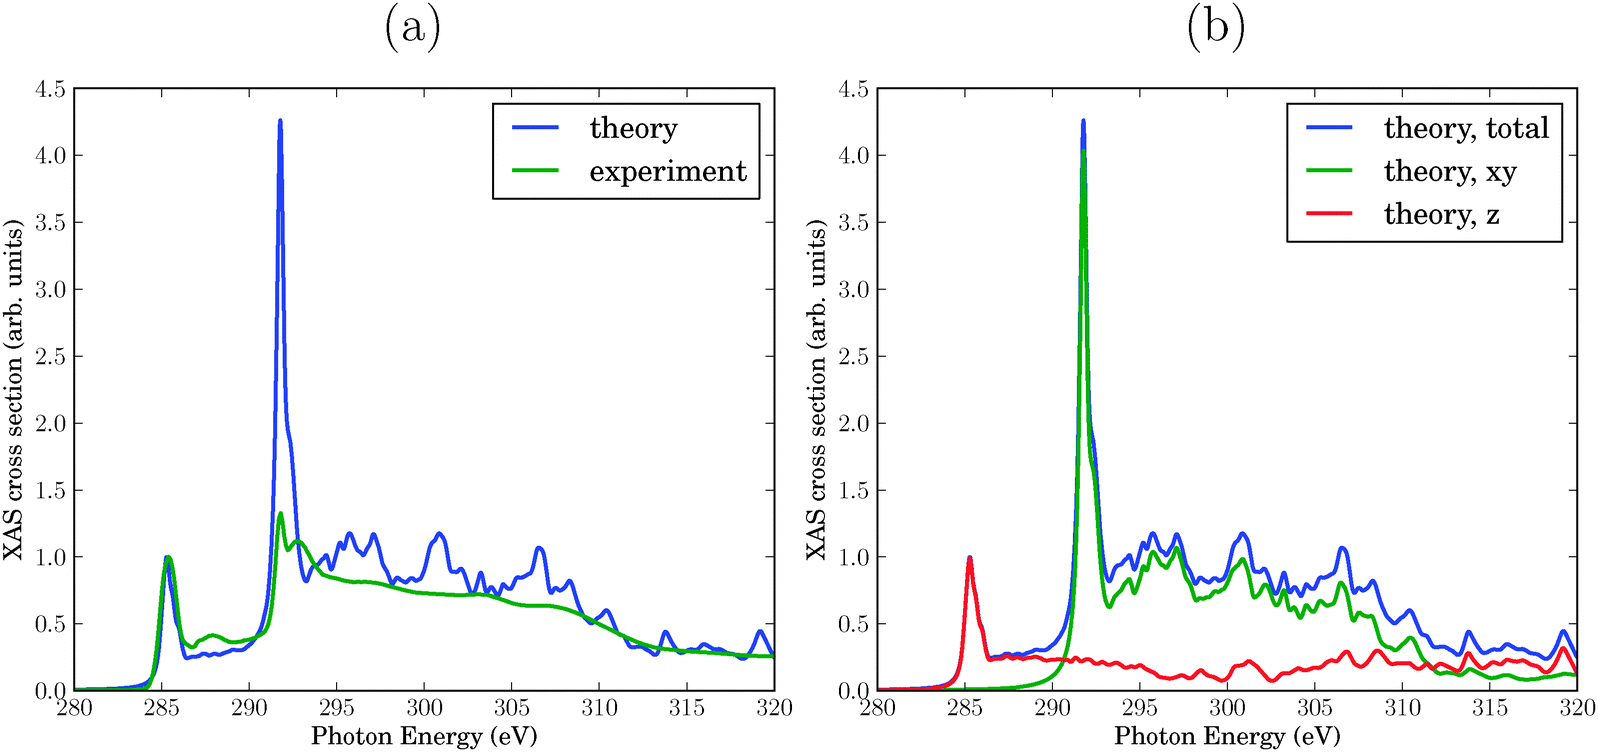 | ||
| Fig. 2 (a) Calculated NEXAFS spectrum of graphene compared to experiment. The theoretical curve was obtained with a constant broadening factor γ = 0.2 eV. Both spectra are normalized such that the intensity is 1 for the π* resonance at 285.4 eV. (b) Theoretical spectrum: in-plane (“xy”) and out-of plane (“z”) contributions to the total NEXAFS spectrum. | ||
The resonance at 285.4 eV represents the C 1s → π* excitation. Experiment and theory agree here well by construction with respect to intensity and position. Also the width fits very well. The nature of this resonance as being due to C 1s → π* transitions is proven by the fact that the in-plane contribution (x,y) to the cross section is practically zero, while the out-of-plane contribution (z) makes the entire spectrum. This can be seen from “polarized” results in Fig. 2(b).
The second interesting photon energy interval is between 286 eV and 289 eV, the energy range which is known to be sensitive to chemical modifications of graphene or graphite surfaces10,31 (the “fingerprint” region of above). Both in experiment and theory spectral features with weak intensity appear there, more clearly so in experiment than in theory. These features are also mostly due to C 1s → π* excitations, as evident from the polarized spectra in Fig. 2(b).
The third photon energy interval we wish to discuss is around 292–293 eV, which corresponds to the lowest-energy C 1s → σ* excitation. The σ-character can be seen from the (x,y) (in plane) polarization of the signal, cf.Fig. 2(b). Note that location and overall width of the theoretical, σ* resonance agrees with the experimental one, however, the double-resonance structure is hardly apparent in theory. Most strikingly, the intensity of this resonance is too high. It must be noted, however, that the intensity is a function of the broadening parameter adopted in the calculation. We will also see that the intensity of this resonance depends sensitively on the presence of defects. By using fixed broadening and “absolute” signals from now on, we hope to elucidate meaningful trends emerging from various models of defective graphene.
Further excitations arise in the energy range between 295 eV and 330 eV, again both in theory and experiment. The polarized calculations show that these are both of σ- (in-plane) and π- (out-of-plane) character. According to Fig. 2(b), the σ-character dominates up to about 312 eV, and the π-character at photon energies above.
With the present choice of the broadening γ, the theoretical spectrum appears to be more structured than experiment, cf.Fig. 2(a). Of course, using a larger (or energy-dependent) broadening factor would improve agreement between theory and experiment, but we refrain here from adapting γ.
In summary, the theoretical spectrum is in reasonably good agreement with experiment, with the exception of a too intense σ* resonance at around 292 eV.
3.2 “Physical” defects
We now study the effect of “physical” structural defects in graphene on C K-edge NEXAFS spectra. We shall consider the four defect types as described later in this section, which are selected based on energy criteria as outlined in earlier work.9 In our case those physical defects originate from the bombardment of graphene surface by plasma particles. The energy of these “projectiles” is sufficiently high not only to break bonds but also to sputter atoms out of the graphene lattice. As mentioned above, all structures below are fully geometry-optimized on the PBE Kohn–Sham level of theory.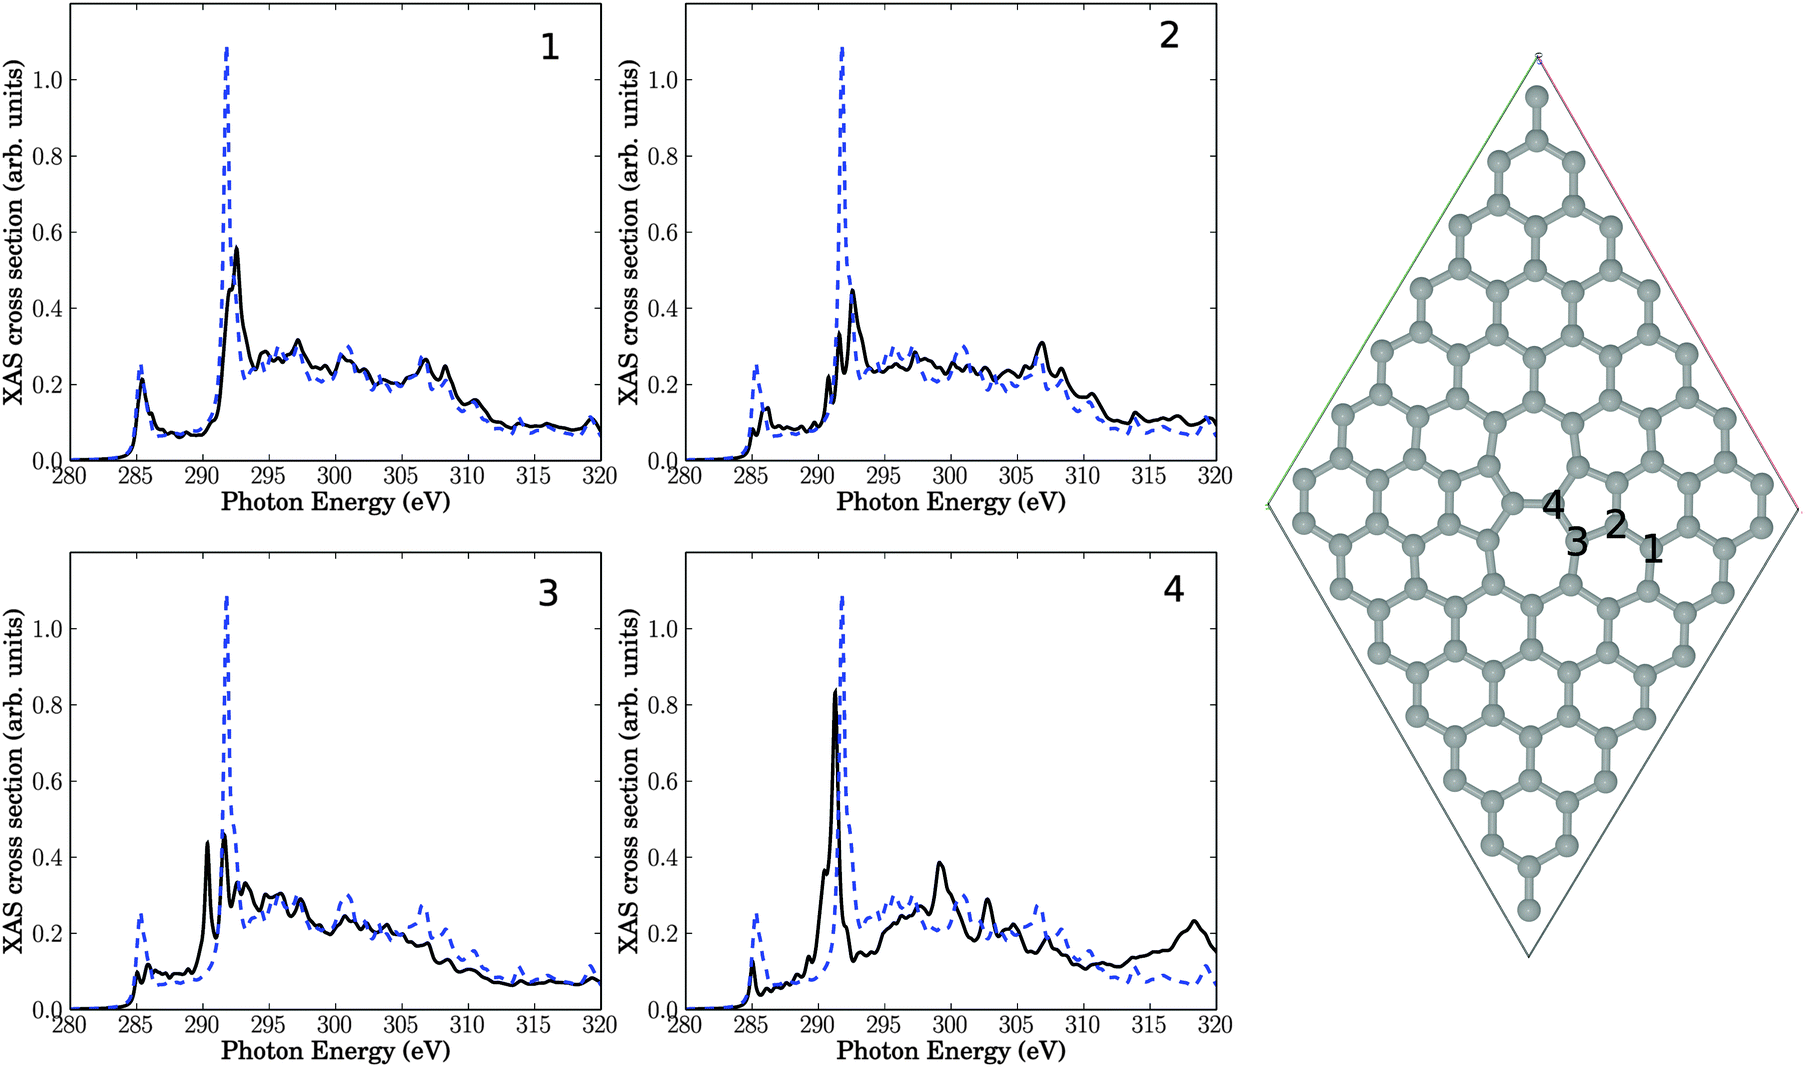 | ||
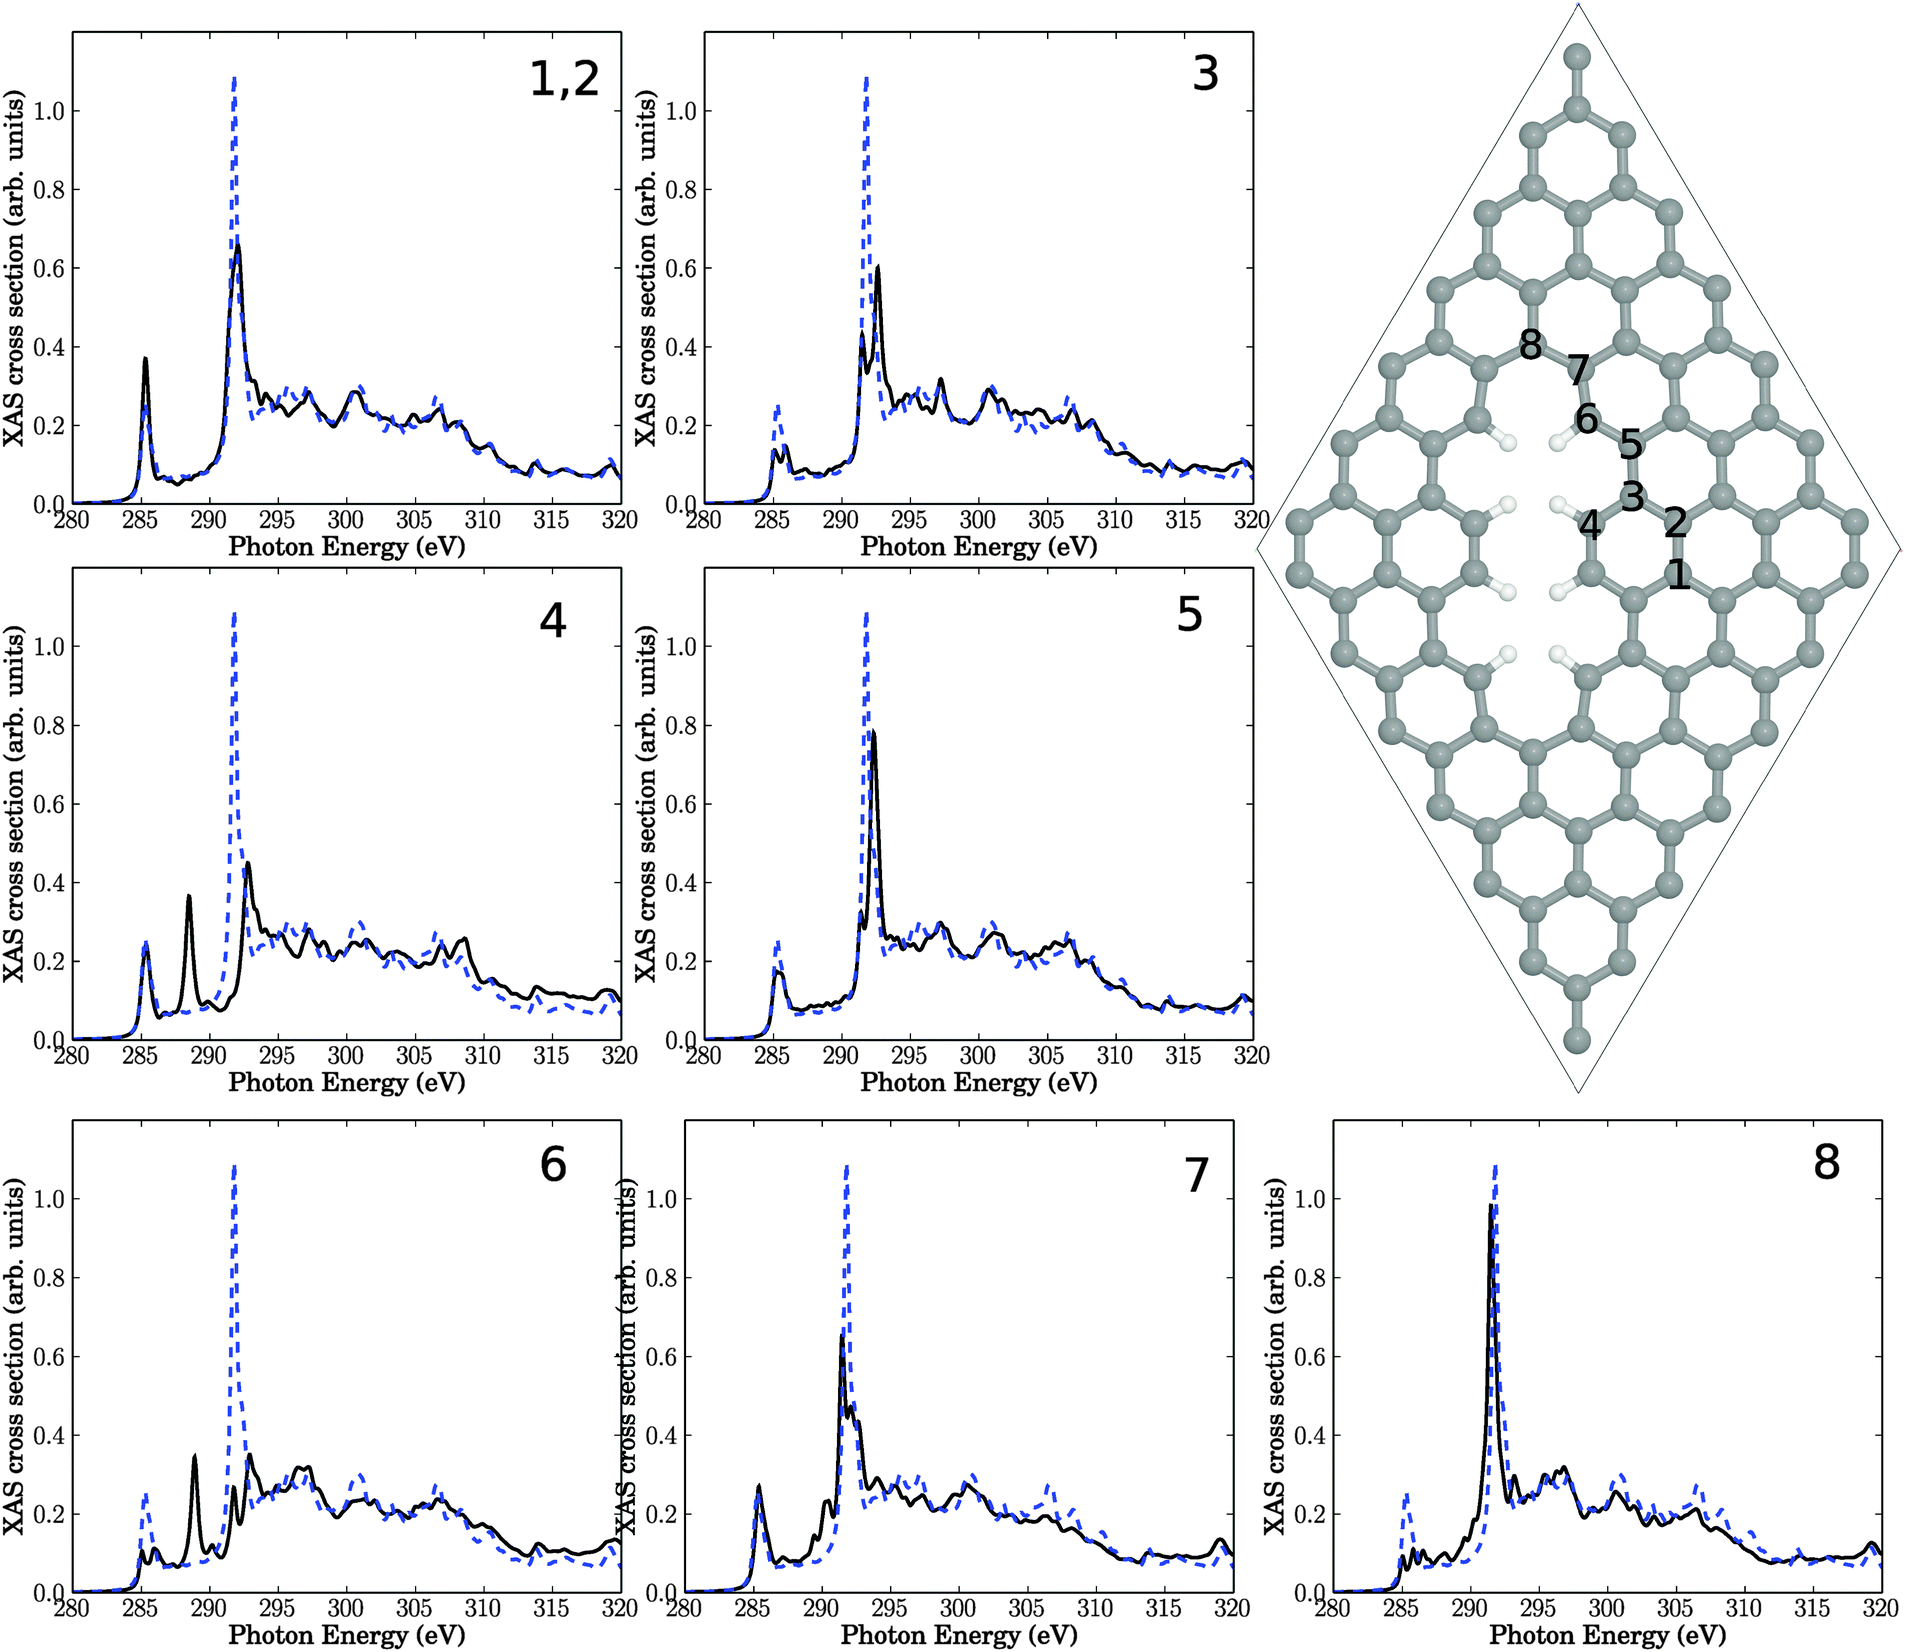
| Fig. 3 Right: Stone–Wales (55–77) defect in a 7 × 7 cell. The four panels show NEXAFS spectra corresponding to core-hole creation in atoms 1–4, located close to the defect (see atom numbering). Full, black lines: computed NEXAFS spectra, dashed, blue lines: the theoretical spectrum of unperturbed graphene for comparison. | ||
Also depicted in the figure are four NEXAFS spectra, corresponding to excitation out of the C 1s orbital of either C atom 1, 2, 3, or 4. These C atoms are located in the center of three 6-rings (atom 1), two six-rings and one five-ring (atom 2), one six-ring, one five-ring and one seven-ring (atom 3), and one five-ring and two seven-rings (atom 4), respectively. Atom number 4 is in the center of the defect, while atoms 3, 2 and 1 are increasingly remote from the defect center. For comparison, in every spectrum the theoretical NEXAFS spectrum for defect-free graphene is shown. In contrast to Fig. 2, we give absolute, non-rescaled XAS cross sections from now on. In an actual experiment, the resulting spectrum would be the average over all C atoms in the cell.
The first observation is that all spectra look different. This is evidence for the sensitivity of NEXAFS to the chemical environment of an atom. We notice that the character of the spectra changes the closer the atom is to the defect center. Nevertheless, even in the case of atom 1 (with the same local environment as in defect-free graphene), the NEXAFS spectrum looks different from pure graphene, indicating effects beyond nearest neighbours.
The π* resonance, located for unperturbed graphene at 285.4 eV is observable in all four spectra. However, the intensity of this resonance is reduced, except for atom 1 which is farthest away from the defect. The intensity decreases the nearer the atom to the center of the defect is. We also observe a splitting of that resonance for atoms 2 and 3.
New resonances arise in the region between 286.8 eV and 290.8 eV in some cases. Recall that this “fingerprint” region is the range where changes of NEXAFS spectra were found after krypton treatment. Especially atom numbers 3 and 4, which are close to the defect, show new absorption features near 290.3 eV. Closer analysis shows that the two resonances slightly above 290 eV for atom 3, for example, are both of σ symmetry, i.e., the original σ* signal is shifted to lower photon energies and splits. The splitting may be explained by the fact that C atom 3 has now (three) slightly different C–C bondlengths to neighbour atoms, hence, at least in a localized picture different σ* orbital energies emerge. The shift to lower photon energies could be a result of the fact that most of the bonds around C3 are elongated w.r.t. defect-free HOPG (1.42 Å), leading to a smaller σ–σ* splitting and hence a lower final-state energy. It should be noted that this interpretation is not fully unambiguous (one out of three C–C bonds of C atom 3 is shortened relative to the C–C bond length of HOPG), and, also, the overall changes in the “fingerprint” region are relatively modest.
An interesting observation is that in three of four spectra the high-intensity σ* resonance at around 292 eV looses intensity to a significant extent. As a consequence, the intensity ratios between the σ* resonance and other resonances decrease, in some cases (for atoms 2 and 3) quite dramatically. Since the relative σ* resonance height in unperturbed graphene was too large compared to experiment (cf.Fig. 2), such disagreement may therefore be due to defects which are unavoidable in a real crystal, at finite temperature. Closer inspection reveals that the σ* signal of carbon 2 shows two additional resonances below the main signal. Atom 3 exhibits one additional resonance. The σ* signal of atom 4 shifts to slightly lower photon energies and develops a shoulder.
In general, the shift/splitting of the σ* signal is sensitive to C–C bond lengths and can in fact be used as a tool to measure them.32
Relatively large changes of the spectra of defective structures are observed in the high-energy regions around 320 eV, at least for atom 4.
In summary, a SW defect has some effect on theoretical NEXAFS spectra of graphene, with features consistent with experimental signatures after plasma treatment of HOPG which inherently leads to such defects.
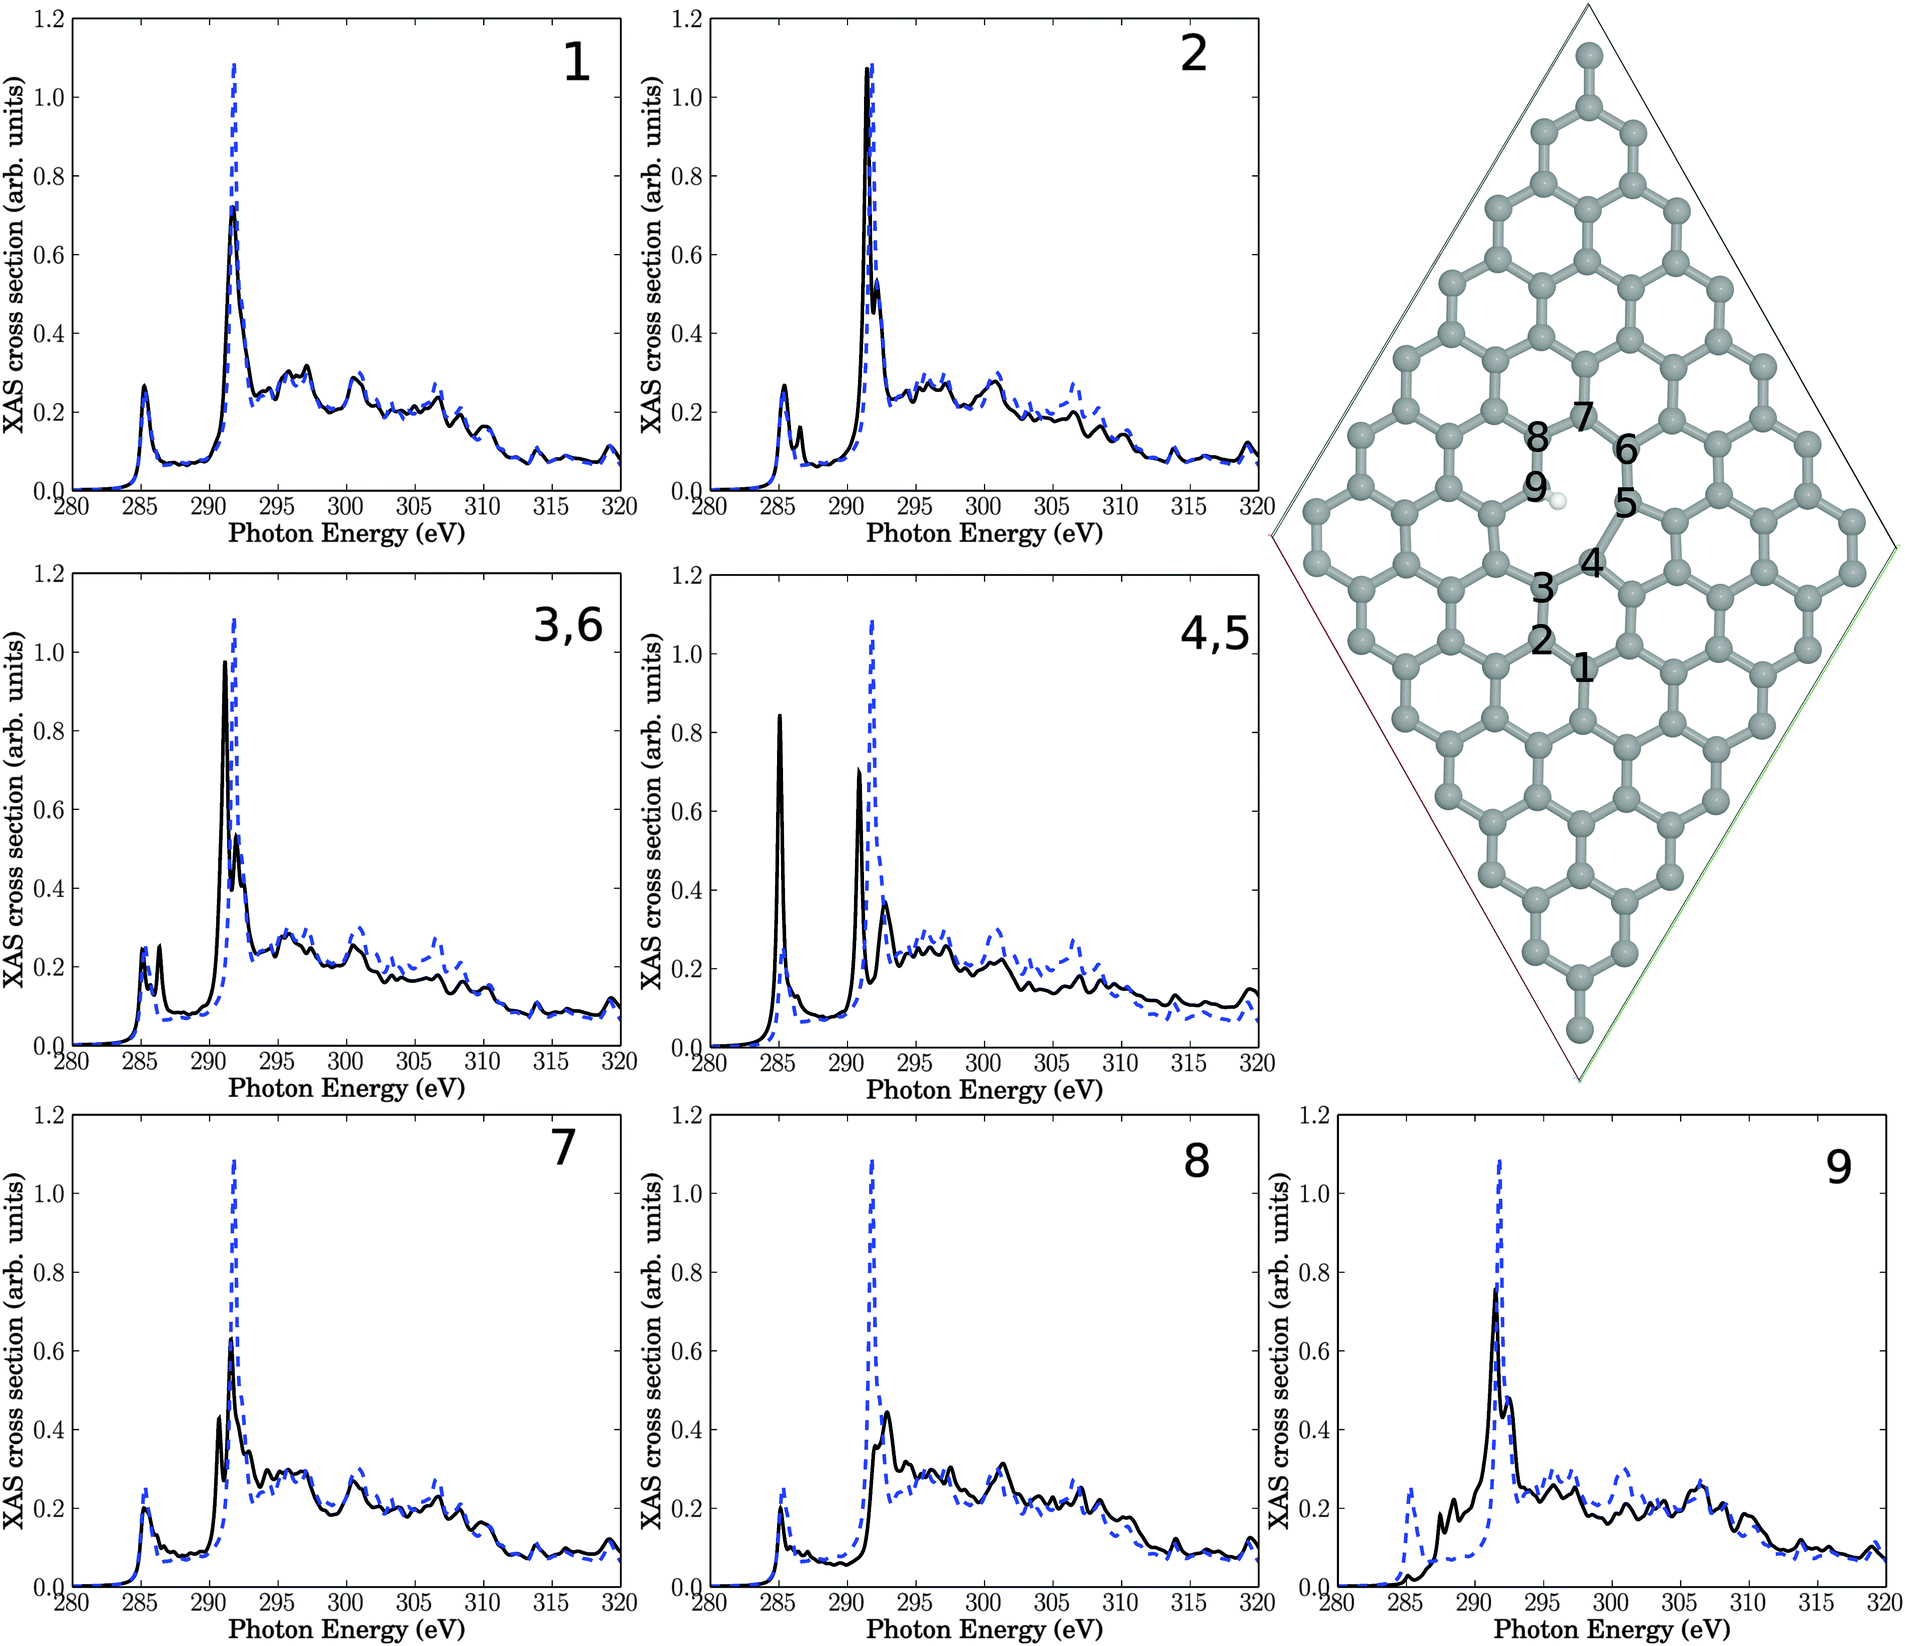 | ||
| Fig. 4 Upper right: single-vacancy (V1(5,9)) defect, decorated with two H atoms (both at C atom 9), in a 7 × 7 cell. The seven insets show NEXAFS spectra corresponding to core-hole creation in atoms 1–9, located close to the defect. Full, black lines: computed NEXAFS spectra, dashed, blue lines: the theoretical spectrum of unperturbed graphene for comparison. | ||
The resulting structure and NEXAFS spectra of atoms near the defect are presented in Fig. 4. Again we see that all spectra are different from the unperturbed graphene layer. Specifically, the following observations are made.
• Atom number 9, the sp3-hybridized C atom, looses intensity of the π* resonance at 285.4 eV, which is not unexpected. Closer inspection shows, however, that the z-component of the intensity is not fully lost but partially shifted (to about 288 eV), i.e., into the “fingerprint” region (see below). This intensity should not be interpreted as being π-like, though, because C9 has a fully saturated albeit three-dimensional, atomic neighbourhood.
• Also the neighbour atom 8 shows a reduced π* intensity. In some cases, we observe a splitting of the π* signal at 285.4 eV (for example, for atoms 2, 3(6)). Other spectra's π* resonances remain largely unaffected (for example, atoms 1, 7), or the π* intensity increases (for example for atom 4 (equivalent to 5)).
• For the sp3 atom 9 intensity appears in the “fingerprint” region between 286.8 eV and 290.8 eV. Also atom 4 (5) and to a lesser extent 3 (6) and 7 show an intensity gain in this region, close to the σ* resonance.
• The original σ* resonance appears to be reduced in intensity in most cases (atoms 1, 4 (5), 7, 8, 9), sometimes splitted (e.g., atoms 2, 3 (6), 4 (5), 7, 9).
• Atoms 2 and 3, which are farthest away from the defect, are only slightly affected.
• In all spectra, the high-energy region (above about 310 eV) is almost unchanged.
Overall, these findings are similar to the Stone–Wales defect, with the dominant effects: reduction of the σ* resonance and new resonant features in the “fingerprint” region between π* and σ*. In addition to the observations for SW the formation of a sp3-hybridized C atom leads to a loss of π* resonant features, in particular at that atom. Once again, these findings are consistent with experimental features following plasma treatment.
A few additional tests have been carried out for the single-vacancy case. First, it has been stressed that defects in graphene can lead to long-ranged strain fields.33 In order to study a possible effect of long-range order on NEXAFS, we have also used for the single-vacancy a larger supercell than 7 × 7 cell, namely a 9 × 9 cell with a V1(5,9) defect. However, no clear differences w.r.t. to Fig. 4 (black curves) could be found (see Fig. S1 in the ESI†), which is why the 7 × 7 cell was used throughout. We also calculated, for the 7 × 7 cell the spectra for a saturation with only one saturating hydrogen atom (leaving atom no. 9 sp2-hybridized). This leads to a decrease of the resonance intensity in the fingerprint region for carbon atom no. 9 and minor changes for the other carbons, as reported in the ESI† (Fig. S2).
 | ||
| Fig. 5 Right: double-vacancy (V2(5-8-5)) defect in a 7 × 7 cell. The six insets show NEXAFS spectra corresponding to core-hole creation in atoms 1–7, located close to the defect. Full, black lines: computed NEXAFS spectra, dashed, blue lines: the theoretical spectrum of unperturbed graphene for comparison. | ||
This structure serves as another support of our hypothesis, that defects may be responsible for the observed intensity changes upon plasma treatment. Specifically, out of the seven investigated carbon atoms near the defect, four show additional resonances in the “fingerprint” region. Especially atom number 4, which is in the center of the defect, exhibiting a sharp resonance with high intensity. The signals in the “fingerprint” region for atoms 4, 5, and 6, are all of σ symmetry. As a consequence, the resonance intensity of σ* at around 292 eV is reduced for all investigated atoms compared to unperturbed graphene, proving once more the sensitivity of this resonance w.r.t. defects. Again, effects on the NEXAFS spectra of atoms farther away from the defect center, e.g., atom 1, are small.
 | ||
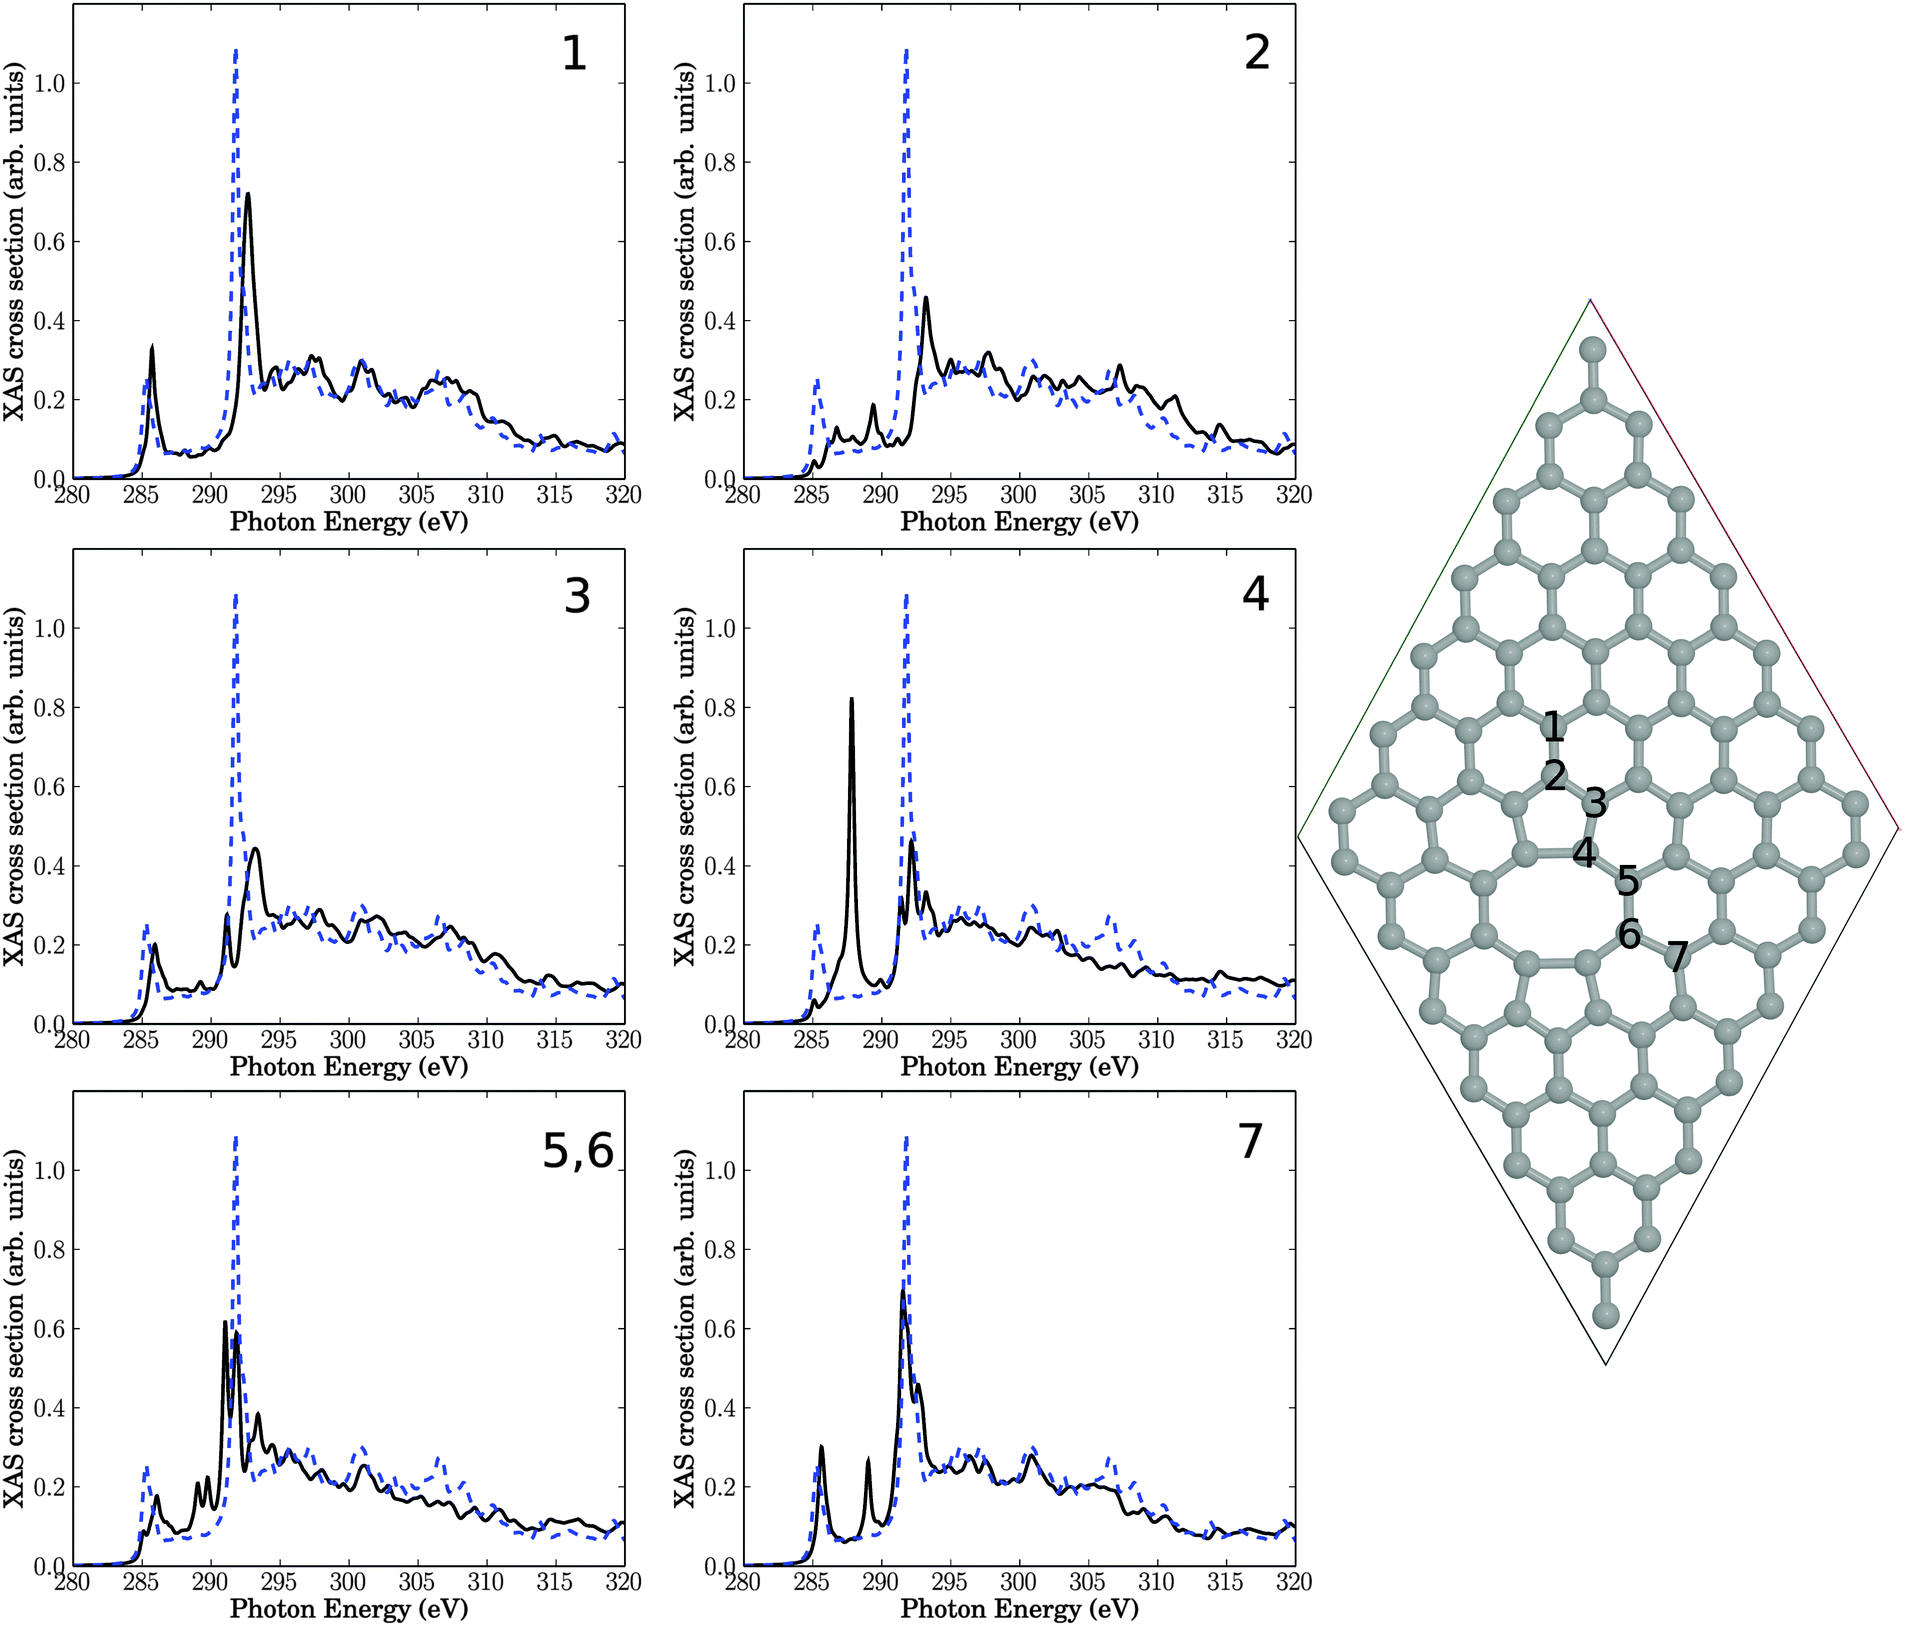
| Fig. 6 Upper right: decorated line defect in a 7 × 7 cell. The seven insets show NEXAFS spectra corresponding to core-hole creation in atoms 1–8, located close to the defect. Full, black lines: computed NEXAFS spectra, dashed, blue lines: the theoretical spectrum of unperturbed graphene for comparison. | ||
Again, the general observations are similar to those of above: most atoms close to the defect are characterized by reduced π* and σ* intensities, and for some atoms (in particular atoms 4 and 6) clear additional resonances appear in the “fingerprint” region. The latter two atoms are the ones which carry H atoms. Closer analysis for atom 4 for example shows again, that the “additional” resonances are actually shifted and split, σ* resonances. The different resonances arise from different C–C bond lengths (compared to defect-free HOPG), and the new resonances can now be lower or slightly higher in energy than the defect-free σ* signal.
4 “Chemical” defects
4.1 XP Br 3d spectra
In this section we consider graphene layers containing bromine, mimicking the situation encountered after Br2 plasma treatment. There is a large variety of how Br2 can react with graphene. Among various principal possibilities6 are the formation of covalent bonds between Br and C by nucleophilic substitution at plasma induced defects with sp3-hybridized C atoms. The same can be achieved by electrophilic or radical addition on sp2-hybridized C atoms/C![[double bond, length as m-dash]](https://www.rsc.org/images/entities/char_e001.gif) C double bonds. Finally, non-covalent interactions between Br or Br2 with the π-electron system of graphene are possible, as well as intercalations of bromine between graphene layers.
C double bonds. Finally, non-covalent interactions between Br or Br2 with the π-electron system of graphene are possible, as well as intercalations of bromine between graphene layers.
The experimental Br 3d XP spectra of Br2-plasma treated graphene show at low Br concentrations, at least two co-existing Br species at 3d5/2 binding energies of around 70.5 eV and 68.4 eV, respectively.6 The latter, low-binding energy species looses intensity with increasing Br load. A preliminary assignment of the 70.5 eV peak was to be due to covalent C–Br bond formation where C is sp3-hybridized. The low-energy peak at 68.4 eV was tentatively interpreted as being due to Br binding to sp2-hybridized C atoms.6
To test this hypothesis, XP spectra were calculated for four different cluster models as shown in Fig. 7. All models are derived from a C96 motif saturated at the edges with 26 H atoms, by adding Br atoms, substituting H with Br and/or creating line defects. As before, also for the plasma experiments of ref. 6 hydrogenation of defects is practically unavoidable. In particular, Fig. 7(a) shows a scenario where two Br atoms reacted with an intact surface forming C–Br bonds to (now) sp3-hybridized C atoms. Fig. 7(b) shows a similar case with two neighbouring Br atoms forming covalent bonds to sp3-hybridized C atoms, however, now with at least one of them being close to a (partially H-decorated) defect. Fig. 7(c) stands for a single Br atom with a covalent bond to a sp2-hybridized C atom as part of a defect. Finally, Fig. 7(d) shows a single Br atom forming a covalent bond to a sp2-hybridized C atom at a H-saturated edge of the cluster. Using the methodology of above, we calculated ionization energies for Br 3d for all species.
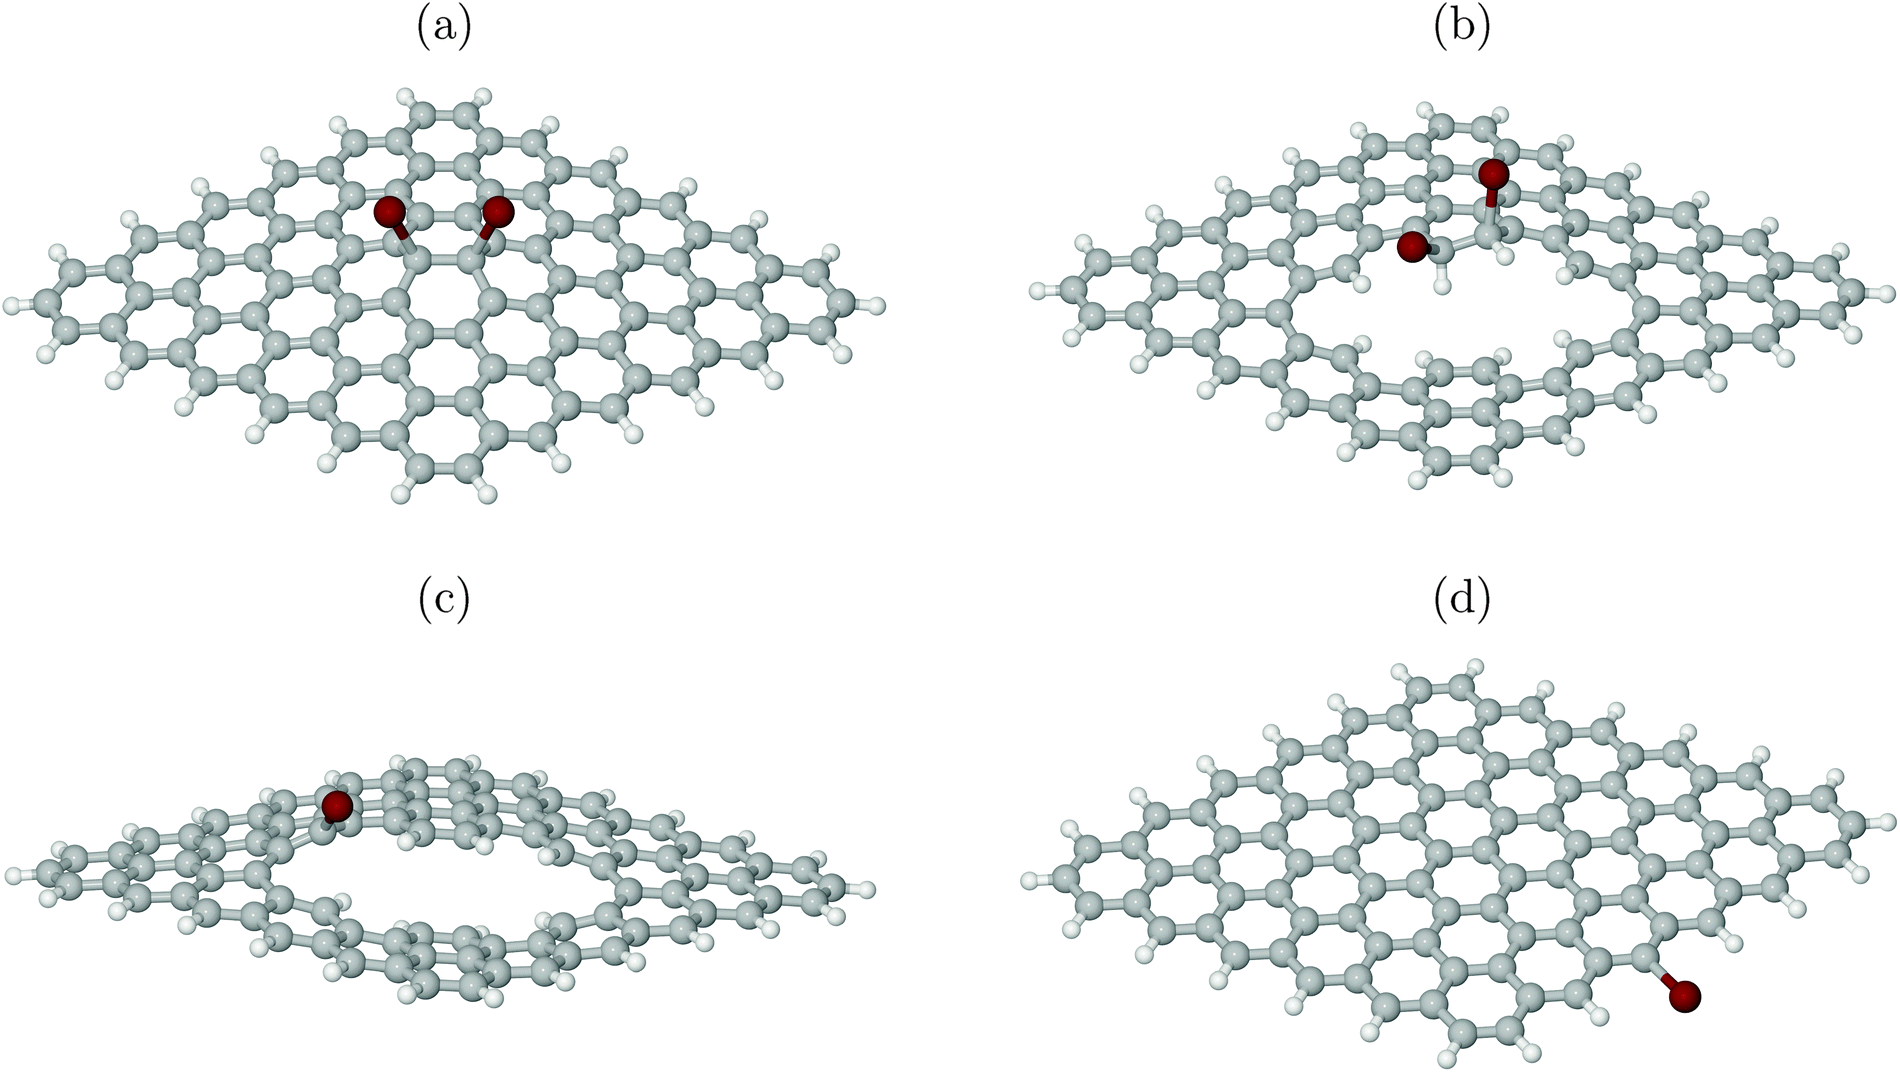 | ||
| Fig. 7 Cluster models used for calculation of XP spectra. Br in red. See text for details. | ||
From Table 1 we note that indeed, (averaged) 3d ionization potentials are substantially higher for Br atoms bonded to sp2-hybridized carbons at defects (c) or edges (d), compared to Br atoms attached to sp3-hybridized C atoms (a, b). The latter show a lower 3d binding energy, in particular those attached to a formerly defect-free surface (a). The range of averaged Br 3d ionization potentials is between 2–3 eV, not unlike the experimental range.6 (In passing we note that absolute XPS values in experiment are red-shifted with respect to our Δ-KS values by about 4–6 eV.) Note also that there is a distribution of 3d binding energies even for single Br atoms, due to non-degenerate 3d orbitals. This is indicated in Table 1 as a spread Δ for 3d signals. We further see that the core binding energies correlate with effective atom charges of Br (in the form of ElectroStatic Potential (ESP) charges, calculated with the Merz-Sing–Kollman scheme34): roughly, the more negative Br, the lower the 3d core ionization energy as expected.
| Model | (a) sp3, “on-plane” | (b) sp3, at defect | (c) sp2, at defect | (d) sp2, at edge |
|---|---|---|---|---|
| IP (Br 3d)/eV | 74.11 | 75.04 | 75.99 | 76.45 |
| ΔIP (Br 3d)/eV | 0.45 | 1.48 | 0.82 | 0.50 |
| ESP (Br) | −0.1695 | −0.0852 | −0.0042 | 0.0043 |
The XPS experiments of ref. 6 can thus be interpreted as follows. At low Br doses, Br2 reacts with largely intact graphene layers, forming for example by electrophilic addition to CC bonds, structures like those in Fig. 7(a). The latter have a small 3d core ionization energy. With continued Br plasma treatment, the probability to create physical defects, e.g., point or line defects or edges increases, which then can react with hydrogen and/or bromine. Therefore, species like those in Fig. 7(b)–(d) will appear. Since these have larger 3d core ionization energies, continued bromination leads to shift of the XP spectrum to higher 3d binding energies in agreement with experiment.6
It should also be stressed that structure 7(a) is much less stable than structures (b)-(c), which are related to physical defects: the cluster in Fig. 7(a) is in fact unstable at the PBE+D3/6-311G** level of theory, in contrast to (b)–(d). To arrive at the geometry of Fig. 7(a), the PBE0 hybrid functional35 with an admixture of exact exchange had to be used. Even then, the Br adsorption energy is small. Further, also with periodic KS calculations adopting the PBE functional, an arrangement analogous to Fig. 7(a) was unstable, cf. Section 4.2.
4.2 NEXAFS spectra
We then calculated C K-edge NEXAFS spectra for brominated graphene layers, using periodic DFT as outlined earlier. In particular the two structures shown in Fig. 8 and 9 were considered, both related to reaction of bromine at a decorated line defect, cf.Fig. 6. In fact, as mentioned above, an analogue to Fig. 7(a) was not found to be stable using periodic DFT on the PBE level of theory, neither for 1,2 nor for 1,4 addition of Br2.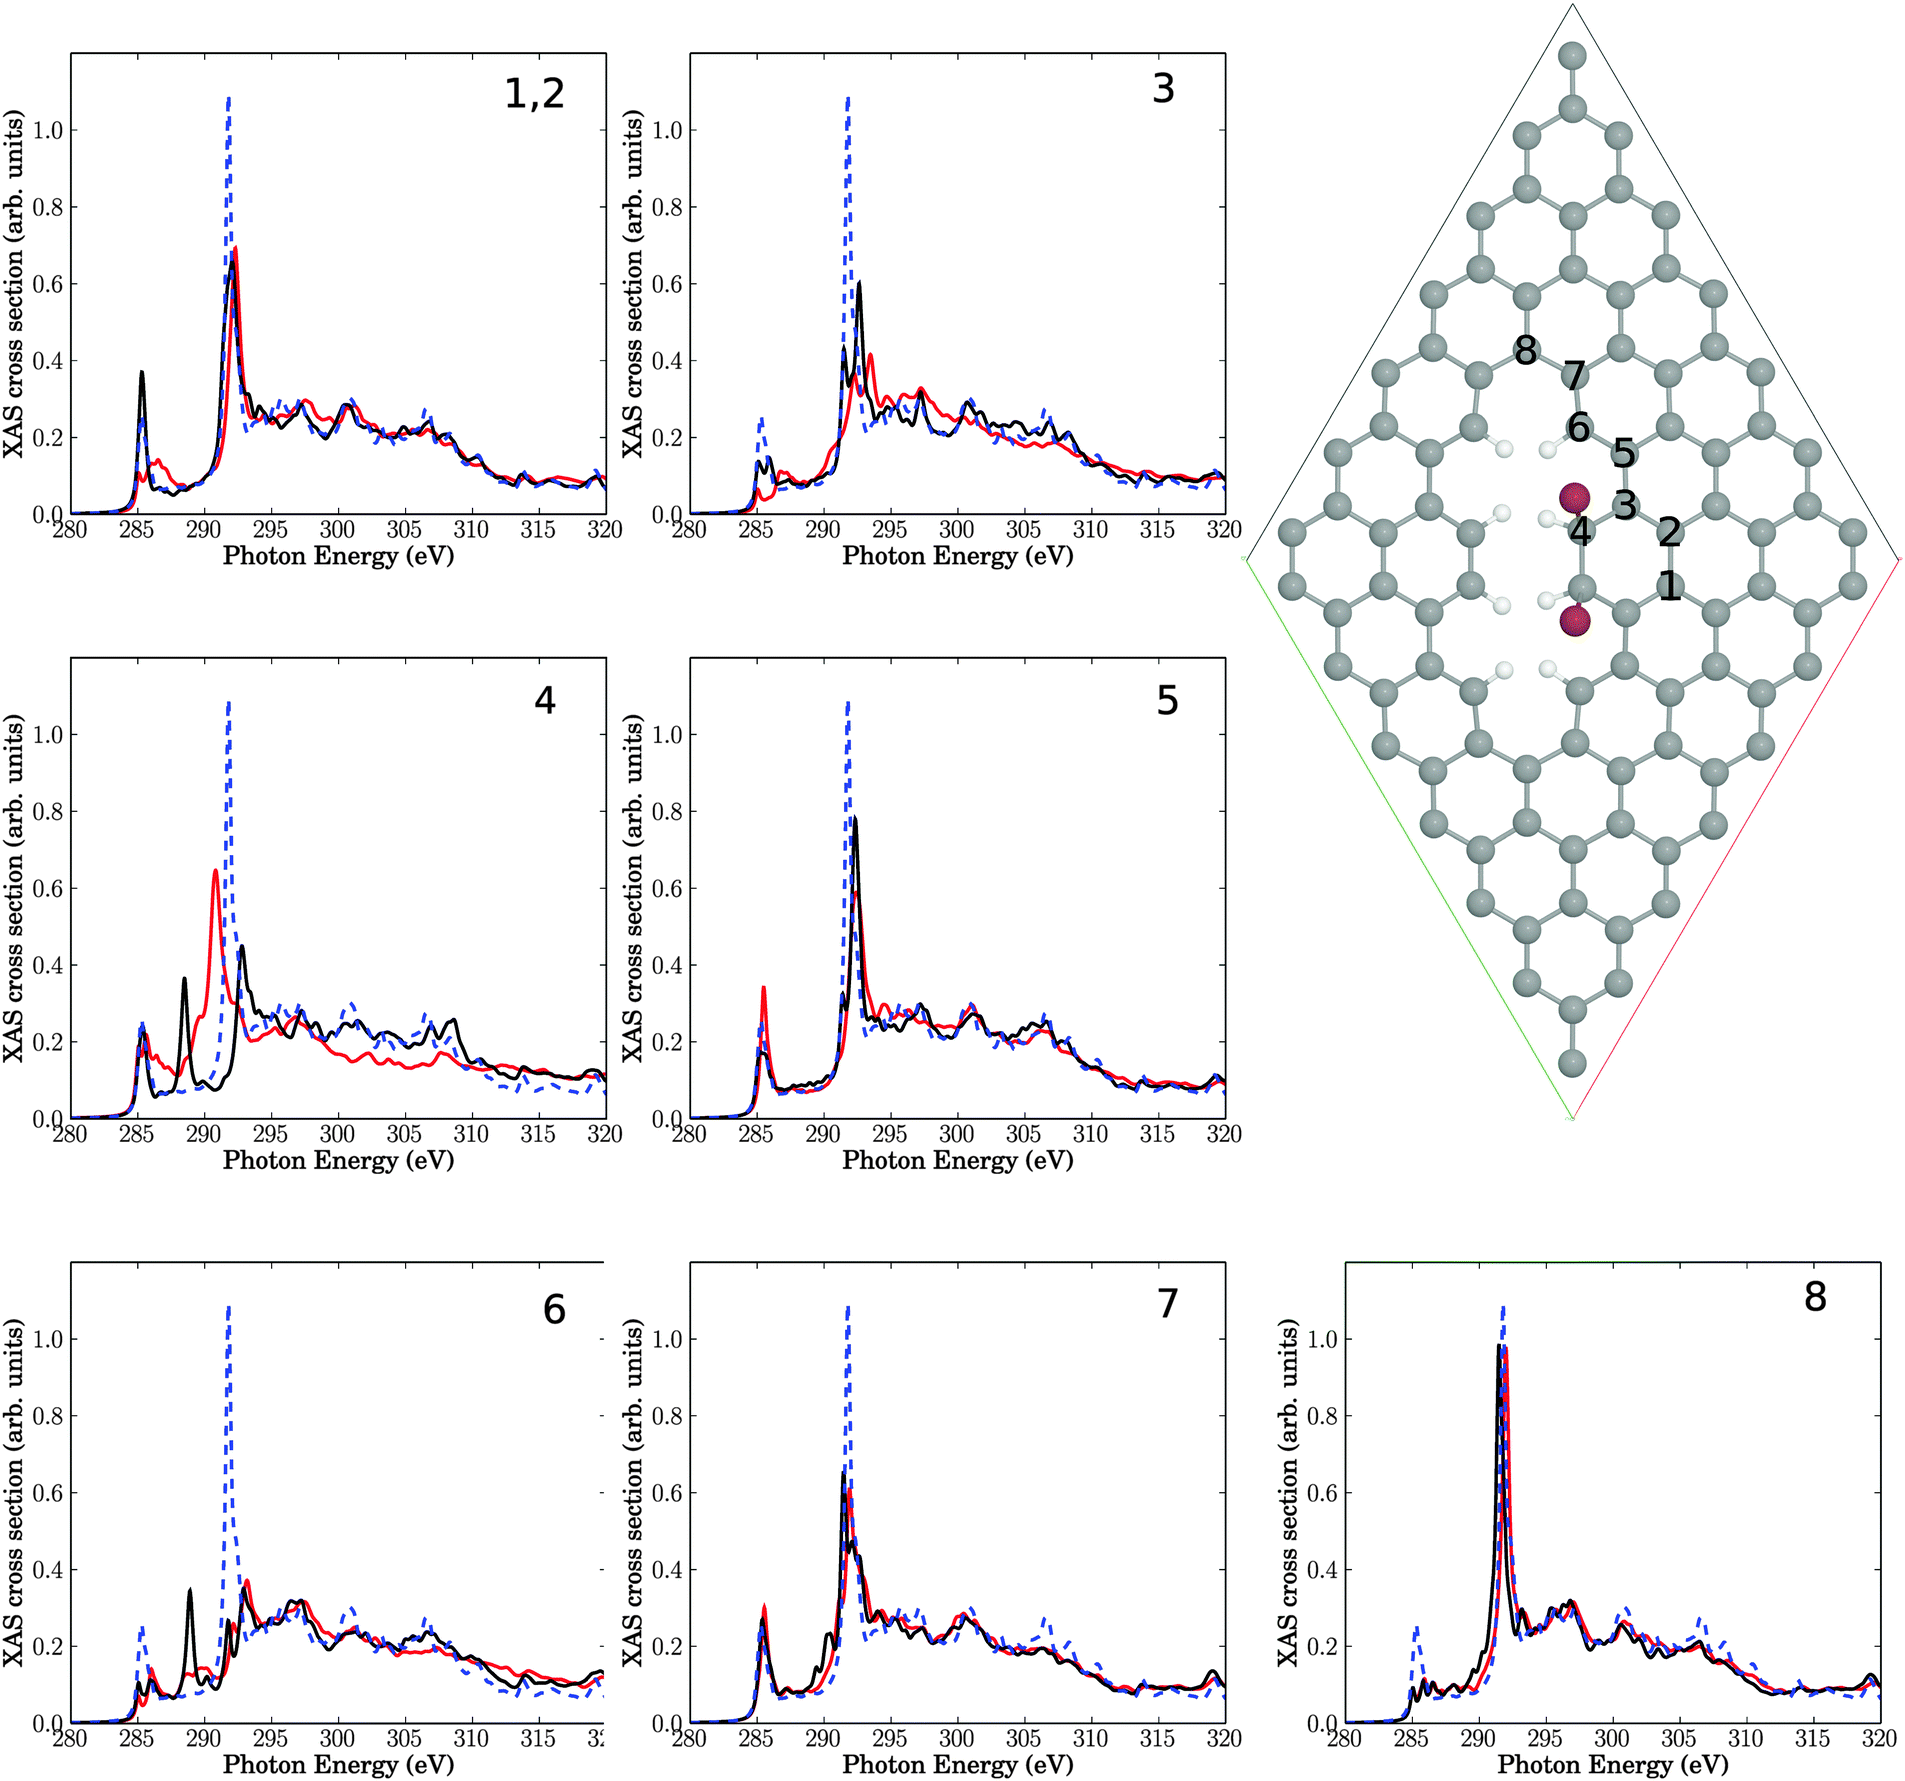 | ||
| Fig. 8 Upper right: elementary cell for a situation with two Br atoms added to neighbouring C atoms (sp3) near a line defect. The seven insets show NEXAFS spectra corresponding to core-hole creation in atoms 1–8, located close to the defect (same atom numbering as in Br-free Fig. 6). Full, red lines: computed NEXAFS spectra for brominated species, dashed, blue lines: the theoretical spectrum of unperturbed graphene for comparison. The black lines correspond to spectra for the Br-free line defect of Fig. 6. | ||
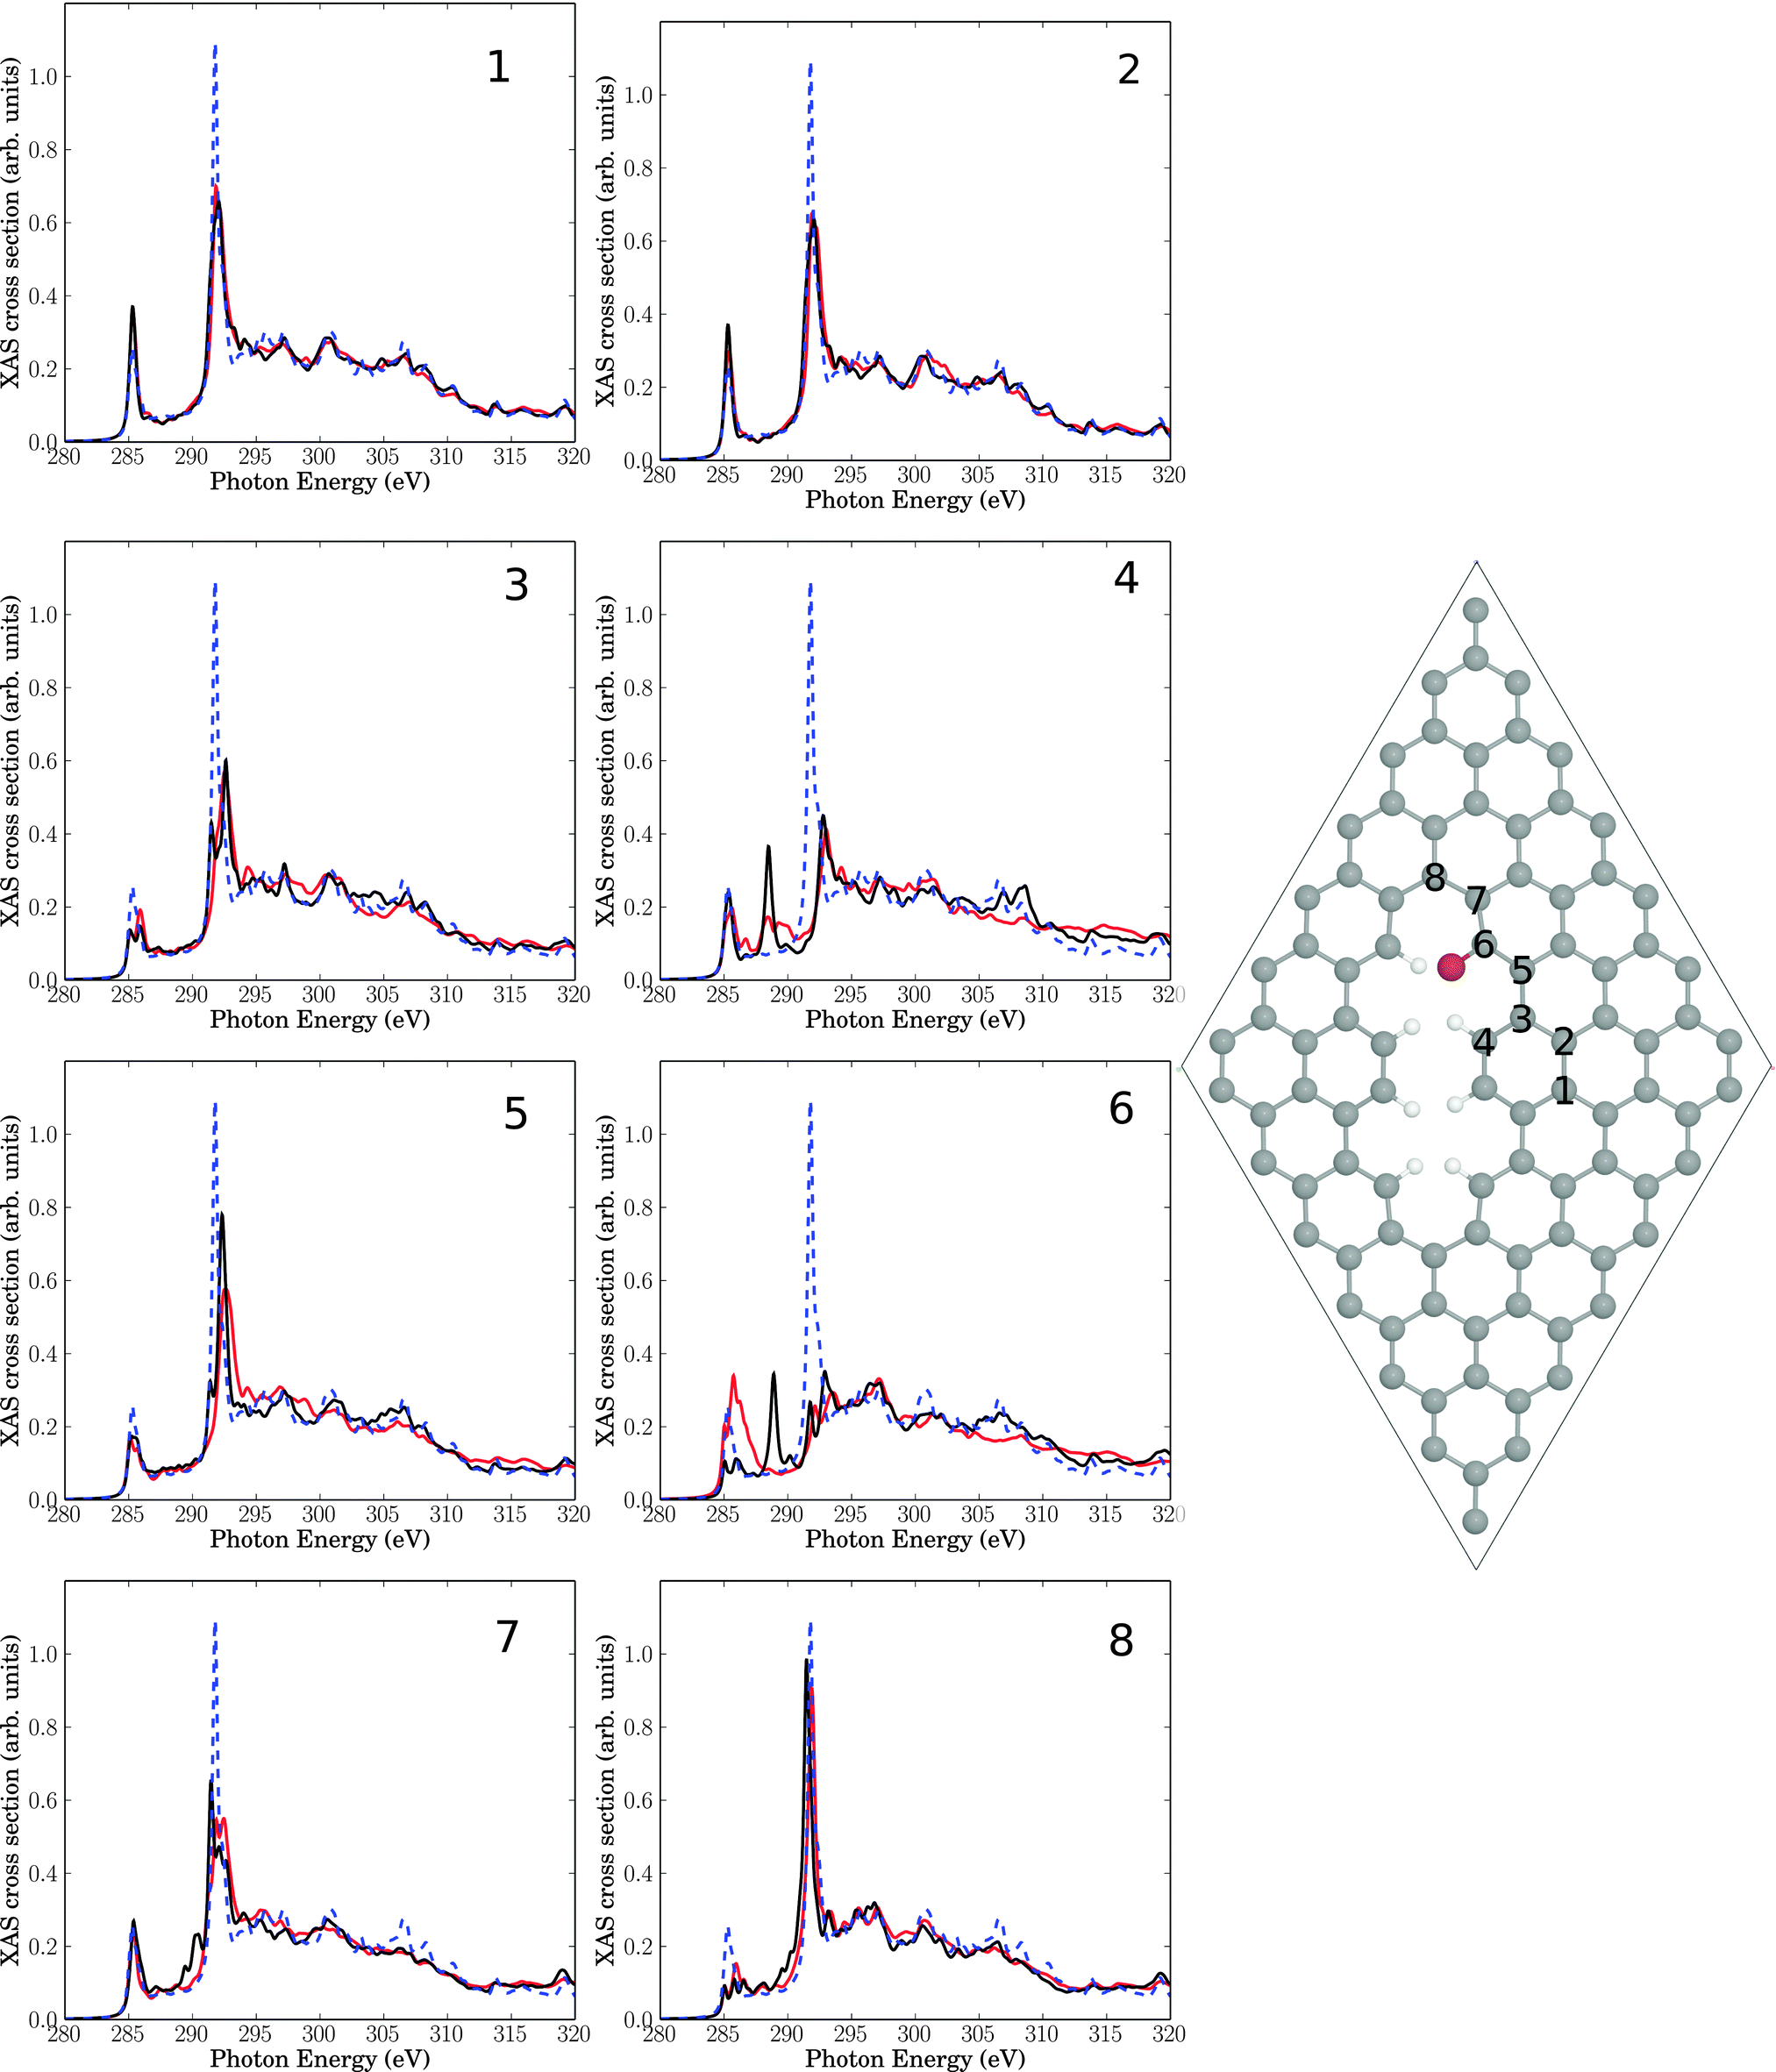 | ||
| Fig. 9 Right: elementary cell for a single Br atom added to a C atom (sp2) near a line defect. The eight insets show NEXAFS spectra for core-hole creation in atoms 1–8 close to the defect (same atom numbering as in Br-free Fig. 6). Full, red lines: computed NEXAFS spectra for brominated species, dashed, blue lines: the theoretical spectrum of unperturbed graphene for comparison. The black lines correspond to spectra for the Br-free line defect of Fig. 6. | ||
In Fig. 8, we show a 7 × 7 elementary cell corresponding to an electrophilic 1,2 addition of Br2 to a CC bond near a line defect. This corresponds to two Br atoms added to C atom 4 and its neighbouring C, at the line defect of Fig. 6. Fig. 8 can also be seen as a periodic analogue to the cluster model of Fig. 7(b).
In the figure, besides the elementary cell, NEXAFS spectra are shown for the same C atoms 1–8 as in Fig. 6, now for the brominated case (red), together with the intact surface (blue, dashed) and the Br-free line defect (black). We first of all note that the bromination leads to only small additional changes of NEXAFS spectra for C atoms 1 and 2, beyond the Br-free case of Fig. 6 with a simple line-defect. This was to be expected due to the large distance of C1 and C2 from the defect. Similar moderate changes are found for C atoms C3, C5, C6, C7 and C8, which are also not in direct contact with a Br atom. The biggest variations are observed for atom C4, which is connected to a Br atom and which rehybridizes from sp2 to sp3: the C 1s → π* resonance at around 285.4 eV broadens towards the “fingerprint” region and looses intensity. The C 1s → σ* resonance shifts from about 292 to about 291 eV, gains intensity and broadens also towards the “fingerprint” region. Compared to defect-free graphene, for C4 both C 1s → π* and C 1s → σ* resonances loose intensity and are broadened/shifted towards the “fingerprint” region. This is in partial agreement with experiment, where upon bromination a decrease and possible splitting, of the C 1s → π* transition was found, as well as increased intensity in the fingerprint region, vide supra. It should be noted that the overall effects due to physical defects on NEXAFS spectra dominate over additional effects of bromination, at least for the low-coverage model of Fig. 8.
In Fig. 9 we consider as a further model a 7 × 7 elementary cell corresponding to a radical addition of a single Br atom to C atom 6 of Fig. 6. Equivalently, Fig. 9 is the periodic analogue of cluster model Fig. 7(c). In this case, C atom 6 attached to Br remains sp2-hybridized, since Br formally replaces an H atom of Fig. 6. Again we find that bromination has a minor impact on NEXAFS spectra, compared to the situation where “only” a physical line defect was present. By far the biggest additional changes are for atom C6 as expected: here the π* feature increases its intensity and broadens, while the resonance in the middle of the “fingerprint” region vanishes. The C 1s → σ* signal changes not by much. Compared to the defect-free surface, the π* resonance grows slightly, the C 1s → σ* intensity decreases and the “fingerprint” region in between is hardly affected. These observations are in less good agreement with experiment if taken seriously, i.e., a partial rehybridization of C atoms to sp3 upon bromination seems to better fulfill boundary conditions imposed by experimental findings.
5 Summary and conclusions
In summary, we have shown that both physical and chemical modifications of graphene surfaces will have an influence on their C K-edge NEXAFS spectra. In particular, the following observations were made.• Physical as well as chemical defects can lead to the rehybridization of C atoms in the graphene layer, from sp2 to sp3. In our examples above, this was the case for physical defect V1(5,9) (Fig. 4) and the chemical defect in Fig. 8. Locally, the π system is destroyed and as a consequence, the C 1s → π* resonance (at 285.4 eV) is diminished.
• Also for other defects, even without C rehybridization to sp3, often reduced C 1s → π* intensities are found. Further, C 1s → σ* resonances (at around 298 eV) are frequently diminished. These effects may have to do with the fact that a defect can lead to a local shift of C 1s → π* and → σ* excitation energies.
• Often, defects cause additional resonances in the “fingerprint” region between the original π* and σ* resonances. In some cases, this arises from shifts of the π* states upward, or loss and shift of π* intensity by formation of sp3-hybridized C atoms. In most cases studied in this work, the new features in the “fingerprint” region are due to shifted and splitted σ* states: the three-fold symmetry around particular C atoms is broken, leading to splitted σ* levels with shifted energies, often to lower energies due to elongated C–C bonds.
• The effects of defects on NEXAFS spectra are local, but not fully localized to C atoms in the center of a defect or to their nearest neighbours.
• The additional effects of chemical modification (bromination) on top of physical perturbations on NEXAFS spectra, are comparatively small. For the cases studied, physical defects dominate over chemical defects. It should be noted, however, that in both examples (Fig. 8 and 9), the Br load was low: two Br atoms per 94 C atoms in Fig. 8, and one Br atom per 94 C atoms for Fig. 9.
• In case of chemical modification, brominated species which otherwise induce no physical defects are expected to play a role at low Br concentrations only. At higher Br load, chemical and physical defects go hand in hand. In particular C–Br bonds with sp3 C atoms seem to form. At least, this will better account for measured NEXAFS spectra compared to those due to C–Br bonds with sp2 C atoms.
The trends observed by our theoretical models are consistent with experimental observations.6 It must also be clearly said, however, that a detailed, quantitative understanding of the experimental data is hardly possible at the moment. This would require a more detailed knowledge on the concentration and statistical distribution of intact and defective carbon atoms, and a costly averaging over all non-equivalent C atoms. The selection of model systems studied here is somewhat arbitrary and certainly incomplete, albeit based to a good extent on stability criteria. The theoretical treatment, nevertheless, supports the experimental finding of NEXAFS as being a sensitive tool for defective graphenes. In addition, it offers a possible microscopic interpretation for experimental data.
Acknowledgements
Thanks are due to the BAM Presidium for financial support through Project Ideen_2012_59 as part of the BAM MIS Program. Fruitful discussions with D. Kröner (University of Potsdam) are gratefully acknowledged.References
- K. S. Novoselov, A. K. Geim, S. V. Morozov, D. Jiang, Y. Zhang, S. V. Dubonos, I. V. Grigorieva and A. A. Firsov, Science, 2004, 306, 666 CrossRef CAS PubMed.
- A. H. Castro Neto, F. Guinea, N. M. R. Peres, K. S. Novoselov and A. K. Geim, Rev. Mod. Phys., 2009, 81, 109 CrossRef CAS.
- A. K. Geim, Science, 2009, 324, 1530 CrossRef CAS PubMed.
- H. Raza, Graphene Nanoelectronics: Metrology, Synthesis, Properties and Applications, Springer, 2012 Search PubMed.
- V. Georgakilas, M. Otyepka, A. B. Bourlinos, V. Chandra, N. Kim, K. C. Kemp, P. Hobza, R. Zboril and K. S. Kim, Chem. Rev., 2012, 112, 6156 CrossRef CAS PubMed.
- A. Lippitz, J. F. Friedrich and W. E. Unger, Surf. Sci., 2013, 611, L1 CrossRef CAS PubMed.
- J. Stöhr, NEXAFS Spectroscopy, Springer Series in Surface Sciences, Springer, 2003 Search PubMed.
- P. E. Batson, Phys. Rev. B: Condens. Matter Mater. Phys., 1993, 48, 2608 CrossRef CAS.
- F. Banhart, J. Kotakoski and A. V. Krasheninnikov, ACS Nano, 2011, 5, 26 CrossRef CAS PubMed.
- V. A. Coleman, R. Knut, O. Karis, H. Grennberg, U. Jansson, R. Quinlan, B. C. Holloway, B. Sanyal and O. Eriksson, J. Phys. D: Appl. Phys., 2008, 41, 062001 CrossRef.
- T. Schiros, D. Nordlund, L. Plov, D. Prezzi, L. Zhao, K. S. Kim, U. Wurstbauer, C. Gutirrez, D. Delongchamp, C. Jaye, D. Fischer, H. Ogasawara, L. G. M. Pettersson, D. R. Reichman, P. Kim, M. S. Hybertsen and A. N. Pasupathy, Nano Lett., 2012, 12, 4025 CrossRef CAS PubMed.
- A. V. Okotrub, N. F. Yudanov, I. P. Asanov, D. V. Vyalikh and L. G. Bulusheva, ACS Nano, 2013, 7, 65 CrossRef CAS PubMed.
- W. Hua, B. Gao, S. Li, H. Ågren and Y. Luo, Phys. Rev. B: Condens. Matter Mater. Phys., 2010, 82, 155433 CrossRef.
- R. Hamdan, A. F. Kemper, C. Cao and H. P. Cheng, J. Chem. Phys., 2013, 138, 164702 CrossRef PubMed.
- A. Yaya, C. P. Ewels, I. Suarez-Martinez, P. Wagner, S. Lefrant, A. Okotrub, L. Bulusheva and P. R. Briddon, Phys. Rev. B: Condens. Matter Mater. Phys., 2011, 83, 045411 CrossRef.
- A. N. Rudenko, F. J. Keil, M. I. Katsnelson and A. I. Lichtenstein, Phys. Rev. B: Condens. Matter Mater. Phys., 2010, 82, 035427 CrossRef.
- W. Kohn and L. J. Sham, Phys. Rev., 1965, 140, A1133 CrossRef.
- P. Giannozzi, S. Baroni, N. Bonini, M. Calandra, R. Car, C. Cavazzoni, D. Ceresoli, G. L. Chiarotti, M. Cococcioni, I. Dabo, A. D. Corso, S. d. Gironcoli, S. Fabris, G. Fratesi, R. Gebauer, U. Gerstmann, C. Gougoussis, A. Kokalj, M. Lazzeri, L. Martin-Samos, N. Marzari, F. Mauri, R. Mazzarello, S. Paolini, A. Pasquarello, L. Paulatto, C. Sbraccia, S. Scandolo, G. Sclauzero, A. P. Seitsonen, A. Smogunov, P. Umari and R. M. Wentzcovitch, J. Phys.: Condens. Matter, 2009, 21, 395502 CrossRef PubMed.
- J. P. Perdew, K. Burke and M. Ernzerhof, Phys. Rev. Lett., 1996, 77, 3865 CrossRef CAS.
- N. Troullier and J. L. Martins, Phys. Rev. B: Condens. Matter Mater. Phys., 1991, 43, 1993 CrossRef CAS.
- M. Taillefumier, D. Cabaret, A.-M. Flank and F. Mauri, Phys. Rev. B: Condens. Matter Mater. Phys., 2002, 66, 195107 CrossRef.
- H. J. Monkhorst and J. D. Pack, Phys. Rev. B: Solid State, 1976, 13, 5188 CrossRef.
- C. Gougoussis, M. Calandra, A. P. Seitsonen and F. Mauri, Phys. Rev. B: Condens. Matter Mater. Phys., 2009, 80, 075102 CrossRef.
- P. E. Blöchl, Phys. Rev. B: Condens. Matter Mater. Phys., 1994, 50, 17953 CrossRef.
- W. Olovsson, I. Tanaka, T. Mizoguchi, G. Radtke, P. Puschnig and C. Ambrosch-Draxl, Phys. Rev. B: Condens. Matter Mater. Phys., 2011, 83, 195206 CrossRef.
- L. Triguero, O. Plashkevych, L. Pettersson and H. Ågren, J. Electron Spectrosc. Relat. Phenom., 1999, 104, 195 CrossRef CAS.
- K. Hermann and L. G. M. Pettersson, M. E. Casida, C. Daul, A. Goursot, A. Koester, E. Proynov, A. St-Amant, D. R. Salahub, V. Carravetta, H. Duarte, C. Friedrich, N. Godbout, J. Guan, C. Jamorski, M. Leboeuf, M. Leetmaa, M. Nyberg, S. Patchkovskii, L. Pedocchi, F. Sim, L. Triguero and A. Vela, Be-deMon version 3.1, 2011 Search PubMed.
- M. J. Frisch, G. W. Trucks, H. B. Schlegel, G. E. Scuseria, M. A. Robb, J. R. Cheeseman, G. Scalmani, V. Barone, B. Mennucci, G. A. Petersson, H. Nakatsuji, M. Caricato, X. Li, H. P. Hratchian, A. F. Izmaylov, J. Bloino, G. Zheng, J. L. Sonnenberg, M. Hada, M. Ehara, K. Toyota, R. Fukuda, J. Hasegawa, M. Ishida, T. Nakajima, Y. Honda, O. Kitao, H. Nakai, T. Vreven, J. A. Montgomery, Jr., J. E. Peralta, F. Ogliaro, M. Bearpark, J. J. Heyd, E. Brothers, K. N. Kudin, V. N. Staroverov, R. Kobayashi, J. Normand, K. Raghavachari, A. Rendell, J. C. Burant, S. S. Iyengar, J. Tomasi, M. Cossi, N. Rega, J. M. Millam, M. Klene, J. E. Knox, J. B. Cross, V. Bakken, C. Adamo, J. Jaramillo, R. Gomperts, R. E. Stratmann, O. Yazyev, A. J. Austin, R. Cammi, C. Pomelli, J. W. Ochterski, R. L. Martin, K. Morokuma, V. G. Zakrzewski, G. A. Voth, P. Salvador, J. J. Dannenberg, S. Dapprich, A. D. Daniels, Farkas, J. B. Foresman, J. V. Ortiz, J. Cioslowski and D. J. Fox, Gaussian 09 Revision D.01, Gaussian Inc., Wallingford, CT, 2009 Search PubMed.
- S. Grimme, J. Antony, S. Ehrlich and H. Krieg, J. Chem. Phys., 2010, 132, 154104 CrossRef PubMed.
- R. Krishnan, J. S. Binkley, R. Seeger and J. A. Pople, J. Chem. Phys., 1980, 72, 650 CrossRef CAS PubMed.
- Y. Ahmad, M. Dubois, K. Gurin, A. Hamwi, Z. Fawal, A. P. Kharitonov, A. V. Generalov, A. Y. Klyushin, K. A. Simonov, N. A. Vinogradov, I. A. Zhdanov, A. B. Preobrajenski and A. S. Vinogradov, J. Phys. Chem. C, 2013, 117, 13564 CAS.
- J. Stöhr, F. Sette and A. L. Johnson, Phys. Rev. Lett., 1984, 53, 1684 CrossRef.
- A. Krasheninnikov and R. Nieminen, Theor. Chem. Acc., 2011, 129, 625 CrossRef CAS PubMed.
- U. Singh and P. Kollman, J. Comput. Phys., 1984, 5, 129 CAS.
- M. Ernzerhof and G. E. Scuseria, J. Chem. Phys., 1999, 110, 5029 CrossRef CAS PubMed.
Footnote |
| † Electronic supplementary information (ESI) available. See DOI: 10.1039/c4cp01106f |
| This journal is © the Owner Societies 2014 |