Bonding and spectroscopic properties of complexes of SO2–O2 and SO2–N2 and its atmospheric consequences
Received
17th March 2014
, Accepted 26th June 2014
First published on 26th June 2014
Abstract
van der Waals complexes of sulfur dioxide (SO2) with oxygen (O2) and nitrogen (N2) have been investigated by using MP2 and aug-cc-pVXZ (X = D, T) basis set. Two minimum structures with symmetry C1 and Cs have been located at the intermolecular potential energy surface (IPES) of the complex of SO2–O2. Stacked Cs structure of SO2–O2 is found to have greater stability than C1 structure. In the case of SO2–N2, one minimum structure with Cs symmetry has been characterized. In this study, CCSD(T)/aug-cc-pVTZ//MP2/aug-cc-pVTZ and interaction energy calculation at complete basis set (CBS) limit has been employed for better energetic description. The natural bond orbital (NBO) calculation demonstrates the bonding in terms of charge transfer from X-atom lone pair of X2 (X = O or N) to the antibonding SO orbital of SO2. The strength of various intra and inter bonds in the complexes were calculated in terms of electron density at bond critical points (BCP) using quantum theory of atoms in molecules (QTAIM). Frequency calculations for these complexes show a number of interactions induced by low frequency modes in the far IR region. Symmetry adapted calculation were also computed for the complexes and is established that the ratio of dispersion to induction effect is large for the most stable conformers. The atmospheric implications are also discussed for these complexes.
1. Introduction
In atmosphere sulphur dioxide (SO2) is known to form a wide range of weakly bound van der Waals (vdW) complexes which have been categorized and discussed according to the role of SO2 in complex formation.1 Studies regarding weak complexes of SO2 are the topic of several theoretical and experimental investigations.1–6 The explication of the structure, stability and bonding in these complexes has been a challenge for both theoretical and experimental chemists.2
One of the important steps in any chemical reaction is molecular recognition and weak interacting forces. The characterization of binding forces, equilibrium structures and stabilities at the intermolecular levels are necessary to have a complete knowledge of the intermolecular potential energy surface (IPES).7–9 Detailed theoretical analysis of IPES of the weakly bound vdW complexes is important and helpful in elucidating the bulk properties of molecules at different phase.10 Studies regarding the stabilizing forces present in these intermolecular complexes are essential from all chemistry, physics and biological point of view. Extracting useful information from vdW complexes having large-amplitude and highly coupled motions at the intermolecular states are complicated. Indeed, theoretical descriptions are necessary for obtaining a complete picture regarding the binding forces in these complexes. Electronic structures determined by theoretical methods aid experimentalists in assigning their spectra.
Sulfur containing compounds play an important role in the atmospheric chemistry.11 These compounds are of interest due to their role in atmospheric aerosol formation. One of the major atmospheric pollutants is SO2. Due to its reactive nature, it takes part in the formation of various organic, inorganic compounds and aerosol particles.12 SO2 is found to be the major contributor to acid rain.6,13 The atmospheric oxidation of SO2 proceeds in presence of the carrier gas M like O2, N2 or H2O14,15 to form HSO3 which in turn forms the aerosol particles of sulfuric acid (H2SO4) via the formation of sulfur trioxide (SO3) by the following mechanism.16,17
Another important pathway of formation of SO3 is the reaction of photoexcited SO2 with O2.18 In presence of O2, oxidation of SH radical in atmosphere leads to the formation of SO2.19
The most abundant gas molecule in atmosphere is nitrogen, N2, and indeed, there is a possibility of complex formation between N2 and SO2, which may affect the reactivity of SO2. In the atmosphere, molecular oxygen (O2) is recognized as the primary absorber in the UV-range.20 There are a number of studies on the complex formation of O2 which significantly contribute to the solar absorption.21–24 SO2 is a strong solar radiation absorber in the UV-range which leads to the average heating rate of 1 K per day.25,26 So, the complexes of SO2 with O2 and N2 are expected to alter the radiative balance and hence are important. Indeed, a thorough knowledge of the theoretical study of the SO2–O2 and SO2–N2 complex formation is essential.
In this study, ab initio methods have been employed to predict the equilibrium geometries and IPES of the ground state of SO2–O2 and SO2–N2 complexes. The total energy contributions in these complexes may be sub-divided into electrostatic, exchange, induction and dispersion energies. Symmetry adapted calculations were performed to analyze these individual energy components and thus, the nature of interaction may be identified. To the best of our knowledge, no theoretical or experimental studies on SO2–O2 complex are known. The equilibrium structure of SO2–N2 complex has been established using molecular beam electric resonance spectroscopy27 and by microwave technique,28 these results are compared and discussed with our theoretical findings.
2. Computational methods
The IPES of the complexes has been explored using perturbation theory. The supermolecular interaction energies were calculated with complete basis set (CBS) limit. Symmetry adapted calculation is performed to define the various physical forces responsible in formation of these complexes.
2.1. Geometry optimization and supermolecular interaction energy calculation
All geometry optimization of the monomers and 1![[thin space (1/6-em)]](https://www.rsc.org/images/entities/char_2009.gif) :1 weak vdW complexes of SO2–O2, SO2–N2 were performed using second-order Møller–Plesset (MP2) perturbation theory and Dunning's augmented correlation-consistent polarized valence double and triple zeta (aug-cc-pVXZ, X = D, T) basis sets. In our systems, correlation energies are likely to play an important role in interaction, so to include the correlation energies, augmented basis sets with diffuse functions have been implemented.29,30 This level of theory has been shown to produce reliable structural parameters in cases of weakly bound complexes.30–33 The same level of theory was used for harmonic frequency calculations to ensure if the optimized structures are true minimum. For better energetic description, single point energy calculation at coupled cluster method with single and double excitations and perturbative triples (CCSD(T)) and aug-cc-pVTZ basis set on MP2/aug-cc-pVTZ optimized structures were performed. CCSD(T) has been examined to provide reliable energy for weak vdW complex which are comparable with experimental results.34,35 The supermolecular interaction energies of the weak vdW complexes in this study are assumed to be small and the basis set superposition error (BSSE)36 associated with these complexes are important. Therefore, in this study BSSE is considered and is corrected with the full counterpoise correction (CP) procedure of Boys and Bernardi.37 All zero point corrected binding energies (D0) and BSSE-corrected binding energies (De) of the complexes are given in Table 3.
:1 weak vdW complexes of SO2–O2, SO2–N2 were performed using second-order Møller–Plesset (MP2) perturbation theory and Dunning's augmented correlation-consistent polarized valence double and triple zeta (aug-cc-pVXZ, X = D, T) basis sets. In our systems, correlation energies are likely to play an important role in interaction, so to include the correlation energies, augmented basis sets with diffuse functions have been implemented.29,30 This level of theory has been shown to produce reliable structural parameters in cases of weakly bound complexes.30–33 The same level of theory was used for harmonic frequency calculations to ensure if the optimized structures are true minimum. For better energetic description, single point energy calculation at coupled cluster method with single and double excitations and perturbative triples (CCSD(T)) and aug-cc-pVTZ basis set on MP2/aug-cc-pVTZ optimized structures were performed. CCSD(T) has been examined to provide reliable energy for weak vdW complex which are comparable with experimental results.34,35 The supermolecular interaction energies of the weak vdW complexes in this study are assumed to be small and the basis set superposition error (BSSE)36 associated with these complexes are important. Therefore, in this study BSSE is considered and is corrected with the full counterpoise correction (CP) procedure of Boys and Bernardi.37 All zero point corrected binding energies (D0) and BSSE-corrected binding energies (De) of the complexes are given in Table 3.
2.2. Complete basis set (CBS) extrapolation energies
The CBS extrapolation technique is used to estimate the energies of the SO2–O2, SO2–N2 complexes, the monomers and predict the equilibrium structure of these complexes. CBS method is less expensive and is found to be efficient in yielding accurate interaction energies.33 The different extrapolation models for calculating CBS energies show no significant difference amongst them.30,33 In this work, CBS extrapolation is performed using the model proposed by Helgaker38,39 with a series of correlation-consistent basis sets. This formula is found to have numerous applications and the generalized form is given by,| | | E(X) = ECBS + A(X − B)−α | (1) |
Here E(X) is the interaction energy, ECBS is CBS energy limit, X is an integer with values 2, 3, 4, and 5 for aug-cc-pVXZ basis sets and A, B, α are fitting parameters. Jeziorska et al.40 showed the most appropriate CBS interaction calculation is when B = 0 and α = 3. In the above relation to obtain CBS energy limit, B = 0 and α = 3 is used. The CBS calculations were performed with MP2 method and aug-cc-pVXZ (X = D, T, Q, and 5) basis sets on the MP2/aug-cc-pVTZ optimized geometries. CBS extrapolation using eqn (1) with a series of correlation-consistent polarized valence basis set has been successfully used for binding energy calculation of weak vdWs complexes.41,42 In ref. 41 and 42, the authors have found that the interaction energy calculated with CBS method is comparable with the higher computationally reliable methods. All MP2 single point energy calculations are BSSE corrected. The CBS binding energies of the complexes is compared with other supermolecular interaction energies.
All the above calculations were performed with Gaussian09 software.43 GaussView 5.0.9 software44 was used for the visualization of molecular structures and vibrational motions.
2.3. Symmetry-adapted perturbation theory (SAPT) calculation
SAPT provides the interaction energy calculation for weakly bound intermolecular complexes. This approach partitions the total interaction energy into physically definable components and is free from basis set superposition error. In SAPT calculation, the total interaction energy is decomposed into electrostatic (Eelst), exchange (Eexch), dispersion (Edisp) and induction (Eind) energies. The SAPT interaction energy, ESAPTint as perturbative series is given by| |  | (2) |
where, n is the order of intermolecular interaction operator and j denotes the order of Møller–Plesset fluctuation operator. Polarization energy Enjpol is obtained from Rayleigh–Schrodinger perturbation theory and exchange energy Enjexch results from the anti-symmetrization that is the symmetric adaptation of the dimer wave function.
In this study, three different levels of SAPT interaction energies SAPT0, SAPT2 and SAPT have been calculated, which are defined as
| | | ESAPT0int = E(10)elst + E(10)exch + E(20)ind,resp + E(20)exch-ind,resp + E(20)disp + E(20)exch-disp + δE(HF)int,resp | (3) |
| | | ESAPT2int = ESAPT0int + E(12)elst,resp + E(11)exch + E(12)exch + tE(22)ind + tE(22)exch-ind | (4) |
| | | ESAPTint = ESAPT2int + E(13)elst,resp + ε(1)exch(CCSD) − (E(11)exch + E(12)exch) + E(21)disp + E(22)disp | (5) |
where,
E(HF)int =
E(10)elst +
E(10)exch +
E(20)ind,resp +
E(20)exch-ind,resp + δ
E(HF)int,resp is supermolecular HF interaction energy and the rest are the correlation interaction energies.
In above equations E(1j)elst represents the classical electrostatic energy. Eexch, Edisp, Eind are repulsive-exchange, dispersion and induction energies respectively of different order. The induction energy is caused by the interaction of permanent multipole moment of one monomer and induced moment of other monomer whereas dispersion energy results from the correlation of the electron motion in the two monomers. The tE(22)ind is part of E(22)ind not included in E(20)ind,resp. The tE(22)exch-ind term is the estimated exchange counterpart of tE(22)ind. δE(HF)int,resp term accounts for the third and higher order induction and exchange-induction energy contribution. ‘resp’ subscript implies the inclusion of the coupled perturbed HF response. SAPT0 lacks the intramolecular correlation effect and the interaction energy SAPT2 includes intramolecular correlation.
All the SAPT calculations were performed using SAPT2012.2 program45 and for the integral calculation, GAMESS46 has been used. The basis sets used for SAPT calculation are cc-pVDZ, aug-cc-pVDZ and aug-cc-pVTZ and are denoted by VDZ, AVDZ and AVTZ respectively. It is expected that in the weakly bound systems of our studies, the interaction energies mainly arise from the induction and dispersion effect. For better description of the different interaction energy terms, the total SAPT energy is decomposed into four main terms as follows:
| | | Eelst = E(10)elst + E(12)elst,resp + E(13)elst,resp | (6) |
| | | Eexch = E(10)exch + E(20)elst-ind,resp + tE(20)exch-disp + ε(1)exch(CCSD) | (7) |
| | | Eind = E(20)ind,resp + tE(22)ind | (8) |
| | | Edisp = E(20)disp + E(21)disp + E(22)disp | (9) |
Thus
| | | ESAPTint = Eelst + Eexch + Eind + Edisp + δE(HF)int,resp | (10) |
Atom-pair wise additive density functional dispersion correction (DFT-D3)47 is found to have chemical accuracy in evaluating the dispersion interaction present in weak vdW complexes with the inclusion of standard Becke and Johnson (BJ) damping function.48 It is due to the inability of standard DFT calculations to correctly cover the long-range London dispersion interactions. The general expression of the corrected dispersion energy, Edisp is given by
| |  | (11) |
Here,
CABn is the averaged
nth-order dispersion coefficient for atom pair AB,
RAB is the internuclear distance between A and B,
sn is a functional-dependent scaling factor and
fdamp is the BJ-damping function.
In this study, dispersion energy correction, Edisp with BJ-damping function has been performed with Grimme's code49 of DFT-D3 Ver. 3.0 Rev 0 for B3LYP,50,51 TPSS52 and PBE53 functionals. The corresponding standard DFT calculations, EDFT with aug-cc-pVTZ basis set were performed as implemented in Gaussian09 software. The contribution of dispersion correction, Edisp which is missing from EDFT is added to EDFT to have the total DFT-D3 energies, EDFT-D3. These single point energy calculations of Edisp and EDFT have been performed on the MP2/aug-cc-pVTZ optimized structures to obtain the DFT-D3 energies, EDFT-D3. The dispersion corrected interaction energies, Eint(DFT-D3) of the complexes are given in Table 4. All these energies are CP-corrected.
2.4. Natural bond orbital (NBO) and atoms in molecules (AIM) analysis
The structural and bonding features of the 1:1 intermolecular complexes, SO2–O2 and SO2–N2 have been investigated by using the NBO54–58 theory. The calculations of the NBO analysis have been performed with the use of MP2/aug-cc-pVTZ on the optimized geometries at the same level of theory. The atoms in molecules (AIM) approach has been applied to analyze the topological properties of the electronic charge density at MP2/aug-cc-pVTZ using the AIMALL suite of program.59 The input wave functions for AIM calculations were created from the Gaussian software.
3. Results and discussions
3.1. Optimized geometries
The monomers and complex structures optimized at MP2 method and aug-cc-pVXZ (X = D, T) basis sets are shown in Fig. 1. The representative geometric parameters are given in Table 1. In the case of SO2–O2 complex, two minimum structures have been found. One of the minima is the stacked C1 (1a) and the other minima is 1b, which belongs to Cs point group. A nearly T-shaped equilibrium structure for SO2–N2 (minima 2a) corresponding to Cs symmetry has been found at all level of theories. In the three vdW complexes of SO2 (1a, 1b, 2a), SO2 is oriented in such a way that its oxygen atoms are straddling the O2 or N2 monomer. Structure 1a and 1b differ in the orientation of the O3–O4 unit. O2 monomer is parallel to the molecular symmetry plane of SO2, where one of O-atom of O2 molecule sits above the S-atom of SO2 monomer and other O-atom of O2 monomer is away of SO2 bond angle in 1a and towards the bond angle in 1b. The arrangement of the atoms of the constituent monomers in Cs structure of 2a is similar to structure 1b. In the case of SO2–N2 complex, molecular Cα-axis of N2 monomer is tilted by an angle from 90° making almost T-shaped structure. The rotational constants, dipole moment and nitrogen quadrupole coupling constants of the monomers and complexes computed with MP2/aug-cc-pVXZ (X = D, T) are given in Table 2.
 |
| | Fig. 1 Structures of SO2, O2, N2 and vdW complexes 1a, 1b and 2a computed at MP2 level with aug-cc-pVXZ (X = D, T). Structural parameters θ1, θ2 and Rcm are given in Table 1. | |
Table 1 MP2 optimized geometrical parameters of the monomers and minimized structures of the SO2–O2, SO2–N2 at aug-cc-pVTZ and available experimental results. aug-cc-pVDZ values are given in the bracketa
| Parameters |
MP2/aug-cc-pVTZ(MP2/aug-cc-pVDZ) |
Experiment |
| Monomer |
1a
|
1b
|
2a
|
Monomer |
2a
|
|
Bond lengths are in angstrom (Å) and angles are in degrees.
Experimental data are taken from ref. 70.
Experimental data are taken from ref. 71.
Experimental data taken from ref. 27.
|
| N–N |
1.12(1.13) |
— |
— |
1.12(1.13) |
1.10b |
|
| O–O |
1.25(1.26) |
1.25(1.26) |
1.25(1.26) |
|
1.21b |
|
| S–O |
1.46(1.51) |
1.46(1.51) |
1.46(1.51) |
1.46(1.51) |
1.43c |
|
| ∠OSO |
118.8(118.1) |
118.6(117.9) |
118.6(118.0) |
118.7(118.0) |
119.5c |
|
|
R
cm
|
— |
3.44(3.49) |
3.07(3.17) |
3.74(3.83) |
— |
3.89d |
|
|
|
θ1 |
— |
70.6(72.3) |
88.3(86.5) |
147.6(148.0) |
— |
155.5d |
|
θ2 |
— |
68.8(68.5) |
91.5(88.0) |
94.3(93.4) |
— |
94.8d |
Table 2 The rotational constants (MHz) and dipole moment (in Debye) of the complexes of SO2–O2 and SO2–N2 and monomers at MP2/aug-cc-pVXZ (X = D, T) and nuclear quadrupole moment, eQqcc (MHz) of SO2–N2 complex at MP2/aug-cc-pVTZ
| Species |
Basis set |
Rotational constants (MHz) |
Dipole moment (D) |
eQqcc (MHz) |
|
A
|
B
|
C
|
|
Experimental data from the ref. 70.
Experimental data from the ref. 71.
Experimental data from the ref. 27.
|
| N2 |
aug-cc-pVDZ |
— |
56353 |
— |
— |
|
| aug-cc-pVTZ |
— |
58155(59906)a |
— |
— |
|
|
|
| O2 |
aug-cc-pVDZ |
— |
39816 |
— |
— |
|
| aug-cc-pVTZ |
— |
40469(43100)a |
— |
— |
|
|
|
| SO2 |
aug-cc-pVDZ |
52743 |
9476 |
8033 |
1.737 |
|
| aug-cc-pVTZ |
56928(60778)b |
9956(10318)b |
8474(8799)b |
1.630(1.630)b |
|
|
|
|
1a
|
aug-cc-pVDZ |
7426 |
1896 |
1674 |
1.689 |
|
| aug-cc-pVTZ |
7870 |
1956 |
1727 |
1.692 |
|
|
|
|
1b
|
aug-cc-pVDZ |
6697 |
2121 |
1877 |
1.692 |
|
| aug-cc-pVTZ |
7040 |
2232 |
1975 |
1.577 |
1.27(14N1) 1.30(14N2) |
|
|
|
2a
|
aug-cc-pVDZ |
7853 |
1629 |
1434 |
1.704 |
(1.30)c |
| aug-cc-pVTZ |
8278(8832)c |
1703(1617)c |
1499(1432)c |
1.593(1.59)c |
|
The calculations for the monomers have also been performed to assess reliability of the computational methods adopted in this study. A comparison of ground state experimental values with theoretical results for the monomers is summarized in Table 1. It can be observed that the error associated with the bond length is within 0.04 Å and angle is 0.9° at MP2/aug-cc-pVTZ level. It indicates that the theoretical method used in this study is reliable in providing the geometrical parameters of the complexes. The structures of the complexes are described in terms of the separation (Rcm) of the center of masses of the monomers and the angles made by the molecular axes of both the monomers with Rcm. In Fig. 1, θ1 and θ2 are the angles between the molecular Cα-axis of O2 or N2 and C2-axis of SO2 respectively with Rcm. From Table 1, it can be observed that the Rcm value is the shortest (3.07 Å) in 1b when compared to the unsymmetrical 1a (3.44 Å) and in the symmetrical 2a complex, it has the largest value of 3.74 Å. SO2 has a permanent dipole moment while O2 and N2 have no dipole moment. There is only slight structural perturbation that has occurred after complexation of O2 or N2 with SO2. The experimentally obtained Rcm value of 3.89 Å is comparable with the theoretically determined value of 3.74 Å for SO2–N2 complex. The theoretical calculation by Connelly et al. to obtain minimum Rcm value along with their experimental study was done by rigid relaxation of the complex.28 The experimentally determined value of θ1 and θ2 for the complex 2a are similar to the theoretical values of the present study. θ1 is 147.6° in our calculation with MP2/aug-cc-pVTZ and 155.5° from experiment. θ2 is calculated to be 94.3° in this work with MP2/aug-cc-pVTZ and is 94.8° from experimental studies. The distance between the S-atom and nearest N-atom of N2 monomer in the equilibrium structure of 2a is found to be 3.36 Å, which is similar to the Juang et al., determined value of 3.45 Å. A comparison between values of Rcm, θ2 between the theoretical and experimental analysis of structure 2a are comparable and there is a slight deviation in the angle θ1, this difference is indicative of the large amplitude motion of N2 about the corresponding axis of the complex. Experimental evaluation of the N2-containing vdW complexes shows that N2 undergoes tunneling rotation within the complex.28,60 It is also established that if the other partner of the complex is non-linear then there is a possibility of multiple internal rotation.61
Ab initio calculations at MP2/aug-cc-pVTZ with additional keyword Prop = EFG yields theoretical electric field gradients of nitrogen, qaa, qbb, and qcc in standard orientation of the complex, and these values were rotated to the center of mass of the complex. Using the obtained values in center of mass, the theoretical 14N quadrupole coupling strength, eQqaa and eQqcc, for the complex can be determined. The 14N nuclear quadrupole moment value obtained by Bailey62 gives eQ/h as 4.5617(43) MHz per a.u., and this value can be multiplied by the calculated qxx (a.u.) to give the theoretical 14N quadrupole coupling strength in MHz for the complex. The calculated nuclear quadrupole moment for 14N1 and 14N2 in 2a complex is −4.23 MHz and −4.35 MHz respectively for eQqaa value, 1.26 MHz and 1.30 MHz, for eQqcc value. The experimental values27 of −3.63 MHz and 1.30 MHz are similar to the calculated values.
3.2. Supermolecular interaction energies
The supermolecular interaction energies of the studied complexes of SO2 with different basis sets are given in Table 3. This table contains the BSSE corrected, BSSE uncorrected and ZPE corrected energies of the complexes. The BSSE contribution to the interaction energies vary from 50% to 7% for SO2–O2 complexes and from 58% to 6% for SO2–N2 complex. It shows that the BSSE correction is important, which should be taken into account while calculating the interaction energies of these systems. The values of the interaction energies of the complexes are small (see Table 3). The MP2/aug-cc-pVXZ (X = D, T), BSSE corrected binding energy, De is 6.59 kJ mol−1 with aug-cc-pVDZ and 7.51 kJ mol−1 with aug-cc-pVTZ for minima 1b, which are higher than the corresponding value of 6.29 kJ mol−1 and 6.68 kJ mol−1 for the minima 1a. This implies that 1b structure of the SO2–O2 vdW complex is more stable than the 1a structure. It is also confirmed from the calculation at CBS limit and the correlation energy calculation with CCSD(T)/aug-cc-pVTZ. All the structural parameters in the complexes are CP-corrected. The CBS BSSE corrected interaction energy is 7.88 kJ mol−1 for 1b and 6.99 kJ mol−1 for 1a whereas CCSD(T) interaction energy is 6.23 kJ mol−1 for 1b and 5.45 kJ mol−1 for 1a. The distance Rcm is longer in 1a than in 1b and 1a shows lower binding energies at all levels of theories when compared to the structure 1b. The De value for the SO2–N2 complex is 4.37 kJ mol−1 at MP2/aug-cc-pVDZ and is 4.85 at MP2/aug-cc-pVTZ whereas CBS extrapolation gives 5.15 kJ mol−1. The Rcm value of 3.74 Å in 2a is higher than both the complexes of SO2–O2 and has lesser binding energy than 1a and 1b.
Table 3 The BSSE-corrected (De) and ZPE corrected (D0) binding energies at MP2 and CBS methods of the CP-corrected complexes SO2–O2 and SO2–N2. CCSD(T)/aug-cc-pVTZ//MP2/aug-cc-pVTZ are also given. All energies are in kJ mol−1
| Binding energies |
| Basis set |
1a
|
1b
|
2a
|
|
D
e
|
D
e
|
D
0
|
D
e
|
D
e
|
D
0
|
D
e
|
D
e
|
D
0
|
|
Binding energies are BSSE uncorrected.
|
| MP2/aug-cc-pVDZ |
−6.29 |
−9.33 |
−5.00 |
−6.59 |
−9.89 |
−4.89 |
−4.37 |
−6.89 |
−3.07 |
| MP2/aug-cc-pVTZ |
−6.68 |
−8.40 |
−5.22 |
−7.31 |
−9.30 |
−5.38 |
−4.85 |
−6.20 |
−3.42 |
| CBS |
−6.99 |
−7.43 |
— |
−7.88 |
−8.35 |
— |
−5.15 |
−5.46 |
— |
| CCSD(T)/aug-cc-pVTZ |
−5.45 |
−7.29 |
— |
−6.23 |
−8.35 |
— |
−4.12 |
−5.50 |
— |
3.3. SAPT interaction energies
A physical interpretation of the interaction energy can be obtained by partitioning it into various components by using perturbative methods. SAPT approach splits the total interaction energy into physically meaningful components. In this article, SAPT calculations have been performed as single point energy calculation for each of the three complex 1a, 1b and 2a of SO2 with the basis set of cc-pVDZ (VDZ), aug-cc-pVDZ (AVDZ) and aug-cc-pVTZ (AVTZ). The geometries used for SAPT calculations are MP2/aug-cc-pVTZ optimized and CP-corrected. The basis set AVDZ and AVTZ are large enough for providing reliable energy components. Calculation with VDZ basis set was carried out to evaluate the effect of diffusion functions in energy calculations. The total SAPT interaction energy (ESAPTint) is partitioned into the major energy terms of electrostatic (Eelst), exchange (Eexch), induction (Eind) and dispersion (Edisp) energies. Table 4 contains the corresponding SAPT results of different energy terms and the plots are shown in Fig. 2.
Table 4 Calculated SAPT interaction energies and its components for the three vdW complexes of SO2 in kJ mol−1 with VDZ, AVDZ and AVTZ basis sets
| Energy components |
VDZ |
AVDZ |
AVTZ |
| SO2:O2 |
SO2:N2 |
SO2:O2 |
SO2:N2 |
SO2:O2 |
SO2:N2 |
|
1a
|
1b
|
2a
|
1a
|
1b
|
2a
|
1a
|
1b
|
2a
|
|
E
(10)elst
|
0.74 |
0.49 |
−5.30 |
−6.86 |
1.16 |
−4.29 |
−6.09 |
1.03 |
−4.27 |
|
E
(12)elst,resp
|
−1.16 |
0.19 |
−0.43 |
−1.86 |
0.64 |
−0.71 |
−1.74 |
0.60 |
−0.52 |
|
E
(13)elst,resp
|
0.73 |
0.24 |
0.10 |
1.02 |
−0.04 |
0.30 |
1.17 |
−0.09 |
0.34 |
|
E
(10)exch
|
9.75 |
12.36 |
5.15 |
8.39 |
12.59 |
5.39 |
8.34 |
12.49 |
5.36 |
|
E
(11)exch
|
0.14 |
0.13 |
−0.05 |
−0.19 |
0.26 |
−0.005 |
−0.08 |
0.41 |
0.07 |
|
E
(12)exch
|
−0.34 |
−0.11 |
0.90 |
2.61 |
0.48 |
1.11 |
2.13 |
−0.18 |
0.80 |
|
t
E
(22)ex-ind
|
−0.08 |
−0.74 |
0.05 |
0.13 |
−0.45 |
0.09 |
0.12 |
−0.67 |
0.03 |
|
E
(20)ex-ind,resp
|
3.45 |
4.80 |
1.38 |
3.12 |
4.80 |
1.38 |
3.23 |
4.94 |
1.42 |
|
E
(20)exch-disp
|
0.49 |
0.62 |
0.28 |
0.67 |
0.91 |
0.40 |
0.78 |
1.05 |
0.45 |
|
E
(20)ind,resp
|
−5.52 |
−6.07 |
−2.04 |
−23.68 |
−6.44 |
−2.14 |
−21.80 |
−6.59 |
−2.19 |
|
t
E
(22)ind
|
0.36 |
0.93 |
−0.07 |
−1.00 |
0.61 |
−0.14 |
−0.79 |
0.89 |
−0.04 |
|
E
(20)disp
|
−4.14 |
−5.24 |
−3.62 |
−7.57 |
−9.77 |
−5.84 |
−8.67 |
−11.14 |
−6.42 |
|
E
(21)disp
|
1.34 |
1.82 |
1.38 |
1.80 |
2.85 |
1.86 |
1.85 |
3.00 |
1.93 |
|
E
(22)disp
|
−0.88 |
−1.28 |
−1.23 |
−2.24 |
−2.47 |
−1.98 |
−2.42 |
−2.59 |
−2.08 |
|
ε
(1)exch(CCSD) |
−0.26 |
0.003 |
1.23 |
3.16 |
0.73 |
1.53 |
2.48 |
0.05 |
1.12 |
|
δ
(HF)int,resp
|
1.58 |
−11.58 |
0.81 |
19.03 |
−12.12 |
−0.34 |
16.32 |
−11.86 |
−0.33 |
|
E
SAPT0int
|
−3.65 |
−4.62 |
−3.34 |
−6.90 |
−8.86 |
−5.44 |
−7.89 |
−10.08 |
−5.97 |
|
E
SAPT2int
|
−4.73 |
−4.22 |
−2.94 |
−7.20 |
−7.33 |
−5.08 |
−8.24 |
−9.02 |
−5.63 |
|
E
SAPTint
|
−3.60 |
−3.45 |
−2.32 |
−5.88 |
−6.99 |
−4.48 |
−7.21 |
−8.88 |
−5.19 |
|
E
elst
|
0.32 |
0.92 |
−5.63 |
−7.69 |
1.77 |
−4.70 |
−6.65 |
1.54 |
−4.44 |
|
E
exch
|
13.34 |
17.05 |
8.08 |
15.48 |
18.58 |
8.79 |
14.95 |
17.86 |
8.39 |
|
E
ind
|
−15.16 |
−5.14 |
−2.10 |
−24.68 |
−5.83 |
−2.28 |
−22.59 |
−5.70 |
−2.23 |
|
E
disp
|
−3.68 |
−4.69 |
−3.47 |
−8.01 |
−9.39 |
−5.95 |
−9.24 |
−10.72 |
−6.57 |
|
E
(B3LYP-D3)int
|
|
|
|
|
|
|
−5.79 |
−7.66 |
−4.75 |
|
E
(TPSS-D3)int
|
|
|
|
|
|
|
−5.36 |
−8.20 |
−4.34 |
|
E
(PBE-D3)int
|
|
|
|
|
|
|
−11.92 |
−15.58 |
−4.82 |
|
E
(MP2)int
|
|
|
|
|
|
|
−6.68 |
−7.31 |
−4.85 |
|
D
0
|
|
|
|
|
|
|
−5.22 |
−5.38 |
−3.42 |
| CCSD |
|
|
|
|
|
|
−5.45 |
−6.23 |
−4.12 |
| CBS |
−6.99 |
−7.88 |
−5.15 |
−6.99 |
−7.88 |
−5.15 |
−6.99 |
−7.88 |
−5.15 |
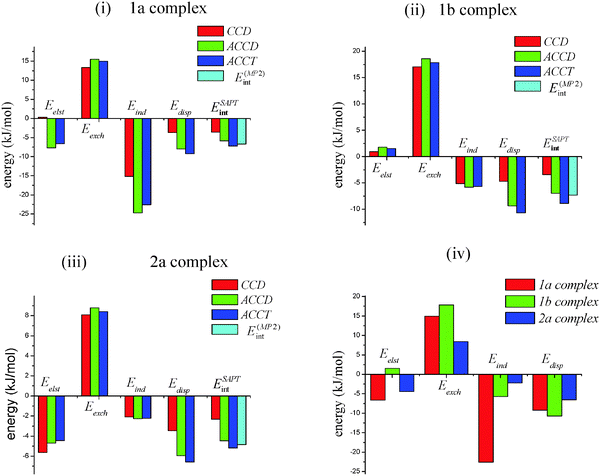 |
| | Fig. 2 Bar diagram (i), (ii), (iii) represents the SAPT interaction energy components with VDZ, AVDZ and AVTZ basis sets. (iv) is the comparison of SAPT interaction energies with AVTZ basis set amongst the complexes 1a, 1b, 2a optimized at MP2/aug-cc-pVTZ. | |
It is observed from Table 4 that VDZ basis set without the diffuse function leads to an underestimation of ESAPTint compared with the supermolecular interaction energy calculation. VDZ basis set underestimates each energy term when compared with AVDZ basis set as shown in Fig. 2(i)–(iii). AVDZ with the diffuse functions gives the comparable result for the total SAPT interaction energies. There is no significant change in the SAPT energy than the respective supermolecular energy calculated at MP2/aug-cc-pVTZ, CCSD(T)/aug-cc-pVTZ and CBS limit. There is a significant increase in stabilization energies of the complexes with AVDZ basis set when compared to the VDZ basis set. Therefore, for these complexes use of diffuse function is a necessity. The discrepancy between the VDZ calculated SAPT energy and MP2 calculation could also be seen from the Fig. 2(i)–(iii). The Cs complex shows greater stability than C1 complex of SO2–O2 and is in agreement with the supermolecular calculation as discussed above. The total SAPT energy and each major SAPT energy components show negligible difference between AVDZ and AVTZ basis sets. There is a small change in the energy terms for the three complexes of SO2 by going to larger basis set. It can be concluded that for these systems in this work, use of AVDZ basis set is adequate for the SAPT calculation compared to the AVTZ basis set which is associated with significant computational effort.
The individual energy components of SAPT interaction energies of the complexes 1a, 1b and 2a with the AVTZ basis set have been interpreted. It can be noticed from Table 4 and Fig. 2(iv), that there is a significant difference in the corresponding individual energy terms amongst the structures 1a, 1b and 2a. From the inspection of the energy components as given in Table 4, it can be concluded that the major contribution to the total interaction energy is from the induction energy (Eind) and dispersion energy (Edisp). In case of structure 1a, the attractive first order electrostatic energy term E(10)elst is compensated by the first order exchange repulsive E(10)exch term and is same for the structure of 2a of SO2 and N2. The E(10)elst is negligible in 1b structure while E(10)exch is repulsive. The major contribution to the interaction energy of these complexes comes from the attractive second-order induction energy, E(20)ind,resp and second-order dispersion energy, E(20)disp terms. These two terms are the dominant and attractive. They are the main contributors for the binding energy of the complexes in this study. The E(20)ind,resp is the electric polarization caused by the electric and nuclear charge. The ratio of Eind to the SAPT energy, ESAPTint are 3.13, 0.64 and 0.43 for 1a, 1b and 2a respectively. This shows that the induction energy term form a part of the total interaction energy and thus plays an important role in binding these systems. The dispersive effect ratio (Edisp/ESAPTint) is equal to 1.28 for 1a, 1.21 for 1b and 1.27 for 2a. This indicates that the dispersive effect is similar in all complexes. The energy term, δ(HF)int,resp contains the contribution from the higher order induction and exchange-induction effect to the stabilization of the complexes. In this study, this energy term is also an important and non-negligible to characterize the effects. The energy, δ(HF)int,resp is repulsive in 1a and more attractive in structure 1b. This shows that δ(HF)int,resp is important parameter, which contributes towards the extra stability of the complex 1b compared to 1a.
The interplay between the dispersion and induction effect in these intermolecular complexes can be understood by analyzing the ratio of dispersion energy to induction energy (Edisp/Eind). The ratio, Edisp/Eind is 0.41 in 1a, 1.88 in 1b and 2.95 in the 2a structure. From this ratio, it is predicted that the structure 1a formation is favored by the induction effect whereas structure 1b and 2a formation are favored by dispersion effect. This can also be explained in terms of the simple molecular properties of dipole moment. The dipole moment of SO2 at MP2/aug-cc-pVTZ is comparable with the experimental value (see Table 2). Since induction energy is due to the interaction of permanent multipole moment of the monomers, the structure 1a having the higher dipole moment than the structure 1b and 2a and even more than monomer SO2 at MP2/aug-cc-pVTZ is also reflected from the SAPT calculation where induction effect is dominant in structure 1a.
The dispersion corrected interaction energies, E(DFT-D3)int of the weak vdW complexes is also predicted by implementing the DFT-D3 method with B3LYP, TPSS and PBE functional and aug-cc-pVTZ basis set on the MP2/aug-cc-pVTZ optimized structures as shown in Table 4. From Table 4, it is noticed that with B3LYP and TPSS methods are showing similar interaction energies for all three structures.
3.4. Vibrational data analysis
The calculated vibrational frequencies and corresponding intensities of the monomers SO2, O2, N2 and the complexes 1a, 1b and 2a are presented in the Table 5 along with the literature values. Table 5 summarizes the data derived from MP2 method with aug-cc-pVDZ and aug-cc-pVTZ basis set. There is no experimental vibrational data available in the literature for the complexes. From Table 5, it is observed that the frequency data computed with aug-cc-pVTZ are much closer to the available data for the monomers. The geometries used for the vibrational analysis are CP-corrected.
Table 5 The calculated unscaled frequencies (in cm−1) and absolute intensities (km mol−1) of the monomers and the complexes of SO2–O2 and SO2–N2 at MP2/aug-cc-pVXZ(X = D, T). Bracket values are respective frequency and intensity shift from individual monomers
| Species |
Mode no. |
Mode description |
Frequency |
Intensity |
| aug-cc-pVDZ |
aug-cc-pVTZ |
aug-cc-pVDZ |
aug-cc-pVTZ |
|
Experimental data from the ref. 72.
Experimental data from the ref. 70.
Experimental data from the ref. 73.
|
| N2 |
1 |
N–N str |
2157 |
2187(2359)a |
— |
— |
|
|
| O2 |
1 |
O–O str |
1226 |
1262(1580)b |
— |
— |
|
|
| SO2 |
1 |
S–O symstr |
1022 |
1099(1151)c |
11.6 |
16.0(25)c |
| 2 |
S–O asymstr |
1207 |
1306(1362)c |
108.2 |
138.7(189)c |
| 3 |
O–S–O bend |
463 |
493(518)c |
22.1 |
23.9(25.2)c |
|
|
|
1a
|
1 |
O–O str |
1214(−12) |
1251(−11) |
0.4 |
0.1 |
| 2 |
S–O symstr |
1024(+2) |
1101(+2) |
11.5(−0.4) |
15.8(−1) |
| 3 |
S–O asymstr |
1207(+0.2) |
1304(−2) |
112.3(+4) |
141.7(+2) |
| 4 |
O–S–O bend |
464(+1) |
495(+2) |
21.3(−4) |
22.9(−5) |
| 5 |
S–O3str |
71 |
76 |
2.5 |
2.1 |
| 6 |
S–O4str |
56 |
59 |
4.1 |
6.3 |
| 7 |
O1–O4 |
41 |
49 |
9.3 |
6.9 |
| 8 |
SO2,O2librat. |
31 |
40 |
0.3 |
0.9 |
| 9 |
SO2,O2librat. |
26 |
30 |
1.46 |
1.2 |
|
|
|
1b
|
1 |
O–O str |
1218(−8) |
1255(−7) |
0.4 |
0.4 |
| 2 |
S–O symstr |
1025(+3) |
1102(+3) |
12.0(+4) |
16.1(0.7) |
| 3 |
S–O asymstr |
1207(+0.4) |
1304(−2) |
115.0(+6) |
144.0(+4) |
| 4 |
O–S–O bend |
464(+1) |
494(+1) |
20.5(−7) |
22.0(−8) |
| 5 |
S–O3str |
89 |
96 |
12.1 |
10.8 |
| 6 |
S–O4str |
71 |
81 |
2.6 |
6.0 |
| 7 |
SO2,O2librat. |
52 |
60 |
3.5 |
1.8 |
| 8 |
SO2,O2librat. |
42 |
49 |
0.5 |
0.6 |
| 9 |
SO2,O2librat. |
32 |
42 |
0.1 |
0.0 |
|
|
|
2a
|
1 |
N–N str |
2156(−1) |
2185(−2) |
0.1 |
0.1 |
| 2 |
S–O symstr |
1024(+2) |
1101(+2) |
11.8(+2) |
16.0(+0.1) |
| 3 |
S–O asymstr |
1208(+1) |
1306(+0.4) |
105.3(−3) |
133.9(−4) |
| 4 |
O–S–O bend |
464(+1) |
495(+2) |
21.1(−5) |
22.8(−5) |
| 5 |
S–N1str |
56 |
61 |
9.5 |
10.3 |
| 6 |
SO2,N2librat. |
63 |
66 |
0.1 |
0.02 |
| 7 |
SO2,N2librat. |
60 |
68 |
0.02 |
0.3 |
| 8 |
SO2,N2librat. |
18 |
24 |
7.4 |
5.9 |
| 9 |
SO2,N2librat. |
18 |
20 |
0.1 |
0.2 |
There is a smaller shift in frequencies and intensities in the complexes from the individual monomers for different modes of vibrations. The vibrational frequencies related to the intermolecular stretching correspond to the large amplitude motion and are of lower frequencies. The changes occurring in the vibrational frequencies are due to the dipole quadrupole interaction between the monomers. There is a red shift of 1 cm−1 at MP2/aug-cc-pVDZ and of 2 cm−1 at MP2/aug-cc-pVTZ for N2 stretching mode in complex 2a from the monomer. The N2 harmonic stretching frequency is equal to 2187 cm−1 in the monomer and it decrease to 2185 cm−1 in the complex 2a at MP2/aug-cc-pVTZ level. The O2 stretching mode is also red shifted by 12 cm−1 at aug-cc-pVDZ and 11 cm−1 at aug-cc-pVTZ in complex 1a whereas the red shift is of 8 cm−1 at aug-cc-pVDZ and 7 cm−1 at aug-cc-pVTZ in complex 1b. The harmonic stretching frequency associated with the S–O bond stretching (symmetric and asymmetric) and the bending O–S–O modes of SO2 unit are increased in the complex 2a when compared with the respective values in the monomer. The S–O symmetric stretching is blue shifted by 2 cm−1 both in complex 1a and 2a at aug-cc-pVDZ and aug-cc-pVTZ and it is also blue shifted 3 cm−1 in case of the complex 1b. From the Table 5 it is observed that the shifting in stretching frequency of O2 and N2 upon complex formation is small and it indicates that these are weak complexes and thus the interaction of the induced dipole in O2 and N2 with SO2 molecule affects little the stretching vibrations. The different vibrational modes associated with intermolecular motions are calculated and are given in the Table 5. From this table, it is clear that the intermolecular vibrations are of quite low frequency and low intensity. Calculation of these low frequencies can play an important role for experimentalist in characterizing the molecular vibrations in the complexes.
3.5. Orbital interaction analysis
The bonding features in terms of interorbital interaction present in the complexes, SO2–O2 and SO2–N2 have been studied by performing NBO analysis, which is computed at MP2/aug-cc-pVTZ level of theory. The secondary perturbation energies (Ei) and related donor–acceptor orbitals of the monomers are summarized in the Table 6. In this study, the bondings in the vdW complexes are found to be caused by the charge transfer from lone pairs of X-atom of X2 (X = O, N) unit to the antibonding orbitals of SO of SO2 unit. In complex 1a, the charge transfer occurred from the O-atom lone pairs of O2 to each of σ* and π* antibonding SO orbital giving interaction energy of amount 0.46 kJ mol−1 and 0.75 kJ mol−1 respectively. In complex 1b, the main contribution comes from the charge transfer from O-atom lone pair of O2 to π* antibonding SO orbital, which amounts to 3.06 kJ mol−1 followed by another charge transfer from O-atom lone pair of O2 to σ* antibonding SO orbital amounting 0.34 kJ mol−1. The higher stabilization energy for the charge transfer from O-lone pair of O2 to SO antibonding orbital suggests that structure 1b is more stable than structure 1a. In the 2a complex, the interaction energy for the charge transfer from the N-atom lone pair to the σ* antibonding SO orbital is 0.25 kJ mol−1 and this is lower than the non-Lewis type Slp → Ryd*(N) amounting 0.34 kJ mol−1. The lowest stability of complex 2a, having the lowest orbital interaction energy among the three complexes is found to be consistent with the results of the other interaction energy calculations. The pictorial diagrams of electron density surface of the three vdW complexes investigated in this study are shown in Fig. 3.
Table 6 The secondary perturbation NBO energies (Ei, in kJ mol−1) of the SO2–O2 and SO2–N2 complexes computed at the level of MP2/aug-cc-pVTZ
| Species |
Donor/acceptor |
Interaction orbital |
E
i
|
|
1a
|
O2/SO2 |
Olp → σ*(SO) |
0.46 |
|
|
O2/SO2 |
Olp → π*(SO) |
0.75 |
| |
|
1b
|
O2/SO2 |
Olp → σ*(SO) |
0.34 |
|
|
O2/SO2 |
Olp → π*(SO) |
3.06 |
| |
|
2a
|
N2/SO2 |
Nlp → σ*(SO) |
0.29 |
 |
| | Fig. 3 The plot of electron density surface of the monomers and the complexes SO2–O2 and SO2–N2 at isosurface value of ±0.0004 a.u. at MP2/aug-cc-pVTZ level. Blue, green, yellow and red colors define the region from more positive values to the region of negative values. Two different views with respect to molecular/complex plane and normal plane are shown for the monomers and complexes. | |
The quantum theory of atoms in molecules (QTAIM)63,64 has become an important tool which reveals the chemical bonding present in molecules in terms of electron density, ρ at bond critical points (BCP).65 The topological parameter of ρ, at the BCP in the complexes of SO2 are summarized in Table 7. From the data in Table 7, it can be observed that the ρ value for the S–O3 interaction in the SO2–O2 complexes is in the range of 0.008–0.009 a.u. while it is of 0.006 a.u. in SO2–N2 complex for the bond between S and N1. The low value of ρ shows that these are weak intermolecular vdW bonds. This is indicated by minor structural changes in geometric parameters of the monomers in complexes and also smaller perturbation in harmonic stretching frequencies.
Table 7 The AIM calculated electron density (ρ, in a.u.) of bond critical points (BCP) of the monomers and SO2–O2 and SO2–N2 complexes computed at the level of MP2/aug-cc-pVTZ
| Monomers |
ρ
|
Complexes |
ρ
|
| SO2 |
1a
|
| S–O1 |
0.281 |
S–O1 |
0.281 |
| S–O2 |
0.281 |
S–O2 |
0.281 |
|
|
|
O3–O4 |
0.468 |
|
|
|
S–O3 |
0.008 |
| |
| O2 |
1b
|
| O3–O4 |
0.470 |
S–O1 |
0.281 |
|
|
|
S–O2 |
0.281 |
|
|
|
O3–O4 |
0.470 |
|
|
|
S–O3 |
0.009 |
| |
| N2 |
2a
|
| N1–N2 |
0.681 |
S–O1 |
0.281 |
|
|
|
S–O2 |
0.281 |
|
|
|
N1–N2 |
0.680 |
|
|
|
S–N1 |
0.006 |
4. Atmospheric consequences
The complexes of SO2 with O2 and N2 exhibit several low frequency intermolecular vibrational modes. Due to the presence of these vibrational modes, the complexes can absorb the IR radiation. The average concentration of SO2 in atmosphere66 is approximately 1 × 10³ ppt (parts per trillion), and its concentration rises to 1 × 10⁶ ppt after a volcanic eruption. The higher SO2 concentration is known to linger for several days before it gets oxidized to form aerosol particles.21 The estimation of the atmospheric concentration of the studied complexes at 298.15 K and 1 atmosphere can be calculated by applying the following expression| |  | (12) |
where P represents the partial pressure and ΔG is Gibb's free energy change, Y = [O2] or [N2] for the respective complexes. Second-order vibrational perturbation theory as implemented in Gaussian09 has been used to perform the anharmonic frequency calculation at MP2/aug-cc-pVTZ to obtain the anharmonic corrected thermochemical parameters of enthalpy and entropy. These corrected data are then used to predict the atmospheric concentration of the complexes. The thermochemical data of change in enthalpy (ΔH), change in entropy (ΔS) and Gibb's free energy change (ΔG) of the SO2–O2 and SO2–N2 complex formation at 298.15 K and 1 atmosphere are given in Table 8. The atmospheric concentration of N2 and O2 are 7.8 × 10¹¹ ppt and 2.1 × 10¹¹ ppt respectively. Substituting these concentration values in eqn (12), the equilibrium concentration of the complex 1a, 1b and 2a in atmosphere can be calculated. Using expression (12), the concentration of 1a, 1b and 2a are calculated to be 0.002 ppt, 0.04 ppt and 2.30 ppt respectively in atmosphere and are 2 ppt, 39 ppt and 2300 ppt respectively after volcanic eruption under the ambient atmospheric condition. After a volcano eruption, the concentration of N2 molecules increases67 and concentration of O2 decreases due to oxidation process for few days. Hence, calculated value of 2300 ppt is a lower limit for nitrogen complex and 2 ppt, 39 ppt is the upper limit for both the oxygen complex. The relative concentration of 1a, 1b and 2a complexes to SO2 concentration are 1.8 × 10⁻⁴, 3.9 × 10⁻³ and 2.3 × 10⁻¹% respectively. Though these relative concentrations are low in number but they can have role in atmospheric chemistry like chlorofluorocarbon (CFC), hydrochlorofluorocarbon (HCFC), hydrofluorocarbon (HFC) which have the concentration range of 3–550 ppt in atmosphere and are considered to have the greater potential to increase the green house effect than CO2.68,69 The complexes of SO2 with O2 and N2 with such a concentration might also play an important role in atmospheric chemistry.
Table 8 Thermochemical parameters of change in enthalpy (ΔH, in kJ mol−1), change in entropy (ΔS, in J mol−1 K) and Gibb's free energy change (ΔG, in kJ mol−1, ΔG = ΔH − TΔS) of the SO2–O2 (1a, 1b) and SO2–N2 (2a) complex formation calculated at MP2/aug-cc-pVTZ. Thermochemical parameters of enthalpy and entropy are anharmonic corrected
| Parameters |
1a
|
1b
|
2a
|
| ΔH |
−6.62 |
−1.00 |
3.80 |
| ΔS |
−118.99 |
−74.88 |
−35.72 |
| ΔG |
28.86 |
21.32 |
14.44 |
5. Conclusion
The complexes studied in this work are important from the atmospheric point of view. The ground state bonding features, energies and spectroscopic properties of 1:1 vdW complexes of SO2–O2 and SO2–N2 have been investigated using high level ab initio methods and basis sets. Two minimum structures for SO2 with O2 and one with N2 have been determined and characterized. In both the cases, the most stable equilibrium configurations of the complexes are found to have the Cs symmetry where one atom of O2 or N2 is facing the S atom of SO2 (see Fig. 1). The complex 1b of SO2–O2 is determined to have higher binding energy at all levels of theory than SO2–N2 complex. From the SAPT calculation, it can be concluded that the stable two configurations (1b and 2a) are dispersive effect dominated. The ratio of dispersion to the induction energies for 1b is 1.88 and for 2a it is 2.95. The binding energy calculations show that these complexes contain weak intermolecular vdW forces, which is reinforced by frequency, NBO and AIM analysis. The calculated IR absorption spectrums of the complexes are also discussed and it has been found that the studied complexes of SO2 show several low intermolecular vibrational frequencies in the far IR region.
Acknowledgements
S.B. is thankful to Indian Institute of Technology Patna for financial support and for providing research facilities at IIT Patna.
References
- L. Sun, I. I. Ioannou and R. L. Kuczkowski, Mol. Phys., 1996, 88, 255–268 CrossRef CAS.
- R. G. A. Bone, L. S. C. Ruth, R. D. Amos and A. J. Stone, J. Chem. Phys., 1992, 96, 8390–8410 CrossRef CAS PubMed.
- V. M. Rayón and J. A. Sordo, Chem. Phys. Lett., 2001, 341, 575–584 CrossRef.
- J. Cukras and J. Sadlej, THEOCHEM, 2007, 819, 41–51 CrossRef CAS PubMed.
- L. M. Azofra and S. Scheiner, J. Chem. Phys., 2014, 140, 034302 CrossRef PubMed.
- L. M. Azofra and S. Scheiner, Phys. Chem. Chem. Phys., 2014, 16, 5142–5149 RSC.
- S. Leutwyler and J. Böesiger, Chem. Rev., 1990, 90, 489–507 CrossRef CAS.
- Th. Weber and H. J. Neusser, J. Chem. Phys., 1991, 94, 7689–7699 CrossRef CAS PubMed.
- S. Lee, J. Romascan, P. M. Felker, T. B. Pedersen, B. Fernández and H. Koch, J. Chem. Phys., 2003, 118, 1230–1241 CrossRef CAS PubMed.
- A. Castleman Jr. and P. Hobza, Chem. Rev., 1994, 94, 1721–1722 CrossRef.
- V. Vaida, H. G. Kjaergaard, P. E. Hintze and D. J. Donaldson, Science, 2003, 299, 1566–1568 CrossRef CAS PubMed.
- S. Chattopadhyay and P. L. M. Plummer, J. Chem. Phys., 1990, 93, 4187–4191 CrossRef CAS PubMed.
- G. E. Likens and F. H. Bormann, Science, 1974, 184, 1176–1179 CAS.
-
N. Bunce, Environmental Chemistry, Wuerz Publishing Ltd., Winnipeg, 1994, 2nd edn, p. 376 Search PubMed.
-
B. J. Finlayson-Pitts and J. N. Pitts Jr., Atmospheric Chemistry: Fundamentals and Experimental Techniques, Wiley, New York, 1986, p. 1098 Search PubMed.
-
J. G. Calvert and W. R. Stockwell, Mechanisms and Rates of Gas-Phase Oxidations of Sulfur Dioxide and Nitrogen Oxides in the Atmosphere, in SO2, NO and NOx Oxidation Mechanisms: Atmospheric Considerations, ed. J. G. Calvert, Butterworths, Toronto, ON, 1984, pp. 1–62 Search PubMed.
-
H. S. El-Zanan, Theoretical and Modeling studies of the Atmospheric Chemistry of Sulfur oxide and Hydroxyl Radical Systems, University of Nevada Reno, 2007, p. 3 Search PubMed.
- IARC, Sulfur Dioxide and Some Sulfites, Bisulfites and Metabisulfites, IARC Monographs on the Evaluation of Carcinogenic Risk to Human, 1992, IARC Working Group, TA, vol. 54, pp. 131–188.
-
M. A. Holloway and P. R. Wayne, Atmospheric Chemistry, RSC Publishing, 2010, p. 116 Search PubMed.
- V. Vaida and D. J. Donaldson, Phys. Chem. Chem. Phys., 2014, 16, 827–836 RSC.
- C. S. Zender, J. Geophys. Res., 1999, 104, 24471–24484 CrossRef CAS.
- H. G. Kjaergaard, G. R. Low, T. W. Robinson and D. L. Howard, J. Phys. Chem. A, 2002, 106, 8955–8962 CrossRef CAS.
- T. W. Robinson and H. G. Kjaergaard, J. Chem. Phys., 2003, 119, 3717–3720 CrossRef CAS PubMed.
- J. A. G. Gomes, J. L. Gossage, H. Balu, M. Kesmez, F. Bowen, R. S. Lumpkin and D. L. Cocke, Spectrochim. Acta, Part A, 2005, 61, 3082–3086 CrossRef PubMed.
- D. J. Lary, M. Balluch and S. Bekki, Q. J. R. Meteorol. Soc., 1994, 120, 1683–1688 CrossRef.
- V. E. Fioletov, E. Griffioen, J. B. Kerr, D. I. Wardle and O. Uchino, Geophys. Res. Lett., 1998, 25, 1665–1668 CrossRef CAS.
- Y. D. Juang, M. A. Walsh, A. K. Lewin and T. R. Dyke, J. Chem. Phys., 1992, 97, 832–840 CrossRef CAS PubMed.
- J. P. Connelly, M. Meuwly, A. R. Auty and B. J. Howard, J. Mol. Spectrosc., 2000, 199, 205–216 CrossRef CAS PubMed.
- R. A. Kendall, T. H. Dunning Jr. and R. J. Harrison, J. Chem. Phys., 1992, 96, 6796–6806 CrossRef CAS PubMed.
- H. Valdés and J. A. Sordo, J. Phys. Chem. A, 2002, 106, 3690–3701 CrossRef.
- V. M. Rayón and J. A. Sordo, J. Chem. Phys., 1999, 110, 377–384 CrossRef PubMed.
- D. Hauchecorne and A. W. Herrebout, J. Phys. Chem. A, 2013, 117, 11548–11557 CrossRef CAS PubMed.
- M. Gronowski, R. Kołos and J. Sadlej, J. Phys. Chem. A, 2012, 116, 5665–5673 CrossRef CAS PubMed.
- D. Feller and J. A. Sordo, J. Chem. Phys., 2000, 113, 485–493 CrossRef CAS PubMed.
- L. Zheng, S.-Y. Lee, Y. Lu and M. Yang, J. Chem. Phys., 2013, 138, 044302 CrossRef PubMed.
- B. Liu and A. D. McLean, J. Chem. Phys., 1973, 59, 4557–4558 CrossRef CAS PubMed.
- S. F. Boys and F. Bernardi, Mol. Phys., 1970, 19, 553–566 CrossRef CAS.
- T. Helgaker, W. Klopper, H. Koch and J. Noga, J. Chem. Phys., 1997, 106, 9639–9646 CrossRef CAS PubMed.
- A. Halkier, T. Helgaker, P. Jorgensen, W. Klopper, H. Koch, J. Olsen and A. K. Wilson, Chem. Phys. Lett., 1998, 286, 243–252 CrossRef CAS.
- M. Jeziorska, W. Cencek, K. Patkowski, B. Jeziorski and K. Szalewicz, Int. J. Quantum Chem., 2008, 108, 2053–2075 CrossRef CAS.
- S. Du and J. S. Francisco, J. Chem. Phys., 2009, 131, 064307 CrossRef PubMed.
- C. E. Cotton, J. S. Francisco, R. Linguerri and A. O. Mitrushchenkov, J. Chem. Phys., 2012, 136, 184307 CrossRef PubMed.
-
M. J. Frisch, G. W. Trucks, H. B. Schlegel, G. E. Scuseria, M. A. Robb, J. R. Cheeseman, G. Scalmani, V. Barone, B. Mennucci, G. A. Petersson, H. Nakatsuji, M. Caricato, X. Li, H. P. Hratchian, A. F. Izmaylov, J. Bloino, G. Zheng, J. L. Sonnenberg, M. Hada, M. Ehara, K. Toyota, R. Fukuda, J. Hasegawa, M. Ishida, T. Nakajima, Y. Honda, O. Kitao, H. Nakai, T. Vreven, J. A. Montgomery Jr., J. E. Peralta, F. Ogliaro, M. Bearpark, J. J. Heyd, E. Brothers, K. N. Kudin, V. N. Staroverov, T. Keith, R. Kobayashi, J. Normand, K. Raghavachari, A. Rendell, J. C. Burant, S. S. Iyengar, J. Tomasi, M. Cossi, N. Rega, J. M. Millam, M. Klene, J. E. Knox, J. B. Cross, V. Bakken, C. Adamo, J. Jaramillo, R. Gomperts, R. E. Stratmann, O. Yazyev, A. J. Austin, R. Cammi, C. Pomelli, J. W. Ochterski, R. L. Martin, K. Morokuma, V. G. Zakrzewski, G. A. Voth, P. Salvador, J. J. Dannenberg, S. Dapprich, A. D. Daniels, O. Farkas, J. B. Foresman, J. V. Ortiz, J. Cioslowski and D. J. Fox, Gaussian 09, Revision B.01, Gaussian, Inc., Wallingford, CT, 2010 Search PubMed.
-
R. Dennington, T. Keith and J. Millam, GaussView, Version 5, Semichem Inc., Shawnee Mission KS, 2009 Search PubMed.
-
R. Bukowski, W. Cencek, P. Jankowski, M. Jeziorska, B. Jeziorski, A. S. Kucharski, F. V. Lotrich, J. A. Misquitta, R. Moszyński, K. Patkowski, R. Podeszwa, F. Rob, S. Rybak, K. Szalewicz, L. H. Williams, J. R. Wheatley, E. S. P. Wormer and S. P. Żuchowski, SAPT2012: An Ab Initio Program for Symmetry-Adapted Perturbation Theory Calculations of Intermolecular Interaction Energies. Sequential and parallel versions, http://www.physics.udel.edu/%E2%88%BCszalewic/SAPT/SAPT.html Search PubMed.
- M. W. Schmidt, K. K. Baldridge, J. A. Boatz, S. T. Elbert, M. S. Gordon, J. H. Jensen, S. Koseki, N. Matsunaga, K. A. Nguyen, S. J. Su, T. L. Windus, M. Dupuis and J. A. Montgomery, J. Comput. Chem., 1993, 14, 1347–1363 CrossRef CAS.
- S. Grimme, J. Antony, S. Ehrlich and H. Krieg, J. Chem. Phys., 2010, 132, 154104 CrossRef PubMed.
- S. Grimme, S. Ehrlich and L. Goerigk, J. Comput. Chem., 2011, 32, 1456–1465 CrossRef CAS PubMed.
- DFT-D3 - A dispersion correction for DFT-functionals, http://www.thch.unibonn.de/tc/index.php?section=downloads&subsection=DFT-D3&lang=english.
- A. D. Becke, J. Chem. Phys., 1993, 98, 5648–5652 CrossRef CAS PubMed.
- C. Lee, W. Yang and R. G. Parr, Phys. Rev. B, 1988, 37, 785–789 CrossRef CAS.
- J. Tao, J. P. Perdew, V. N. Staroverov and G. E. Scuseria, Phys. Rev. Lett., 2003, 91, 146401 CrossRef.
- J. P. Perdew, K. Burke and M. Ernzerhof, Phys. Rev. Lett., 1996, 77, 3865–3868 CrossRef CAS.
- J. P. Foster and F. Weinhold, J. Am. Chem. Soc., 1980, 102, 7211–7218 CrossRef CAS.
- A. E. Reed and F. Weinhold, J. Chem. Phys., 1983, 78, 4066–4073 CrossRef CAS PubMed.
- A. E. Reed, L. A. Curtiss and F. Weinhold, Chem. Rev., 1988, 88, 899–926 CrossRef CAS.
-
F. Weinhold and J. E. Carpenter, in The Structure of Small Molecules and Ions, ed. R. Naaman and Z. Vager, Plenum, 1988, pp. 227–236 Search PubMed.
- F. Weinhold, J. Comput. Chem., 2012, 33, 2363–2379 CrossRef CAS PubMed.
-
T. A. Keith, AIMALL, version 13.11.04, TK Gristmill Software, Overland Park, KS, USA, 2013, http://aim.tkgristmill.com Search PubMed.
- J. P. Connelly, S. P. Duxon, S. K. Kennedy and B. J. Howard, J. Mol. Spectrosc., 1996, 175, 85–98 CrossRef CAS.
- H. O. Leung, M. D. Marshall, R. D. Suenram and F. J. Lovas, J. Chem. Phys., 1989, 90, 700–712 CrossRef CAS PubMed.
- W. C. Bailey, Chem. Phys., 2000, 252, 57–66 CrossRef CAS.
-
R. F. W. Bader, Atoms in Molecules, A Quantum Theory, Clarendon Press, Oxford, England, 1990 Search PubMed.
- R. F. W. Bader, Chem. Rev., 1991, 91, 893–928 CrossRef CAS.
-
C. F. Matta and R. J. Boyd, In the Quantum Theory of Atoms in Molecules: From Solid State to DNA
and Drug Design, Wiley-VCH, Weinheim, Germany, 2007 Search PubMed.
-
L. A. Owen and K. T. Pickering, An Introduction to Global Environmental Issues, Taylor & Francis, 1997, p. 33, ISBN 978-0-203-97400-1 Search PubMed.
- L. J. Elkins, T. P. Fischer, D. R. Hilton, Z. D. Sharp, S. McKnight and J. Walker, Geochim. Cosmochim. Acta, 2006, 70, 5215–5235 CrossRef CAS PubMed.
-
T. J. Blasting, Recent Greenhouse Gas concentrations, 2013, DOI: http://10.3334/CDIAC/atg.032, http://cdiac.ornl.gov/pns/current_ghg.html.
- V. Ramanathan and Y. Feng, Atmos. Environ., 2009, 43, 37–50 CrossRef CAS PubMed.
-
K. P. Huber and G. Herzberg, Molecular Spectra and Molecular Structure. IV. Constants of Diatomic Molecules, Van Nostrand Reinhold Co., 1979 Search PubMed.
-
G. Herzberg, Electronic spectra and electronic structure of polyatomic molecules, Van Nostrand, New York, 1966 Search PubMed.
-
T. Shimanouchi, Tables of Molecular Vibrational Frequencies, Consolidated Volume 1, NSRDS NBS-39.
-
W. B. Person and G. Zerbi, Vibrational Intensities in Infrared and Raman Spectroscopy, Elsevier, Amsterdam, 1982 Search PubMed.
|
| This journal is © the Owner Societies 2014 |
Click here to see how this site uses Cookies. View our privacy policy here.  Open Access Article
 This Open Access Article is licensed under a Creative Commons Attribution-Non Commercial 3.0 Unported Licence


