 Open Access Article
 This Open Access Article is licensed under a
 Creative Commons Attribution 3.0 Unported Licence
Ozonolysis of methyl oleate monolayers at the air–water interface: oxidation kinetics, reaction products and atmospheric implications†
Christian
Pfrang
*a,
Federica
Sebastiani
ab,
Claire O. M.
Lucas
c,
Martin D.
King
c,
Ioan D.
Hoare
a,
Debby
Chang
d and
Richard A.
Campbell
b
aDepartment of Chemistry, University of Reading, Whiteknights, PO Box 224, Reading RG6 6AD, UK. E-mail: c.pfrang@reading.ac.uk; Fax: +44 (0)118 378 6331; Tel: +44 (0)118 378 8789
bInstitut Laue-Langevin, BP 156, 38042 Grenoble Cedex 9, France
cDepartment of Earth Sciences, Royal Holloway University of London, Egham, Surrey TW20 0EX, UK
dPhysical Chemistry, Lund University, 22100 Lund, Sweden
First published on 28th May 2014
Abstract
Ozonolysis of methyl oleate monolayers at the air–water interface results in surprisingly rapid loss of material through cleavage of the C![[double bond, length as m-dash]](https://www.rsc.org/images/entities/char_e001.gif) C bond and evaporation/dissolution of reaction products. We determine using neutron reflectometry a rate coefficient of (5.7 ± 0.9) × 10−10 cm2 molecule−1 s−1 and an uptake coefficient of ∼3 × 10⁻⁵ for the oxidation of a methyl ester monolayer: the atmospheric lifetime is ∼10 min. We obtained direct experimental evidence that <2% of organic material remains at the surface on atmospheric timescales. Therefore known long atmospheric residence times of unsaturated fatty acids suggest that these molecules cannot be present at the interface throughout their ageing cycle, i.e. the reported atmospheric longevity is likely to be attributed to presence in the bulk and viscosity-limited reactive loss. Possible reaction products were characterized by ellipsometry and uncertainties in the atmospheric fate of organic surfactants such as oleic acid and its methyl ester are discussed. Our results suggest that a minor change to the structure of the molecule (fatty acid vs. its methyl ester) considerably impacts on reactivity and fate of the organic film.
C bond and evaporation/dissolution of reaction products. We determine using neutron reflectometry a rate coefficient of (5.7 ± 0.9) × 10−10 cm2 molecule−1 s−1 and an uptake coefficient of ∼3 × 10⁻⁵ for the oxidation of a methyl ester monolayer: the atmospheric lifetime is ∼10 min. We obtained direct experimental evidence that <2% of organic material remains at the surface on atmospheric timescales. Therefore known long atmospheric residence times of unsaturated fatty acids suggest that these molecules cannot be present at the interface throughout their ageing cycle, i.e. the reported atmospheric longevity is likely to be attributed to presence in the bulk and viscosity-limited reactive loss. Possible reaction products were characterized by ellipsometry and uncertainties in the atmospheric fate of organic surfactants such as oleic acid and its methyl ester are discussed. Our results suggest that a minor change to the structure of the molecule (fatty acid vs. its methyl ester) considerably impacts on reactivity and fate of the organic film.
1 Introduction
Aerosols directly impact on the atmosphere, our climate and public health. They scatter and absorb solar radiation, affect the formation of clouds and precipitation, and exert a crucial influence on atmospheric trace gases via heterogeneous chemical reactions.1,2 The chemical composition of atmospheric aerosols may alter the water cycle and thus impact on the availability of fresh water as well as the occurrence of flood events. Most atmospheric aerosols are covered in surfactants or contain surface-active organic compounds and these organic surface layers can influence the behaviour and lifetime of aerosols.3 The study of reactions and structure at the air–water interface thus provides key information on aerosol properties and its atmospheric fate.Oxidation in the atmosphere is predominantly initiated by nitrate radicals, NO3, hydroxyl radicals, OH and ozone, O3. Atmospheric lifetimes of volatile organic compounds are largely determined by the rate coefficients of the reactions with NO3, OH and O3,4,5 but mass transport parameters into and within particles are important additional factors for organic aerosol components. The rates of chemical reactions in the bulk and particularly at surfaces are poorly determined.6–8 Atmospheric reactions at the air–water interface are of key importance, but are currently not well understood mainly because of the lack of experimental data. Kinetic parameters for monolayer oxidation are key input for model studies aiming to de-convolute surface and bulk processes of atmospheric aerosols.7–9
Methyl oleate is a popular model system for atmospheric aerosols.6,10–12 It is a convenient alternative to the well studied oleic acid since its ozonolysis reaction is not complicated by secondary reactions with Criegee intermediates.6 Methyl oleate is a well-studied food lipid and a main component of various biodiesels13 suggesting an increasing abundance at ground level which is likely to lead to higher emissions into the atmosphere. Aerosol measurements in central London14 revealed that cooking aerosols represented 34% of primary organic aerosol, mostly originating from seed oils that are often rich in oleic acid derivatives produced in meat cooking processes. While the interaction of ozone with pure and organic-mixed methyl oleate particles has been investigated in the bulk,6,11 it has been recognized15 that experimental studies of organic molecules self-assembled at the surface of water rather than purely organic aerosols alone are key to understanding atmospheric ageing of aerosols covered in organic material. To our knowledge no previous study has been performed on the ozonolysis of a methyl ester monolayer at the air–water interface relevant to aqueous aerosol droplets.
The present work concerns the oxidation kinetics and fate of methyl oleate monolayers at the air–water interface that are exposed to ozone. Our aims are to determine the second-order rate coefficient for the loss of organic material from the interface, to rationalize the importance of surface vs. bulk oxidation of methyl esters, to examine whether any organic material remains at the air–water interface, and to assess the atmospheric impact of these processes.
2 Experimental
2.1 Materials
Chain-deuterated methyl oleate (d-methyl oleate) was synthesized for these experiments at the Oxford Isotope Facility. A variety of 1-D (1H, 2H and 13C) and 2-D (HSQC, HMBC and COSY) NMR techniques were carried out to show that the degree of chain deuteration was 95%. The analysis also showed the presence of 18% cyclohexane (not deuterated) which was a solvent used in the synthesis of the deuterated sample. As cyclohexane is volatile (its vapour pressure is 13.035 kPa at 298.15 K)16 it was assumed to have evaporated along with the carrier solvent before the start of the measurements of the reaction kinetics. Aside from the residual cyclohexane in the bulk sample, the chemical purity of d-methyl oleate in terms of surface-active deuterium-containing molecules is estimated to be not less than 95%. H2O was passed through a Millipore purification unit and D2O was used as supplied by Eur-isotop (France). Chloroform (>99%, Sigma Aldrich) was used as supplied.2.2 Experimental procedure
The surface excess of d-methyl oleate monolayers at the air–water interface was measured in real time during their oxidation by ozone using neutron reflectometry. The reactions were carried out at the surface of a Langmuir trough which was housed in an aluminum reaction chamber. The chamber was positioned on a 2-metre concrete stack with vibration in the Langmuir trough further damped by an active anti-vibration table. The sample was prepared by spreading several tens of microliters of a solution of d-methyl oleate dissolved in a carrier solvent of chloroform onto a clean air–water interface. The Langmuir trough of area 500 × 200 mm was equipped with a Wilhelmy plate balance (Mini PS4, Nima, UK). The sub-phase used was 8.1% D2O in H2O (v/v), known as air contrast matched water (ACMW), which gives zero specular reflection to neutrons, i.e. it has a scattering length density of zero which is matched to that of air. The reaction chamber had an active gas volume of ∼25 litres with heated quartz windows for the transmission of neutrons. After evaporation of the carrier solvent and the residual cyclohexane in the sample, the film was compressed to a surface pressure of 7 mN m−1 before the film was exposed to ozone.Ozone was generated at ppb levels from the photolysis of oxygen using a commercial pen-ray ozonizer (Ultra-Violet Products Ltd, Cambridge, UK), and the exposure to the UV lamp was tuned by changing the portion of uncovered lamp. The rate of loss of deuterated organic material at the interface was measured in real time: this rate was a convolution of the oxidation reaction rate and the rate of evaporation/dissolution of the reaction products. Mixing ratios of ozone were chosen to be representative of clean to heavily polluted environments (7–227 ppb). A high flow rate of 15 L min−1 was used to minimize effects of gas mixing on the kinetics of the target reaction. The gas flow did not cause a roughening of the air–water interface as determined by monitoring the specular reflection peak at grazing angles at the outset of each experiment.
The calibration of the ozonizer was performed off-line using an UV-Vis spectrometer. For this calibration, ozone was produced using the same set-up as for the kinetic experiments, but instead of flowing the gas into the reaction chamber it was collected in a glass chamber with CaF2 windows and a path length of 18.7 cm. We used the strong absorption band of ozone at 253.7 nm to calculate the concentration using the Beer–Lambert equation with an absorption cross-section of 1.131 × 10⁻¹⁷ cm2 molecule−1.17
The data sampling rate was varied for optimized signal-to-noise. Maximum time resolution for neutron data acquisition was used during the initial fast decay of the monolayer and a more limited time resolution was employed towards the end of the reaction when nearly all of the organic material had been removed from the air–water interface. (The neutron data had to be co-added at longer reaction times to achieve suitable signal-to-noise ratios.) This loss of time resolution was not a problem for the present study since the reaction was either completed or the rate of reaction was sufficiently slow, so that the decays could still be resolved. We also tested a range of co-adding intervals and ensured that the resulting decays are consistent and independent (within error limits) of the choice of co-adding intervals.
Ellipsometry experiments were performed to characterize the surface activity of possible reaction products. Measurements were carried out in a custom-built trough without barriers to control the surface pressure and without gas flow.
2.3 Neutron reflectometry
Neutron reflectometry measurements were performed on FIGARO, a horizontal time-of-flight neutron reflectometer at the Institut Laue-Langevin (Grenoble, France).18 By using a wide wavelength interval, ranging from 2 to 20 Å, and a fixed incidence angle of 0.62°, we probed simultaneously the momentum transfer,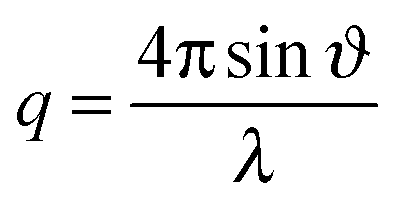 | (I) |
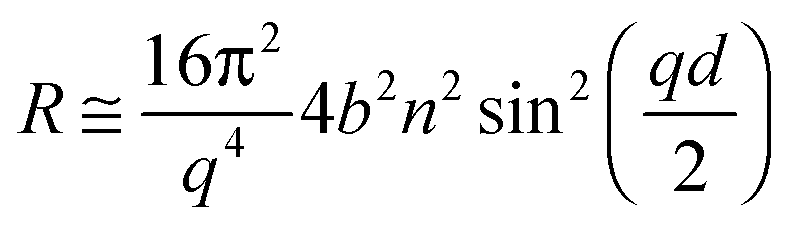
A high flux configuration involving a chopper pair of 7% dλ/λ, collimation slits of 7% dϑ/ϑ and a 20 Å frame overlap mirror allowed useful data acquisition times as short as 1 s. The reproducibility of the incident flux was estimated as <0.5%. For a deuterated monolayer at the air–ACMW interface the reflectivity, R, can be expressed by:
 | (II) |
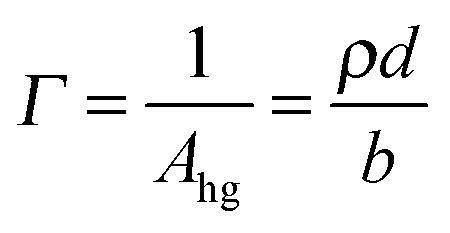
Since the values of momentum transfer were low enough to consider R proportional to (ρd)2, we obtained the values of ρd by fitting the R(q) curves for each acquisition to an air–monolayer–ACMW stratified layer model. Once ρd was determined the surface excess, Γ, was calculated by:
 | (III) |
The data acquisition rate was varied between 1–30 s according to the rate of the oxidation reaction. Data were co-added towards the end of the reaction at low monolayer coverage. The sample was kept aligned with the neutron beam position to a precision of 5 μm throughout the reaction using an optical height sensor (LKG-152, Keyence, Japan), where the laser reflected off the air–water interface through a heated quartz window.
Careful treatment of the background signal of the neutron reflectivity data was necessary in order to quantify precisely the surface excess at low coverage. Detailed information about the neutron data analysis can be found in part A of the ESI.†
2.4 Ellipsometry
To characterize the surface activity of possible reaction products, optical measurements were carried out using a Picometer Light phase modulated ellipsometer (Beaglehole, New Zealand). Ellipsometry is a technique where the change in polarization of light reflected at an interface can be related to the refractive index profile perpendicular to the interface. The ratio of the amplitudes of the reflectivities for p-polarized light, rp, and s-polarized light, rs, is measured with an attenuation, Ψ, and a phase shift, Δ.20 The value of Δ is proportional to the ellipsometric thickness, η, which is related to the optical permittivity of the layer. For an optically isotropic layer – as has been tested for methyl oleate at the surface pressures studied by Brewster angle microscopy measurements (see Fig. S19 (a) in the ESI†) – η can be expressed as the integral of the dielectric constant, ε, across the interface,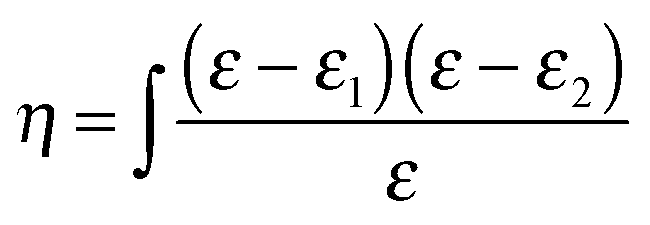 | (IV) |
2.5 Kinetic analysis
The surface excess values for the kinetic reactions that were calculated using eqn (III) were plotted as a function of time, and then each one was fitted to obtain a first order rate coefficient, k1. The fitting function used is based on the reaction of methyl oleate (MO) below.| MO + O3 → products | (1) |
 | (V) |
 | (VI) |
Eqn (VI) takes into account that the concentration of ozone needs a finite time to go from zero to the concentration of the input stream. Characteristic mixing times were ∼90 s. As a result of the substitution of eqn (VI) in eqn (V) and the integration of the differential eqn (V), we obtained the fitting function:
 | (VII) |
| [O3]s = kHδ[O3]in | (VIII) |
Eqn (VII) was used as fitting function for the surface excess decays through a weighted least-squares procedure. Once we had determined all the values of k1 corresponding to the O3 surface concentrations employed in the experiments, a second-order plot was generated (k1vs. [O3]s) and an orthogonal distance regression fit weighted by the uncertainties both in k1 and [O3]s was applied to determine k.
The kinetic analysis of all the oxidative decays recorded is presented in part B of the ESI.†
3 Results and discussion
3.1 Rate of loss of material
Fig. 1 shows surface excess decays of d-methyl oleate monolayers at the air–water interface as a function of time with respect to [O3]. Independent of [O3], the reactions are >98% efficient in removing the organic layer from the air–water interface. A summary of the conditions and the experimental results are presented in Table 1. We obtained first-order rate coefficients, k1, from an exponential fit to each decay. The apparent initially linear decay behaviour is consistent with a convolution of an exponential decay and the initial build up of the gas-phase oxidant ozone as illustrated in part D of the ESI.† The experimental data clearly deviate from exponential decay behaviour for long reaction times (see e.g. Fig. S13 in the ESI†). For the kinetic analysis we used the decay of the monolayer down to a surface excess of ∼7 × 10¹⁷ molecule m−2. The rationale for choosing this value as the cutoff for the analysis is based on the hypothesis that below a certain surface excess the surfactant molecules reorient at the interface. This process may alter the accessibility of the reaction site (the CC bond) and introduce errors into the fits. The cut-off value of the surface excess 7 × 10¹⁷ molecule m−2 for the organic film was calculated considering the measured area per molecule, its molecular volume,25 and the assumption that when lying down the shape of the molecules can be approximated to a cylinder.
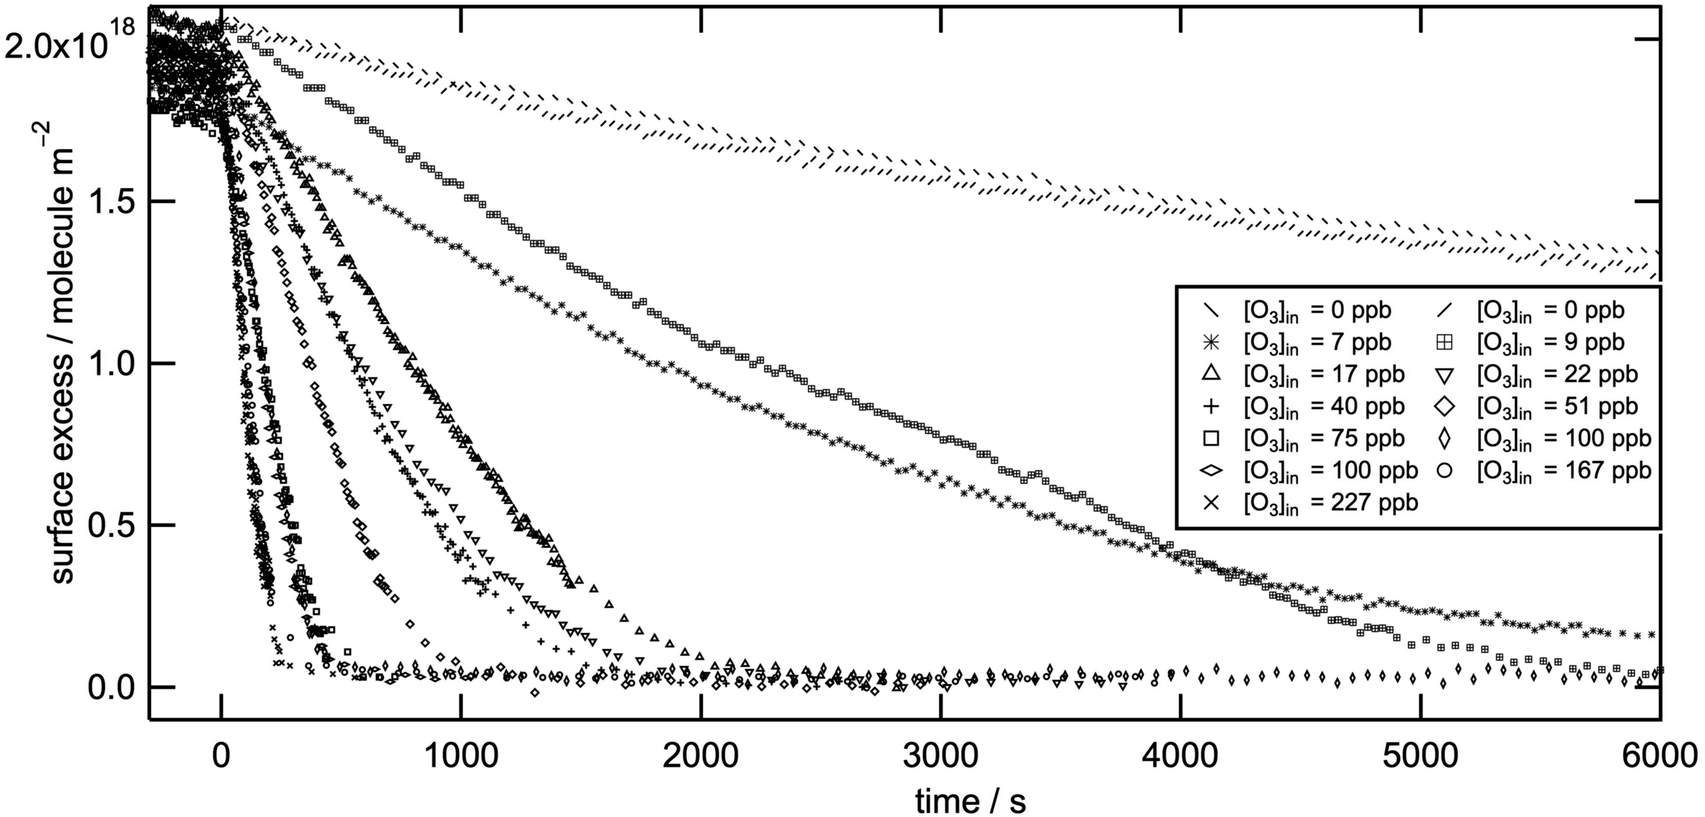 | ||
| Fig. 1 Surface excess of monolayers of d-methyl oleate on an aqueous sub-phase during oxidation by ozone with respect to the reaction time and ozone concentration. In situ O3-generation was initiated at t = 0. For the kinetic analysis we reduced the surface excess by 5% because after the neutron reflectometry experiments we determined an insoluble, involatile, unreactive, deuterated impurity at the 5% level to be present in the starting material. Complementary tests showed that >98% of a freshly made, highly pure d-methyl oleate sample exposed to ozone is rapidly removed from the air–water interface as demonstrated in part A of the ESI.† | ||
| Run (figure) | [O3]ina/ppb | [O3]sa,b/105 molecule cm−2 | k 1/10−3 s−1c |
|---|---|---|---|
| a Uncertainty from spectroscopic measurements of O3 absorption at 253.7 nm. b Surface concentrations were calculated from [O3]in following Smith et al.21 c Uncertainty corresponds to one standard deviation from the exponential fits (presented in part B of the ESI) plus the upper limit for non-reactive loss determined in runs 12 and 13. | |||
| 1 (S7) | 7 ± 2 | 7 ± 2 | 0.3 ± 0.1 |
| 2 (S13) | 9 ± 2 | 9 ± 2 | 0.3 ± 0.1 |
| 3 (S11) | 17 ± 5 | 18 ± 5 | 1.0 ± 0.1 |
| 4 (S9) | 22 ± 7 | 24 ± 7 | 1.3 ± 0.1 |
| 5 (S12) | 40 ± 7 | 42 ± 7 | 1.6 ± 0.1 |
| 6 (S10) | 51 ± 7 | 54 ± 7 | 2.6 ± 0.2 |
| 7 (S16) | 75 ± 14 | 79 ± 15 | 4.8 ± 0.3 |
| 8 (S8) | 100 ± 17 | 105 ± 18 | 6.1 ± 0.3 |
| 9 (S14) | 100 ± 17 | 105 ± 18 | 6.5 ± 0.4 |
| 10 (S17) | 167 ± 25 | 176 ± 26 | 11 ± 1 |
| 11 (S15) | 227 ± 25 | 239 ± 26 | 15 ± 2 |
| 12 (S5) | 0 | 0 | <0.08 |
| 13 (S6) | 0 | 0 | <0.1 |
Fig. 2 shows the values of k1 obtained experimentally as a function of [O3] demonstrating a clear linear relation. An orthogonal distance regression fitting procedure weighted by the uncertainties both of k1 and of the spectroscopic measurements of [O3] gives a bimolecular rate coefficient of (5.7 ± 0.9) × 10−10 cm2 molecule−1 s−1 (quoted uncertainties correspond to the 95% confidence limits). The small negative intercept of the best-fit line lies well within the uncertainty of the measurements. The rate coefficient for the reaction of ozone with the parent fatty acid, oleic acid, has been determined by neutron reflectometry to be (7.3 ± 0.9) × 10−11 cm2 molecule−1 s−1.24 Also, Gonzalez-Labrada et al. studied a monolayer on a pendant drop and obtained a surface rate coefficient for the oleic acid–ozone system of 4.9 × 10⁻¹¹ cm2 molecule−1 s−1.26 The rate coefficient determined here for the methyl ester is thus approximately nine times larger than that determined for the parent fatty acid. Hearn et al. (2005)6 compared the reactivity of pure oleic acid and methyl oleate particles and reported different reaction mechanisms that were attributed to a larger degree of order in the oleic acid particles.6 The reactive site for ozonolysis is the double bond (see Scheme 1) which is in a similar chemical environment for the fatty acid and its methyl ester in a monolayer on an aqueous sub-phase. However, the reactive site may be more accessible to attack by ozone on geometric considerations given that at equivalent surface pressures the methyl ester head group occupies a considerably larger area than the corresponding carboxylic acid. Differences in the monolayer behaviour of oleic acid and its methyl ester at the air–water interface were confirmed in repeated compression–expansion cycles (the resulting isotherms are depicted in Fig. S18 in part C of the ESI†). Methyl oleate exerts a higher surface pressure for a given area per molecule compared to oleic acid and collapses at lower surface pressures. There is also a considerably higher loss of material for repeated compression–expansion cycles. Above a surface pressure of only 16 mN m−1 methyl oleate starts to form islands of condensed phase (oleic acid shows isotropic behaviour up to 30 mN m−1) as illustrated in the Brewster angle microscopy image shown in Fig. S19 (b) in the ESI.† This clear evidence of a different interaction of the head groups with the aqueous sub-phase is consistent with a different structure at the air–water interface that can explain the difference in the rate coefficients found.
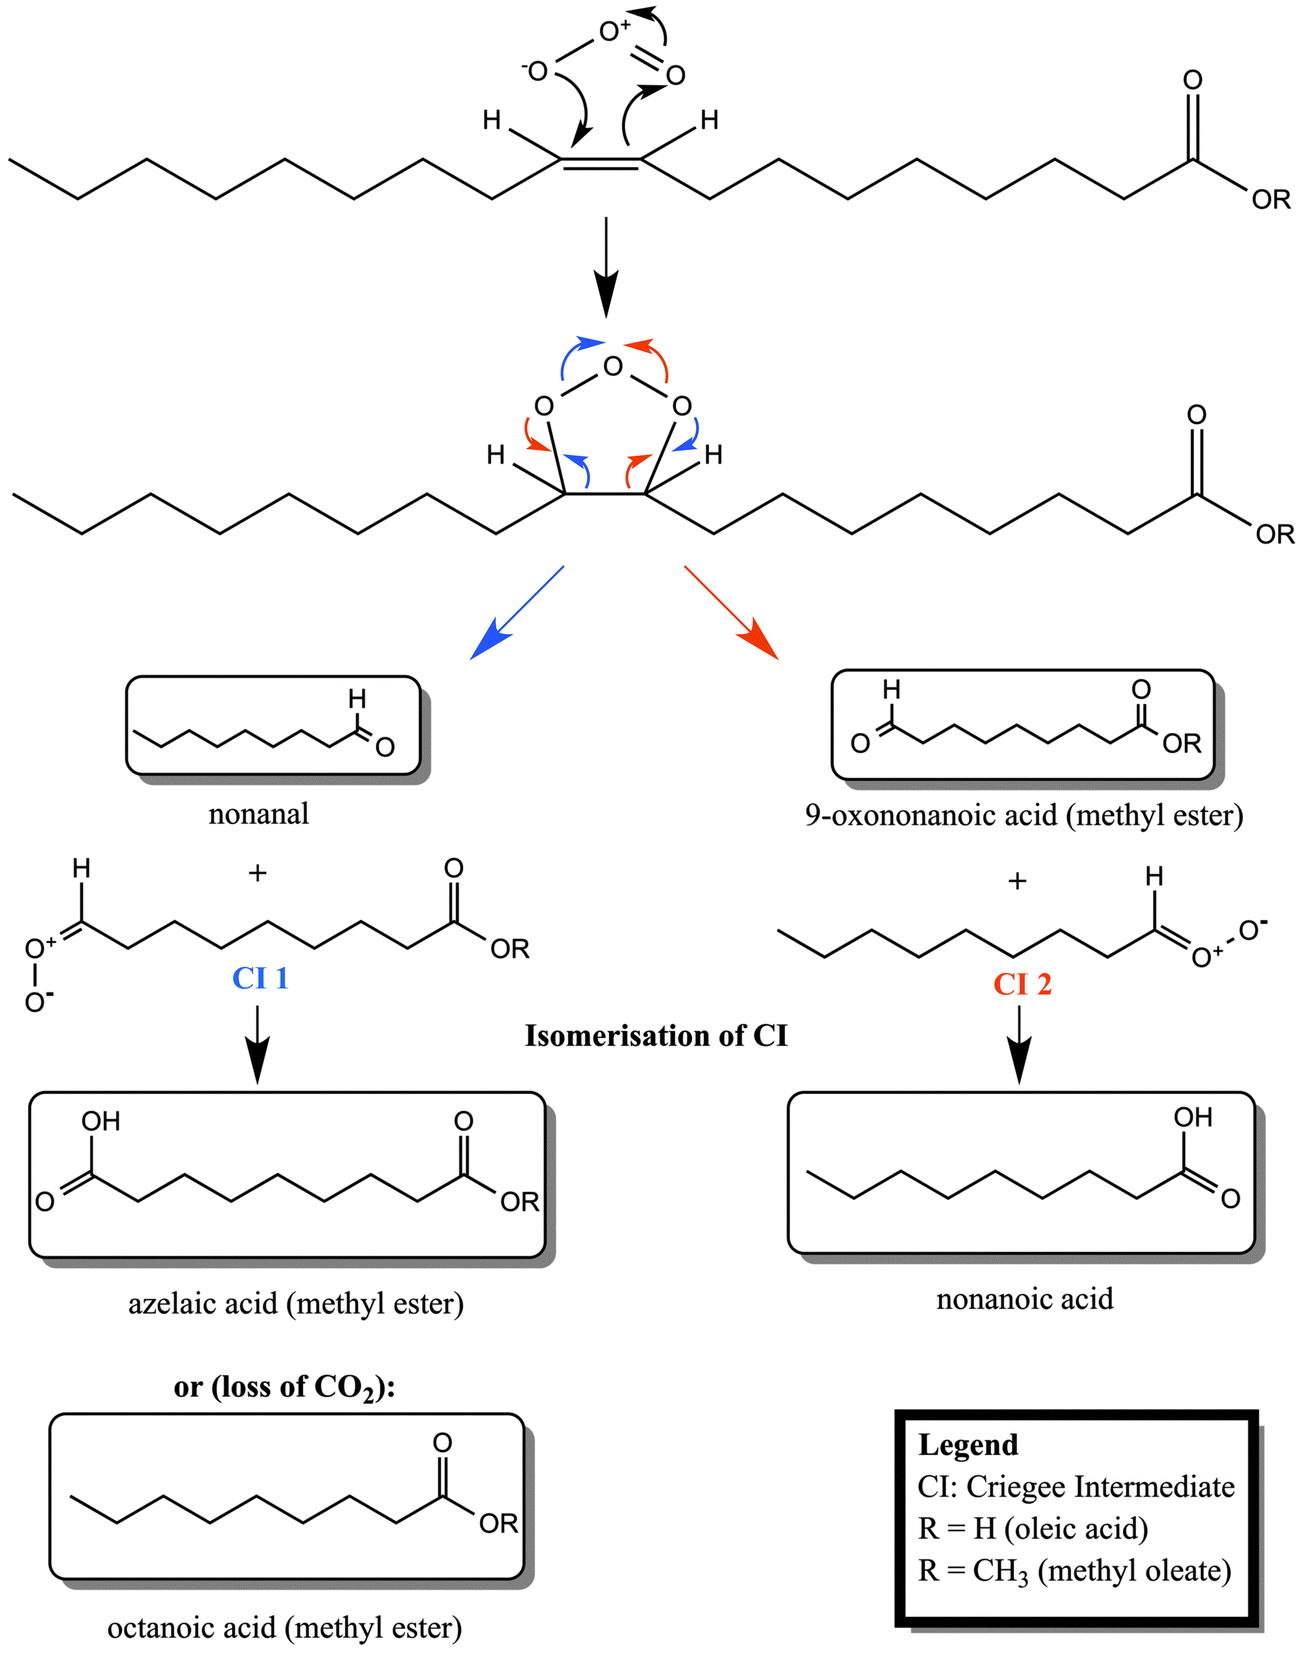 | ||
| Scheme 1 Reaction scheme for the ozonolysis of oleic acid and its methyl ester, methyl oleate. Pathways for the two different Criegee intermediates (CI 1 and CI 2) are illustrated in different colours (CI 1: blue font; CI 2: red font). Structures in boxes are experimentally detected products (see e.g. Hung et al., 2005 and Mochida et al., 2006).11,36 | ||
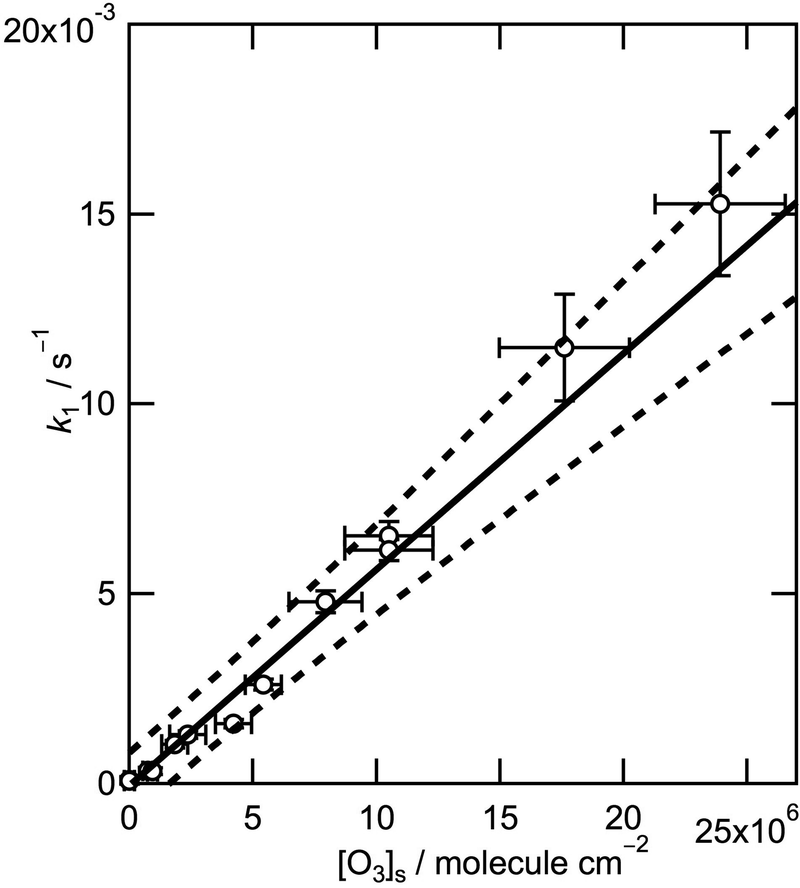 | ||
| Fig. 2 Pseudo first order decay rate coefficients for methyl oleate at the air–water interface, k1, as a function of the ozone surface concentration, [O3]s. The data points and error bars represent experimental data and associated uncertainties at one standard deviation. The solid line corresponds to an orthogonal distance regression fit weighted by the uncertainties both in k1 and [O3]s. The dashed lines represent the 95% prediction bands. | ||
Following the approach of Hearn et al.6 we estimated the uptake coefficient, γ, for ozone on a droplet covered in a monolayer of methyl oleate to be ∼3 × 10⁻⁵. This is approximately one order of magnitude larger than the values estimated for ozone uptake on a droplet covered in an oleic acid monolayer (∼3 × 10⁻⁶)24,26 in line with the faster rate coefficient discussed in the previous paragraph. Zahardis and Petrucci27 reviewed the oleic acid–ozone system and reported uptake coefficients to be generally in the range ∼0.7–1.0 × 10⁻³ with substantially reduced uptake for the relatively small number of studies of oleic acid coatings and films. Uptake coefficients for ozone on monodisperse pure methyl oleate particles (γ = (1.23 ± 0.10) × 10−3)6 have been found to be similar to those for oleic acid particles (γ = (1.38 ± 0.06) × 10−3).6 Our results of a slower ozone uptake for the methyl oleate film compared to its bulk uptake is consistent with Zahardis and Petrucci's conclusion for oleic acid: there is clear evidence for a reduced ozone uptake in surface films compared to bulk samples. The reduction in ozone uptake from bulk to surface layer appears to be ca. one order of magnitude less pronounced for methyl oleate compared to oleic acid. The surface reactions in aqueous droplets encountered in the atmosphere should thus be considerably more important for methyl oleate compared to oleic acid in particular if transport of gas-phase oxidants into the aerosol particle is hindered. This finding illustrates that a small modification in the molecular structure (methyl ester vs. parent acid) strongly impacts on the reactivity of the organic film. The consistently contrasting observations from surface and bulk studies also underline the key importance of the – to date scarce – studies of surface layer reactivity to provide crucial data for de-convolution of surface and bulk processes (cf.ref. 7, 8, 28 and 29).
3.2 Reaction products
Having demonstrated the efficient loss of material at the air–water interface by ozonolysis of a methyl ester monolayer, we now turn our attention to the identity of the possible reaction products. The branching ratios for the reaction products may be different in the bulk and at surfaces and it is not straightforward to accurately identify a single monolayer of products that do not remain at the interface. Nevertheless, the ruling out or in of some possible products in this work may allow comparison of the findings to the oxidation of other relevant organic molecules where the products may remain at the interface and affect greatly the atmospheric behaviour of aerosol droplets.The main products of the methyl oleate ozonolysis, cf.ref. 11, are expected to be – in analogy to oleic acid ozonolysis – nonanal, nonanoic acid, 9-oxo-nonanoic acid methyl ester, azelaic acid methyl ester and octanoic acid methyl ester (see Scheme 1). The water solubility (following the approach of Kühne et al., 1995)30 and volatility (following the approach of Compernolle et al., 2011)31 of all of these products together with the main ozonolysis products of oleic acid are presented in Table 2 together with experimental values (where available). There is a considerable discrepancy between estimated and experimental solubility values, so interpretation of the data is a challenge which is further exacerbated for those compounds where experimental values are missing. Candidates most likely to be lost to the aqueous sub-phase are azelaic and 9-oxononanoic acids as well as the corresponding methyl esters. Because of its volatility nonanal is expected to transfer rapidly into the gas-phase, as demonstrated by experimental studies of oleic acid ozonolysis where nonanal was detected only in the gas and not in the particle phase (e.g.ref. 32). Based on the estimated volatility of octanoic acid methyl ester, we would also expect this candidate to be lost into the gas-phase. The somewhat lower volatility of nonanoic acid and azelaic acid methyl ester indicate that these compounds could remain on the surface of an aqueous droplet.
| Ozonolysis product | Water solubility/10−2 g dm−3 | Vapour pressure p0/10−4 atm | Phase |
|---|---|---|---|
| a Experimental values.32 b Loss of nonanal to the gas-phase was reported (e.g.ref. 37). c Value reported by Sigma Aldrich. d Nonanoic acid was reported to be surface active ref. 24 and references therein. e Nonanoic acid was suggested to be lost to the gas-phase.38 f Azelaic acid was reported to be surface active.39 g Reported by Tuckermann et al., 2007.39 | |||
| Nonanal (OA,MO) | 0.69 | 4.79 | Gb |
| 9.6a | 4.15c | ||
| Nonanoic acid (OA,MO) | 0.99 | 1.83 × 10⁻² | (I)d,Ge |
| 28a | |||
| 9-Oxononanoic acid (OA) | 32 | 1.17 × 10⁻³ | AQ |
| 1900a | |||
| 9-Oxononanoic acid methyl ester (MO) | 2.7 | 7.38 × 10⁻² | (G),I,AQ |
| Azelaic acid (OA) | 44 | 1.18 × 10⁻⁶ | (I)f,AQ |
| 240a (at 293 K)g | |||
| Azelaic acid methyl ester (MO) | 3.7 | 3.74 × 10⁻³ | AQ |
| Octanoic acid (OA) | 4.0 | 5.58 × 10⁻² | (G),AQ |
| Octanoic acid methyl ester (MO) | 0.35 | 5.01 | G |
To determine which products may be produced during the investigated surface reaction, we tested the surface activity of some promising candidates in situ by ellipsometry. Fig. 3 shows ellipsometry data of spread monolayers of nonanoic acid and the methyl esters of azelaic acid and octanoic acid. All three products are shown not to be stable at the air–water interface, i.e. they must be solvated into the aqueous sub-phase or lost to the gas phase. 9-Oxononanoic acid methyl ester is unfortunately not commercially available and is the only previously reported product that could not be tested (compare Scheme 1 and Table 2). Therefore any of the tested molecules could be reaction products, but none of them are stable at the air–water interface as demonstrated both by neutron reflectometry and ellipsometry. The importance of the result that the surface activity of the organic material is lost rapidly during oxidative ageing is outlined in the next section.
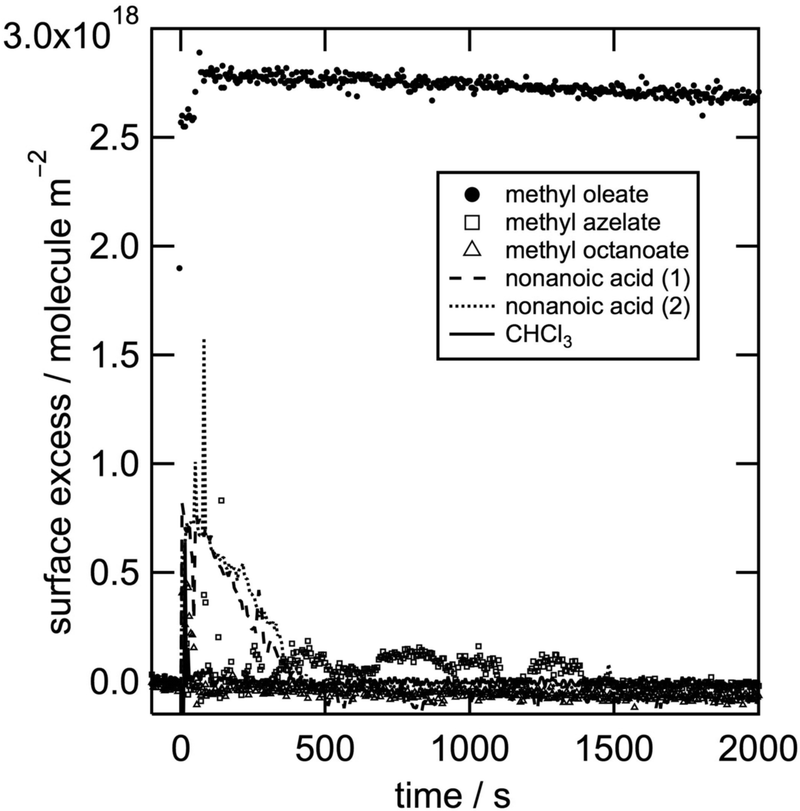 | ||
| Fig. 3 Surface excess as a function of time obtained from an ellipsometry study for the reactant d-methyl oleate and the key ozonolysis products nonanoic acid (two runs labelled ‘nonanoic acid (1)’ and ‘nonanoic acid (2)’ are displayed to show consistency of the results when repeated) as well as the methyl esters of azelaic and octanoic acid. The disappearance from the interface of the volatile solvent CHCl3 is also shown for comparison. The slower decay of methyl oleate without exposure to an oxidant in this case may be related to the absence of the gas flow used in the kinetic studies. Initial spikes in the surface excess are likely to be caused by the evaporation of the volatile solvent chloroform. It should also be noted that ellipsometry has a substantially smaller footprint compared to neutron reflectometry (mm2vs. several cm2), so that local events which are resolved in ellipsometry may be averaged out in neutron reflectometry. | ||
3.3 Atmospheric implications
Our experimental data on the oxidation of d-methyl oleate are consistent with the findings of Voss et al. (2007)32 who suggested that ozonolysis of the parent fatty acid oleic acid leaves no organic layer at the interface. However, it has been suggested more recently that a substantial stable product film of nonanoic acid is formed during oleic acid ozonolysis facilitating cloud formation.24 Some differences in both the surface excess and the stability of the product films can be expected for ozonolysis of the two closely related organic surfactants – such as oleic acid and its methyl ester (compare Scheme 1 and Table 2), which implies that their products will have different atmospheric fates. Different ozonolysis mechanisms for oleic acid and its methyl ester have been reported and rationalised in terms of a larger degree of order in oleic acid particles as a result of the formation of hydrogen-bonded dimers.6 Hence subtle changes in the nature of the organic surfactant emitted into the atmosphere could alter the surface properties of droplets on atmospheric timescales after oxidation by pollutants.From our newly determined rate coefficient for the oxidation of d-methyl oleate at the air–water interface, we estimated that the methyl ester has a lifetime of ∼10 min for a typical atmospheric concentration of ozone of 50 ppb. In contrast to this finding, the lifetimes of unsaturated fatty acids in the atmosphere have been shown to be several orders of magnitude longer.33
Furthermore, we presented direct experimental evidence that as a result of the oxidation process the removal of organic material from the free surface is extremely efficient (>98%). Our finding that there is an absence of surface-active products from the rapid oxidation of the methyl oleate film is of atmospheric importance since it is well known that organic films can substantially alter the surface tension and thus the optical and cloud nucleation properties of aqueous droplets in the atmosphere.34 Crucial changes to the thermodynamic stability of these droplets are possible at very low organic mixing ratios, i.e. even if only very small amounts of surface-active material are released into the atmosphere. However, if these organic films are efficiently removed from the air–water interface, as reported here for a methyl oleate monolayer, they will not be able to reduce the surface tension of water droplets for any considerable time which could thus have important consequences when considering emission control strategies. It has also been demonstrated recently that key formation of secondary organic aerosol occurs mainly at the particle surface (e.g.ref. 29), so that a better understanding of the fate of surface-active species is urgently required. In particular, there is a need for future surface studies on more complex systems in order for us to gain a better understanding of crucial atmospheric processes. The findings presented here, for example, may have important consequences for the fate of reactive organic components of atmospheric aerosols, such as fatty acids and their derivatives.
4 Conclusions
In this study we have obtained direct experimental evidence for a surprisingly rapid removal of a monolayer of methyl oleate from the air–water interface during ozonolysis. We have determined a rate coefficient of (5.7 ± 0.9) × 10−10 cm2 molecule−1 s−1 and an uptake coefficient of ∼3 × 10⁻⁵ for the loss process. We have also demonstrated that reaction products are not stable at the air–water interface with an atmospheric lifetime of an organic layer on aqueous droplets of ∼10 min. We found a significantly larger rate coefficient for methyl oleate films compared to that reported for films of oleic acid. This suggests that the surface reaction of methyl oleate in aqueous droplets is considerably more important relative to bulk reactivity than is the case for oleic acid. This finding illustrates that a small modification in the molecular structure (methyl ester vs. parent acid) strongly impacts on the reactivity of the organic film. Indeed, our results provide evidence that unsaturated fatty acids and their derivatives cannot remain at the air–water interface throughout their ageing cycles and must be protected from oxidative attack e.g. by incorporation into highly viscous aerosol matrices (e.g.ref. 35) where transport of gas-phase oxidants is slowed down. It remains a key challenge to understand both the oxidation rate and the phase behaviour of more realistic organic monolayers on aerosol droplets in the atmosphere. The increasing complexity of laboratory studies, e.g. multi-component systems as well as variations in temperature and dynamic surface conditions, in conjunction with the development of realistic models, will be essential steps towards an improved understanding of oxidation effects in real atmospheric aerosols.Acknowledgements
This work was supported by the Royal Society (grant no. 2008/R3) and NERC (grant numbers NE/G000883/1 and NE/F007116/1). We thank the Oxford Isotope Facility for synthesising d-methyl oleate, Dr Geoff D. Brown, University of Reading, for carrying out a detailed NMR analysis of the d-methyl oleate sample, the Institut Laue-Langevin (Grenoble, France) for allocations of neutron reflectometry beam time on FIGARO and the NEATNOx studentship funding for FS for this work, the Partnership for Soft Condensed matter for access to the ellipsometer and Brewster angle microscope, and Simon Wood for expert technical assistance.Notes and references
- U. Pöschl, Atmospheric Aerosols: Composition, Transformation, Climate and Health Effects, Angew. Chem., Int. Ed., 2005, 44, 7520–7540 CrossRef PubMed.
- B. Stevens and G. Feingold, Untangling aerosol effects on clouds and precipitation in a buffered system, Nature, 2009, 461, 607–613 CrossRef CAS PubMed.
- U. Lohmann and J. Feichter, Global indirect aerosol effects: a review, Atmos. Chem. Phys., 2005, 5, 715–737 CrossRef CAS.
- P. S. Monks, Gas-phase radical chemistry in the troposphere, Chem. Soc. Rev., 2005, 34, 376–395 RSC.
- M. R. McGillen, A. T. Archibald, T. Carey, K. E. Leather, D. E. Shallcross, J. C. Wenger and C. J. Percival, Structure-activity relationship (SAR) for the prediction of gas-phase ozonolysis rate coefficients: an extension towards heteroatomic unsaturated species, Phys. Chem. Chem. Phys., 2011, 13, 2842–2849 RSC.
- J. D. Hearn, A. J. Lovett and G. D. Smith, Ozonolysis of oleic acid particles: evidence for a surface reaction and secondary reactions involving Criegee intermediates, Phys. Chem. Chem. Phys., 2005, 7, 501–511 RSC.
- C. Pfrang, M. Shiraiwa and U. Pöschl, Coupling aerosol surface and bulk chemistry with a kinetic double layer model (K2–SUB): oxidation of oleic acid by ozone, Atmos. Chem. Phys., 2010, 10, 4537–4557 CrossRef CAS.
- M. Shiraiwa, C. Pfrang and U. Pöschl, Kinetic multi-layer model of aerosol surface and bulk chemistry (KM–SUB): the influence of interfacial transport and bulk diffusion on the oxidation of oleic acid by ozone, Atmos. Chem. Phys., 2010, 10, 3673–3691 CrossRef CAS.
- C. Pfrang, M. Shiraiwa and U. Pöschl, Chemical ageing and transformation of diffusivity in semi-solid multi-component organic aerosol particles, Atmos. Chem. Phys., 2011, 11, 7343–7354 CrossRef CAS.
- S. Xiao and A. K. Bertram, Reactive uptake kinetics of NO3 on multicomponent and multiphase organic mixtures containing unsaturated and saturated organics, Phys. Chem. Chem. Phys., 2011, 13, 6628–6636 RSC.
- M. Mochida, Y. Katrib, J. T. Jayne, D. R. Worsnop and S. T. Martin, The relative importance of competing pathways for the formation of high-molecular-weight peroxides in the ozonolysis of organic aerosol particles, Atmos. Chem. Phys., 2006, 6, 4851–4866 CrossRef CAS.
- J. Zahardis, B. W. LaFranchi and G. A. Petrucci, The heterogeneous reaction of particle-phase methyl esters and ozone elucidated by photoelectron resonance capture ionization: Direct products of ozonolysis and secondary reactions leading to the formation of ketones, Int. J. Mass Spectrom., 2006, 253, 38–47 CrossRef CAS PubMed.
- Y. J. Wang, F. S. Cannon, M. Salama, D. A. Fonseca and S. Giese, Characterization of Pyrolysis Products from a Biodiesel Phenolic Urethane Binder, Environ. Sci. Technol., 2009, 43, 1559–1564 CrossRef CAS.
- J. D. Allan, P. I. Williams, W. T. Morgan, C. L. Martin, M. J. Flynn, J. Lee, E. Nemitz, G. J. Phillips, M. W. Gallagher and H. Coe, Contributions from transport, solid fuel burning and cooking to primary organic aerosols in two UK cities, Atmos. Chem. Phys., 2010, 10, 647–668 CrossRef CAS.
- O. Vesna, S. Sjogren, E. Weingartner, V. Samburova, M. Kalberer, H. W. Gäggeler and M. Ammann, Changes of fatty acid aerosol hygroscopicity induced by ozonolysis under humid conditions, Atmos. Chem. Phys., 2008, 8, 4683–4690 CrossRef CAS.
- M. I. Shakhparonov, Untersuchung des Dampfdrucks von binären Nichtelektrolytlösungen, Teplofiz. Svoistva Veshchestv Mater., 1973, 7, 167–171 Search PubMed.
- K. Mauersberger, D. Hanson, J. Barnes and J. Morton, Ozone Vapor Pressure and Absorption Cross-Section Measurements: Introduction of an Ozone Standard, J. Geophys. Res., 1987, 92(D7), 8480–8482 CrossRef CAS.
- R. A. Campbell, H. P. Wacklin, I. Sutton, R. Cubitt and G. Fragneto, FIGARO: The New Horizontal Reflectometer At The ILL, Eur. Phys. J. Plus, 2011, 126, 107 CrossRef.
- J. R. Lu, R. K. Thomas and J. Penfold, Surfactant layers at the air/water interface: structure and composition, Adv. Colloid Interface Sci., 2000, 84, 143–304 CrossRef CAS.
- D. Beaglehole, Ellipsometric studies of the surface of simple liquids, Physica B+C, 1980, 100, 163–174 CrossRef CAS.
- G. D. Smith, E. Woods, C. L. DeForest, T. Baer and R. E. Miller, Reactive Uptake of Ozone by Oleic Acid Aerosol Particles: Application of Single-Particle Mass Spectrometry to Heterogeneous Reaction Kinetics, J. Phys. Chem. A, 2002, 106, 8085–8095 CrossRef CAS.
- S. D. Razumovskii and G. E. Zaikov, Bull. Acad. Sci. USSR, Div. Geologic, 1971, 616–620 CrossRef.
- B. I. Tarunin, M. L. Perepletchikov and Y. A. Aleksandrov, Z. Obsch. Khim. (English), 1982, 52, 419–422 Search PubMed.
- M. D. King, A. R. Rennie, K. C. Thompson, F. N. Fisher, C. C. Dong, R. K. Thomas, C. Pfrang and A. V. Hughes, Oxidation of oleic acid at the air–water interface and its potential effects on cloud critical supersaturations, Phys. Chem. Chem. Phys., 2009, 11, 7699–7707 RSC.
- R. S. Armen, O. D. Uitto and S. E. Feller, Phospholipid component volumes: determination and application to bilayer structure calculations, Biophys. J., 1998, 75(2), 734–744 CrossRef CAS.
- E. Gonzalez-Labrada, R. Schmidt and C. E. Dewolf, Kinetic analysis of the ozone processing of an unsaturated organic monolayer as a model of an aerosol surface, Phys. Chem. Chem. Phys., 2007, 9, 5814–5821 RSC.
- J. Zahardis and G. A. Petrucci, The oleic acid-ozone heterogeneous reaction system: products, kinetics, secondary chemistry, and atmospheric implications of a model system – a review, Atmos. Chem. Phys., 2007, 7, 1237–1274 CrossRef CAS.
- M. Shiraiwa, C. Pfrang, T. Koop and U. Pöschl, Kinetic multi-layer model of gas-particle interactions in aerosols and clouds (KM-GAP): linking condensation, evaporation and chemical reactions of organics, oxidants and water, Atmos. Chem. Phys., 2012, 12, 2777–2794 CrossRef CAS.
- M. Shiraiwa, L. D. Yee, K. A. Schilling, C. L. Loza, J. S. Craven, A. Zuend, P. J. Ziemann and J. H. Seinfeld, Size distribution dynamics reveal particle-phase chemistry in organic aerosol formation, Proc. Natl. Acad. Sci. U. S. A., 2013, 110(29), 11746–11750 CrossRef CAS PubMed.
- R. Kühne, R.-U. Ebert, F. Kleint, G. Schmidt and G. Schüürmann, Group Contribution Methods to Estmiate Water solubility of Organic Chemicals, Chemosphere, 1995, 30, 2061–2077 CrossRef.
- S. Compernolle, K. Ceulemans and J.-F. Müller, Estimating fusion properties for functionalised acids, Atmos. Chem. Phys., 2011, 11, 8385–8394 CrossRef CAS.
- L. F. Voss, M. F. Bazerbashi, C. P. Beekman, C. M. Hadad and H. C. Allen, Oxidation of oleic acid at air/liquid interfaces, J. Geophys. Res., 2007, 112, D06209, DOI:10.1029/2006JD007677.
- J. W. Morris, P. Davidovits, J. T. Jayne, K. L. Jimenez, Q. Shi, C. E. Kolb, D. R. Worsnop, W. S. Barney and G. Cass, Geophys. Res. Lett., 2002, 29, 1357 CrossRef.
- B. Ervens, G. Feingold and S. M. Kreidenweis, J. Geophys. Res.: Atmos., 2005, 110, D18211 CrossRef.
- L. Renbaum-Wolff, J. W. Grayson, A. P. Bateman, M. Kuwata, M. Sellier, B. J. Murray, J. E. Shilling, S. T. Martin and A. K. Bertram, Proc. Natl. Acad. Sci. U. S. A., 2013, 110, 8014–8019 CrossRef CAS PubMed.
- H. M. Hung, Y. Katrib and S. T. Martin, J. Phys. Chem. A, 2005, 109, 4517 CrossRef CAS PubMed.
- O. Vesna, M. Sax, M. Kalberer, A. Gaschen and M. Ammann, Product study of oleic acid ozonolysis as function of humidity, Atmos. Environ., 2009, 43, 3662–3669 CrossRef CAS PubMed.
- F. V. McNeill, G. M. Wolfe and J. A. Thornton, The Oxidation of Oleate in Submicron Aqueous Salt Aerosols: Evidence of a Surface Process, J. Phys. Chem. A, 2007, 111, 1073–1083 CrossRef PubMed.
- R. Tuckermann, Surface tension of aqueous solutions of water-soluble organic and inorganic compounds, Atmos. Environ., 2007, 41, 6265–6275 CrossRef CAS PubMed.
Footnote |
| † Electronic supplementary information (ESI) available: Detailed information about the neutron data analysis can be found in part A of the ESI; the kinetic analysis of all the oxidative decays recorded is presented in part B; part C presents a comparison of the behaviour of oleic acid and its methyl ester at the air–water interface and part D discusses linear vs. exponential fitting of the surface excess decays. See DOI: 10.1039/c4cp00775a |
| This journal is © the Owner Societies 2014 |