13C NMR relaxation and reorientation dynamics in imidazolium-based ionic liquids: revising interpretation
Received
12th February 2014
, Accepted 7th April 2014
First published on 9th April 2014
Abstract
The temperature dependencies of 13C NMR relaxation rates in [bmim]PF6 ionic liquid have been measured and the characteristic times (τc) for the cation reorientation have been recalculated. We found the origin of the incorrect τc temperature dependencies that were earlier reported for ring carbons in a number of imidazolium-based ILs. After a correction of the approach 13C T1, the relaxation data allowed us to obtain the characteristic times for an orientation mobility of each carbon, and a complicated experiment, such as NOE, was not required. Thus the applicability of 13C NMR relaxation rate measurements to the calculation of the characteristic times for reorientation of all the carbons of the [bmim]+ cation was confirmed and our findings have shown that a 13C NMR relaxation technique allowed its application to ionic liquids to be equally successful as for other liquid systems.
Introduction
Ionic liquids, as a new class of liquid systems, have been investigated actively during the last few decades. NMR relaxation is one of the well known techniques for studying the rotational reorientation of ions and molecules in various liquid systems, including imidazolium-based ionic liquids, see e.g.ref. 1–14 and references therein. In particular, 13C NMR relaxation has been successfully used for the investigation of the reorientation mobility in a large number of liquid systems. However, its applicability to ionic liquids was recently called into question. In a set of papers W. R. Carper with co-workers8–13 reported on the non-monotonic temperature dependence of the characteristic time (henceforth referred to as correlation time, τc) for imidazolium-ring carbon reorientation, see e.g. Fig. 2 in ref. 10. The authors attributed the results of the presence of a large contribution of the chemical shift anisotropy (CSA) to ring carbon relaxation, and suggested using Nuclear Overhauser Effect (NOE) experiments in order to correct the relaxation data. However, direct measurements of spin–lattice relaxation time (T1) at two magnetic fields proved undoubtedly that the CSA contribution is negligible for all imidazolium carbons including the ring carbons.14 As a result, this led to a situation where this well-known and successfully used approach cannot be applied to ionic liquids due to unknown reasons. The aim of our work, therefore, is to analyze the problem and verify the difficulties (if any) in the applicability of NMR T1 measurements for the investigation of molecular mobility in ionic liquids. With regard to maintaining the relevance and importance of the problem to date, this is evidenced by the following facts. (1) In a recent review15 in 2011, the conclusion of the studies reported in ref. 8–13 was repeated without any comments and without any mention of the results of the work.14 (2) The authors of ref. 4 (and maybe of other papers) did not use the measured 13C relaxation data for [bmim]+ cations in order to calculate quantitatively τc magnitudes.
Results and discussion
As a first step we have repeated the measurements of 13C T1 in the same ionic liquid as in ref. 8–10 namely, [bmim]PF6. This appeared to be necessary, as we could not find in ref. 8–10 the primary information, i.e. tables of relaxation times at various temperatures. A chemical structure of the [bmim]+ cation is shown in Scheme 1 together with an attribution of the lines.
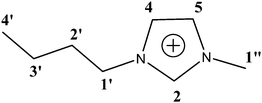 |
| | Scheme 1 Chemical structure of the cation of [bmim]PF6 ionic liquid. The line numbering is equal to numbering in ref. 8–10 and is used below. | |
All measurements were carried out using a NMR AVANCE-400 spectrometer at resonance frequencies (f0) of 100 MHz for 13C nuclei. The obtained dependencies shown in Fig. 1 look completely similar to the dependencies in ref. 8–10 and this shows that in our work we have interpreted further the same set of experimental data as in ref. 8–10, despite a distinction in the origin of the ionic liquid and possible distinctions in the experimental details.
 |
| | Fig. 1
13C spin–lattice relaxation rates (1/T1) vs. reciprocal temperature for all carbons of [bmim]PF6; (a) ring carbons, (b) CH2-groups of the butyl chain; (c) CH3-groups in different parts of the cation. | |
Next, we calculated τc values to verify the ref. 8–10 results by following the same procedure as in the studies reported in ref. 8–13, i.e. by using the well-known BPP (Bloembergen–Purcell–Pound) theory. The theory was first suggested for proton relaxation by Bloembergen–Purcell–Pound.16 Later it was applied to other nuclei including 13C nuclei.17 Namely, a protonated carbon 13C relaxation rate may be expressed as:17,18
| | 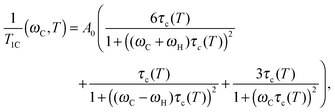 | (1) |
Here
ωH and
ωC are cyclic resonant frequencies (2π
f0) of
1H and
13C, respectively, and
A0 is a constant, which does not depend on temperature and frequency. For the carbon nucleus this constant is given by the expression:
| |  | (2) |
were ℏ is the reduced Plank constant (
h/2π),
rCH is the length of the C–H chemical bond,
γH and
γC are the magnetogyric ratios of
1H and
13C nuclei;
n = 1, 2, and 3 for CH-, CH
2- and CH
3-groups, respectively;
S2 ≤ 1 is a constant, the so called order-parameter, see for more details
ref. 19. It is useful to note that
eqn (1) reveals a BPP-type curve with a maximum only at
and this can be verified by simple analytical or digital calculations, see details in the Appendix A. The knowledge of a precise position of the maximum is very important as at this point it is possible to determine, independently, a value of
τc using the
abscissa magnitude and the ratio in
eqn (3) as well as the
A0 value using the
ordinate magnitude, see details in Appendix A. After which, the
τc magnitude can be calculated at each temperature using
eqn (1) and the obtained value for
A0.
Following this procedure we initially obtained non-monotonic τc dependencies similar to the authors of ref. 8–10. However, a deeper analysis allowed discovery of an error in the calculations. Eqn (1) has two real roots at each temperature and both roots are positive. Calculation details are shown in Appendix B and the temperature dependencies of the roots, i.e. of the calculated τc values, are shown in Fig. 2. The root #1 (τc) shows an increase in the molecular mobility during an increase in temperature, i.e. it corresponds to conventional models of molecular mobility. The second root, in contrast, shows an increase of the molecular mobility during a decrease in temperature. This contradicts any existing theory, and therefore, this root does not have any physical meaning. It is worth emphasizing that such a situation is not only a feature of ionic liquids as similar solutions of the eqn (1) with two roots will be the result for any fluid system where a maximum in the 1/T1 temperature dependence is observed, e.g. in viscous liquids or concentrated electrolyte solutions.
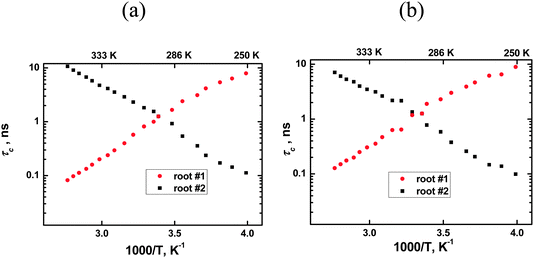 |
| | Fig. 2 Roots of eqn (1) for two carbons of the [bmim]+ cation: (a) the ring carbon 2 and (b) non-ring carbon 1′′ (CH3–N). Correct correlation times correspond to root #1. See the text for more details. | |
The authors of ref. 8–10 used the smaller root magnitude at all temperatures and they, therefore, calculated erroneous values for τc at lower temperatures, see the values on the right side of Fig. 2 in ref. 10. Alternatively, if one uses the root #1 in the whole temperature range, then the calculations lead to a conventional temperature dependence of τc for all spectral lines, hence, it is not necessary to involve additional experimental procedures, such as NOE, in order to transform 1/T1 experimental data into τc magnitudes.
Following this approach, we calculated τc temperature dependencies for all spectral lines (functional groups) of the cation with the exception of 4′-carbon (CH3-group of the butyl chain) as no clear position for a maximum was detected for that line in the temperature range used. It is worth emphasizing once again that no “set in advance” temperature dependence of τc was used in the calculation, therefore the received curves represent “true” τc values. The dependencies (Fig. 3) did not show any obvious signs of nonlinearity in the rather wide temperature range, therefore we found the use of a simple Arrhenius function possible:
for an approximation of obtained data, see
Table 1. The approximation was made on the 1000/
T scale between 2.80 (357 K) and 3.40 (294 K). In the area of lower temperatures a strong deviation from linearity was observed for 1′- and 2′-carbons (α- and β-CH
2-groups of the butyl chain), but this deviation simply reflects a deviation of the experimental 1/
T1 dependencies from the BPP-type, see Fig. 1b as well as Fig. 2a in
ref. 8. To be precise, the
τc magnitudes calculated in this area are incorrect, and these parts of the curves require a separate description. As regards the deviations of 1/
T1 dependencies themselves, they may be a result of an appearance of an additional low-temperature maximum of 1/
T1 due to an increase in the contribution of the internal rotation inside the cation butyl chain.
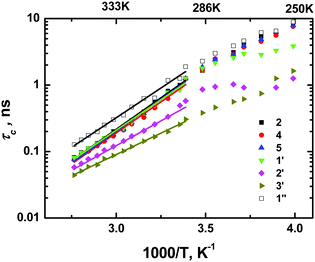 |
| | Fig. 3 Correlation times calculated from 13C spin–lattice relaxation rates of various carbons of [bmim]+ cations. | |
Table 1 Parameters of Arrhenius approximation (eqn (4)) of experimental data for 13C temperature dependence of 1/T1 relaxation rates in [BMIM]PF6. An attribution of the lines was indicated above
| Carbon numbering and corresponding group |
A
0/109 (s−2) |
τ
0 (fs) |
E
a (kJ mol−1) |
τ
c at 298 K (ns) |
| 2 (C2) |
1.25 |
0.46 |
36 |
1.02 |
| 4 (C4) |
1.37 |
0.36 |
37 |
0.98 |
| 5 (C5) |
1.37 |
0.49 |
36 |
0.88 |
| 1′ (α-CH2/CH2–N) |
1.51 |
0.68 |
35 |
0.94 |
| 2′ (β-CH2) |
1.34 |
4.2 |
28 |
0.42 |
| 3′ (γ-CH2) |
1.09 |
13 |
25 |
0.26 |
| 1′′ (CH3–N) |
0.46 |
1.4 |
34 |
1.4 |
The results of Table 1 show that all the main trends observed in ref. 8–13 remained. Unfortunately, a more detailed numerical comparison of the parameters of Table 1 with the data of ref. 8–10 was not possible due to two reasons. First, the sets of τc magnitudes in our studies and in ref. 8–10 were calculated using different procedures. Namely, in our work we calculated τc directly from the relaxation data while in ref. 8–10 a complicated procedure was used based on correcting the erroneous τc values calculated from 13C 1/T1 by using additional NOE data. We are not certain that the results of this correction are actually equal to our τc set. Second, the authors of ref. 8–10 used a complicated model for data fitting. Their model includes two correlation times, which describe the overall cation reorientation and internal rotations as well as non-Arrhenius temperature dependence of the overall correlation time. Although valid in essence, such a model overestimates the possibilities of the available set of experimental data for such a detailed description of the mobility of the cation. No particular signs of non-Arrhenius dependence were observed in the temperature range used (see above).
In summary, we found the origin of incorrect τc values which were calculated earlier (see ref. 8–10) from the temperature dependencies of 13C NMR relaxation rates of the ring carbons in a number of imidazolium-based ionic liquids. We demonstrated that the calculation using the right procedure leads to conventional temperature dependencies of τc for all carbons of the cation. This means that no additional experiments such as NOE are required to transform the experimental relaxation rates into the correct τc values. Hence, our findings have shown that a 13C NMR relaxation technique can be applied to ionic liquids equally successfully as for other liquid systems.
Appendix
A. The confirmation of eqn (3)
In this section, we describe the method of calculation of the temperature dependence of correlation time, τc, from 1/T1C experimental data. For the methods used, two factors are necessary: (i) the temperature dependence of 1/T1C has to achieve a maximum, (ii) the dependence has to be described by one correlation time approximation, i.e. by eqn (1). In other words, we calculated τc based on eqn (1) using eqn (3).
First, we demonstrate the correctness of eqn (3). A similar relationship is well known for a 1H relaxation rate in the form of (τcωH) ≈ 0.616. However, as we could not find the correct relation for carbon relaxation in the literature, we therefore demonstrate below how the conditions of the function in eqn (1) maximum can be obtained.
Due to the fact that (ωH/ωC) ≈ 3.976 the following relations can be calculated (ωC + ωH)/ωC ≈ 4.976 and (ωC − ωH)/ωC ≈ 2.976. Using these relations and multiplying eqn (1) by ωCeqn (1) can be expressed as:
| |  | (A.1) |
where
x = (
ωCτc) is a new dimensionless variable,
| |  | (A.2) |
| |  | (A.3) |
| |  | (A.4) |
Eqn (A.1) is an universal equation because it is only determined by variable x, i.e. it does not directly depend on the temperature or ωC (which changes with the frequency of the NMR spectrometer). The position of the maximum of eqn (A.1) can be found through the roots of the equation
| |  | (A.5) |
Eqn (A.5) possesses only two real roots x1,2 ≈ ±0.791 and the positive root x ≈ 0.791 has a physical meaning. As an illustration, we also demonstrate y(x) and its components in Fig. 4. Hence, in the 1/T1C maximum x(= ωCτc) ≈ 0.791, i.e.eqn (3) is confirmed.
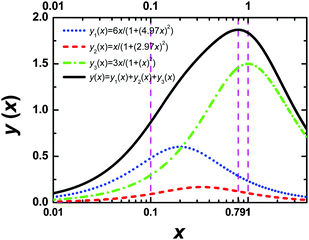 |
| | Fig. 4 The dependence of y(x) function and its components. The position of maximum of y(x) is equal to 0.791. | |
B. Calculation of the A0 constant and the roots of eqn (1)
Eqn (3) allows the constant A0 to be calculated by using experimental data from 1/T1C at its maximum point. Substituting the values of x = 0.791 at the point of maximum to eqn (A.1) the constant of A0 is calculated by the following equation| | 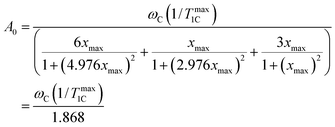 | (B.1) |
where (1/Tmax1C) is the experimental value of 1/T1C in the maximum. The calculated values of A0 are shown in Table 1. The knowledge of the A0 constant allows the correlation time, τc, to be calculated at each experimental point as the root of eqn (B.2).| |  | (B.2) |
As is evidenced from eqn (A.1)
at
G(
xroot) = 0. As an illustration, the
G(
x) functions for several experimental points of the peak of carbon 2 are shown in
Fig. 5. The values of
xroot at
G(
x) = 0 are the roots of
eqn (B.2).
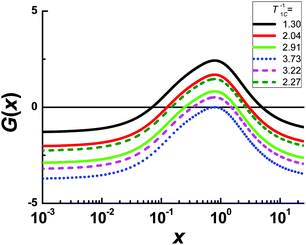 |
| | Fig. 5 The function of G(x) for the carbon 2 line at different experimental values of 1/T1C. The solid curves correspond to the left side of the 1/T1C maximum, the dashed curves correspond to the right side of the 1/T1C maximum, the dotted curve correspond to 1/T1C in maximum. The values of x at G(x) = 0 are the roots of eqn (B.2). | |
Each function G(x) = 0 has two different roots with the exception of G(x) for 1/T1C at the maximum. In this exception, two roots degenerate into one. We solved eqn (B.2) by numerical methods and found both τc by eqn (B.3). The results of the calculation for the peak of carbon 2 are shown in Fig. 2. However, only one root is physically justified. For a discussion regarding the choosing of the root see the section: Results and discussion.
Acknowledgements
Helpful discussions with Dr Maxim Dolgushev are gratefully acknowledged. The work was partly supported by RFBR (grant No. 13-03-01073), Research programs of Saint-Petersburg State University (grant No. 11.0.63.2010).
References
- M. Imanari, M. Nakakoshi, H. Seki and K. Nishikawa, Chem. Phys. Lett., 2008, 459, 89–93 CrossRef CAS PubMed.
- K. Nakamura and T. Shikata, ChemPhysChem, 2010, 11, 285–294 CrossRef CAS PubMed.
- H. Weingärtner, Curr. Opin. Colloid Interface Sci., 2013, 18, 183–189 CrossRef PubMed.
-
K. Hayamizu, in “Translational and Rotational Motions for TFSA-Based Ionic Liquids Studied by NMR Spectroscopy” Chapter In: Ionic Liquids - Classes and Properties, ed. S. T. Handy, In Tech, 2011, 344 (ISBN 978-953-307-634-8) Search PubMed.
- W. Shi, K. Damodaran, H. B. Nulwala and D. R. Luebke, Phys. Chem. Chem. Phys., 2012, 14, 15897–15908 RSC.
- K. Hayamizu, S. Tsuzuki, S. Seki and Y. Umebayashi, J. Phys. Chem. B, 2012, 116, 11284–11291 CrossRef CAS PubMed.
- Y. Chen, Y. Cao, Y. Zang and T. Mu, J. Mol. Struct., 2014, 1058, 244–251 CrossRef CAS PubMed.
- J. H. Antony, D. Mertens, A. Dölle, P. Wasserscheid and W. R. Carper, ChemPhysChem, 2003, 4, 588–594 CrossRef CAS PubMed.
- W. R. Carper, P. G. Wahlbeck, J. H. Antony, D. Mertens, A. Dölle and P. Wasserscheid, Anal. Bioanal. Chem., 2004, 378, 1548–1554 CrossRef CAS.
- W. R. Carper, P. G. Wahlbeck and A. Dolle, J. Phys. Chem. A, 2004, 108, 6096–6099 CrossRef CAS.
- J. H. Antony, D. Mertens, A. Dölle, P. Wasserscheid, W. R. Carper and P. G. Wahlbeck, J. Phys. Chem. A, 2005, 109, 6676–6682 CrossRef CAS PubMed.
- N. E. Heimer, J. S. Wilkes, P. G. Wahlbeck and W. R. Carper, J. Phys. Chem. A, 2006, 110, 868–874 CrossRef CAS PubMed.
- J. H. Antony, D. Mertens, T. Breitenstein, A. Dölle, P. Wasserscheid and W. R. Carper, Pure Appl. Chem., 2004, 76, 255–261 CrossRef CAS.
- M. Imanari, H. Tsuchiya, H. Seki, K. Nishikawa and M. Tashiro, Magn. Reson. Chem., 2009, 47, 67–70 CrossRef CAS PubMed.
- V. P. Ananikov, Chem. Rev., 2011, 111, 418–454 CrossRef CAS PubMed.
- N. Bloembergen, E. M. Purcell and R. V. Pound, Phys. Rev., 1948, 73, 679–685 CrossRef CAS.
- I. Solomon, Phys. Rev., 1955, 99, 559–565 CrossRef CAS.
-
G. C. Levy and D. J. Kerwood, Encyclopedia of Nuclear Magnetic Resonance, Willey, New York, 1996, vol. 2, p. 1147 Search PubMed.
- G. Lipari and A. Szabo, J. Am. Chem. Soc., 1982, 104, 4546–4559 CrossRef CAS.
|
| This journal is © the Owner Societies 2014 |
Click here to see how this site uses Cookies. View our privacy policy here.  Open Access Article


