 Open Access Article
Molecular dynamics in azobenzene liquid crystal polymer films measured by time-resolved techniques†
T.
Fujii
a,
S.
Kuwahara
b,
K.
Katayama
*a,
K.
Takado
ab,
T.
Ube
b and
T.
Ikeda
*b
aDepartment of Applied Chemistry, Chuo University, 1-13-27, Kasuga, Bunkyo, Tokyo 112-8551, Japan. E-mail: kkata@kc.chuo-u.ac.jp; Fax: +81-3-3817-1913; Tel: +81-3-3817-1913
bResearch and Development Initiative, Chuo University, 1-13-27, Kasuga, Bunkyo, Tokyo 112-8551, Japan. E-mail: tikeda@tamacc.chuo-u.ac.jp
First published on 28th February 2014
Abstract
Photo-induced molecular motion in a liquid crystal polymer film including azobenzene was studied by the heterodyne transient grating method. The film was confined in a liquid crystal cell, where it is a photomobile film under free-standing conditions. By observation of the refractive index change induced by a laser pulse, contraction of the film was observed on the order of several hundreds of nanoseconds, and the subsequent reorientation and molecular rotation dynamics were observed from a few microseconds to a hundred milliseconds. Finally, the cis isomer of azobenzene was thermally returned back to the trans isomer in about ten seconds because the film could not be bent in the liquid crystal cell. Since the contraction, reorientation and molecular rotation took place before the cis to trans back-transformation, these processes correspond to the preliminary molecular motion preceding the macroscopic bending of the film.
Introduction
In soft materials such as liquid crystals (LCs) and polymers, it is sometimes observed that microscopic molecular interactions induce a change in macroscopic properties via the collaborative interactions between molecules, molecular chains, domains, etc., where the molecular-scale change is expanded spatially into the micron- or milli-scale region. This kind of spatio-temporal change has not been fully understood because it is difficult to examine using a single sophisticated measurement technique; nanoscopic or microscopic observation reveals the structural change but not its dynamics, and ultrafast measurements clarify the dynamics of the molecular interactions, but not of the macroscopic change. Thus, we need to observe the spatio-temporal dynamics from the molecular level to the macroscopic level, for a wide time range.As for interesting soft materials, various polymers and LCs including azobenzene have been proposed as photo-responsive materials1–4 for various applications such as photo-mechanical motion, photo-responsive surface modification,5 rewritable hologram or grating formation,6–9 photo-induced alignment7,10etc., and various LC polymers have been developed.11 Ikeda et al. have developed a series of materials which show a photo-induced bending or motion of the azobenzene LC polymers.12 In this moiety, the azobenzene connected to the mesogen is subject to photo-isomerization, causing the polymer chain contraction to induce the macroscopic transformation,3 which is a good example of a small molecular structural change being expanded spatially into a macroscopic change.4,13 Interestingly, the LC polymer film showed a polarization dependence of the bending direction,3,14 which is due to the collaborative interaction between LC molecules. Furthermore, the macroscopic transformation was reversibly controlled by irradiation with visible and UV light, through controlling the structure of the cis and trans isomers. Utilizing these features, a plastic motor,15 an inch-sized worm, a robotic arm,16 and a cantilever17 driven only by light, were developed.
The overall mechanism was understood as the surface region of the film contracting more than its bottom side by excess UV absorption in the surface region.3 Although many efforts have been made to investigate the mechanism,18,19 it has not yet been fully understood in terms of what kinds of interactions between molecules, molecular chains, and domains are involved and over what time-scale they happen.
On the other hand, we have developed a new type of time-resolved technique, called the heterodyne transient grating (HD-TG) method,20,21 which features a highly sensitive detection of changes to the refractive index and a wide temporal response from nanoseconds to seconds.22 In a previous paper, it was applied to a LC and revealed the disordering and subsequent reorientation dynamics induced by a light pulse. The disordered alignment of the LC returned back to its original state in a LC cell.23–25 Since this technique detects changes in the refractive index, it is suitable to observe soft materials such as polymers or LCs,24,26 which typically do not have optical absorption in the visible wavelength region. The change in the refractive index typically reflects the order parameter for LC samples, from which we can get information on the molecular rotation and the ordering state of the LC molecules in the temporal domain. Furthermore, our technique gives information on the polarization dependence of the refractive index change, which is beneficial for understanding the direction of the molecular orientation or ordering.
In this study, we studied the molecular dynamics in an azobenzene LC polymer film by using the HD-TG technique, combined with the transient absorption (TA) technique. We successfully observed the dynamics over a wide time range, and examined the molecular motions which precede the macroscopic structural change.
Experimental
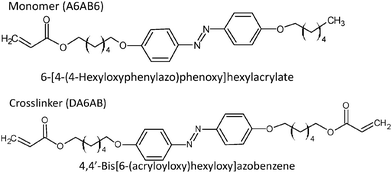
An azobenzene LC polymer was prepared by the same procedures as reported before.16 The monomer molecule used was 6-[4-(4-hexyloxyphenylazo)phenoxy]hexylacrylate (A6AB6), and 4,4′-bis[6-(acryloyloxy)hexyloxy]azobenzene (DA6AB) was used as a crosslinker, as shown in Fig. 1. The phase transition temperatures for these are shown in Table 1. The monomer (6.6 × 10⁻² mmol) and crosslinker (2.8 × 10⁻² mmol) were dissolved in chloroform (1 mL). After that, Irgacure® 784 (2 mol%) was added as an initiator for polymerization, and the chloroform was removed by evaporation. The mixture sample was dissolved at 110 °C and put in a LC cell (15 mm × 20 mm). The temperature was decreased to 88 °C at a rate of 0.5 °C min−1, and polymerization was induced by irradiation with a high-pressure mercury lamp (USHIO, OPM2-502HQ) with a wavelength >540 nm by using glass filters (Y520 + HA50) and an intensity of 2 mW cm−2 for 2 h. The final thickness of the film was 16 μm. The film was bent under UV illumination, typically at 10 mW cm−2, and returned back to its original position by illumination with visible light (>540 nm), typically at 40 mW cm−2 (see Fig. S1 in the ESI†). The glass transition temperature (Tg) was 24 °C, (the result of the DSC measurement is shown in Fig. S2 in the ESI†) and the dynamics measurements were performed at temperatures higher than Tg.The polarized absorption spectrum was measured by a spectrometer (Ocean Optics, USB2000+), which was modified by inserting a plate polarizer before light irradiation of the sample, and the spectrum was measured for the polarization direction parallel and perpendicular to the director axis.
The principle of the HD-TG technique was described in previous papers,21,22 and a brief explanation is given in the ESI† (Fig. S3). The alignment of the LC cell and the polarization directions of the pump and probe light are also shown in the ESI† (Fig. S4). In the HD-TG signal, a refractive index change is induced by a third-order nonlinear polarization, which is given by, for example,
| Px = χ(3)xxyyEx,probeEy,pumpEy,pump | (1) |
In this case, the polarization in the x direction is induced by the probe polarization in the x direction and the pump polarization in the y direction. In our measurements, the refractive index change was observed by the probe in the x or y direction. The index changes, Δnx and Δny, for each probe polarization, in the case of the pump polarization parallel to the LC director, are expressed as25
 | (2) |
 | (3) |
Typically, χ(3)yyyy ≫ χ(3)yxyy, χ(3)xyyy > χ(3)xxyy is assumed. The index change is divided into three parts depending on the physical origin, as
| Δn(t) = ΔnT(t) + Δnρ(t) + ΔnS(t), | (4) |
 | (5) |
Then, the temporal response of this signal corresponds to the thermal grating of the LC. For most LCs, (∂n/∂ρ)T > 0 and (∂ρ/∂T) < 0, and then the index change is negative, and also the sign is not dependent on the polarization of the probe. This thermal signal was typically used as a reference of the sign of the refractive index change. The ΔnS(t) term is the main cause of the alignment dynamics of the LC, and it can be expanded to
 | (6) |
It is noted that changes in the order parameter and temperature give different behaviour in the temporal response. For an oval molecule aligned in the direction of the y-axis, the index change for the x and y polarized light is25
 | (7) |
![[thin space (1/6-em)]](https://www.rsc.org/images/entities/char_2009.gif) θ〉 − 1)/2, where θ is defined as the angle between the director and the molecular axis, and 〈cos2
θ〉 − 1)/2, where θ is defined as the angle between the director and the molecular axis, and 〈cos2![[thin space (1/6-em)]](https://www.rsc.org/images/entities/char_2009.gif) θ〉 indicates the average of cos2
θ〉 indicates the average of cos2![[thin space (1/6-em)]](https://www.rsc.org/images/entities/char_2009.gif) θ. Looking into S(θ), a change in the order parameter is caused by two reasons; a θ change due to the molecular rotation, and an ordering change because disordering reduces the average of cos2
θ. Looking into S(θ), a change in the order parameter is caused by two reasons; a θ change due to the molecular rotation, and an ordering change because disordering reduces the average of cos2![[thin space (1/6-em)]](https://www.rsc.org/images/entities/char_2009.gif) θ even for the same orientation angle. Thus, the dynamics of molecular rotation and ordering changes are monitored by the index change.
θ even for the same orientation angle. Thus, the dynamics of molecular rotation and ordering changes are monitored by the index change.
In the HD-TG and TA measurements, the pump light was from a Nd:YAG pulsed laser (pulse width: 4 ns, wavelength: 355 nm, intensity: 0.14 mJ per pulse) and the probe light was from a Nd:YVO4 laser (wavelength: 532 nm, intensity: 5 mW) or a laser diode (wavelength: 638 nm, intensity: 5 mW). The diameter of the area irradiated by the pump pulse was 5 mm. The pump intensity was reduced so as not to cause any nonlinear effects or damage, and it was set within the range where the response waveform was proportional to the intensity. The interval between pump pulses was long enough so that the baseline went back to the original value, which was typically 60 seconds. The grating spacing used for the HD-TG measurements was 60 μm. The responses were detected by a photodiode (Thorlabs, DET110), connected to a voltage amplifier (Femto, DHPVA) and the signal was sent to the oscilloscope (Lecroy, Wave Runner 6100A). The LC cell was temperature controlled by a controller (Thorlabs, TC200) with a sheet heater rolled around the cell, from RT to 90 °C.
Results
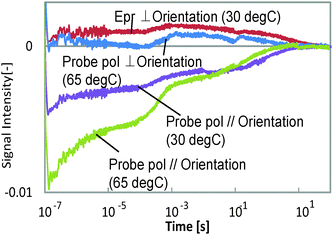
Typical HD-TG responses for the different probe polarization directions are shown in Fig. 2. The probe wavelength was 638 nm and the temperatures were 30 and 65 °C. This film was bent at a right angle for 30 s at 65 °C, while it took 240 s at 30 °C. We could observe 5 components in the ranges of <1 μs, 1–100 μs, 100 μs–1 ms, 1–100 ms, and 100 ms–10 s in each response even though the amplitudes were different depending on the probe polarization or the temperature. The signal intensity depended on the pump intensity, but the response time (waveform) did not depend on it. The 1st and 3rd components had refractive index changes with a negative sign for both the probe polarizations, and the other components showed a different sign for each probe polarization. It is noted that the polarization dependence was more anisotropically induced at 65 °C, at which temperature this film is more easily bent than at 30 °C.The other thing we noted is that the HD-TG signal returned back to the background intensity after several tens of seconds, which means that the film returned back to its original state. Even though the film is bent and remains this shape after UV irradiation under free-standing conditions, it is supposed that in this case it was not bent due to the mechanical stress caused by confining the film in the LC cell. Thus, initially the molecules and the molecular chains were trying to move, but they relaxed and did not extend into a macroscopic structural change.
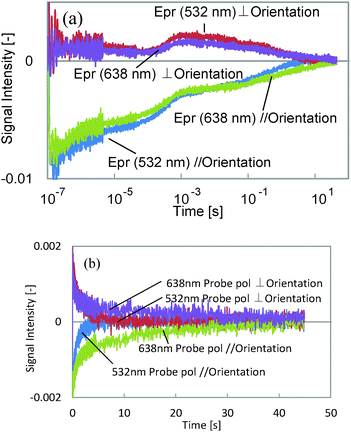
First, we assigned each component and the probe wavelength dependence is shown in Fig. 3. We observed the decrease in the decay time for the 5th component by changing the wavelength from 638 to 532 nm for both probe polarizations, although the other components showed only a slight intensity change. It is well known that the cis isomer of azobenzene has a small absorbance at 532 nm,11 and also the bent state of this film is known to return back to the original state by irradiation with visible light, which includes the wavelength region of 532 nm. Thus, it is considered that the last component corresponds to the back-transformation from the cis to trans isomer, which was accelerated by the green laser.
Next, TA responses were measured at 532 and 638 nm; no responses were observed at 638 nm, and an absorption increase at 532 nm was observed for both polarizations. The comparison between the TA and the HD-TG responses is shown in Fig. 4. As we have discussed, this absorption corresponds to the absorption of the cis isomer. The decay times for the TA responses at 532 nm agreed well with those for the 5th components in the HD-TG responses, which supports the assignment of this component. The other point is that the TA responses gave only this component, which implies that the other components in the HD-TG responses originated not from the azobenzene, but from the LC polymer. Since the back-transformation from the cis isomer to the trans isomer took place over hundreds of milliseconds to a few tens of seconds, the dynamics observed in advance of this process are supposed to be due to changes induced by the cis isomers, corresponding to preliminary changes before the macroscopic structural change, which was prevented by the LC cell in this experiment.
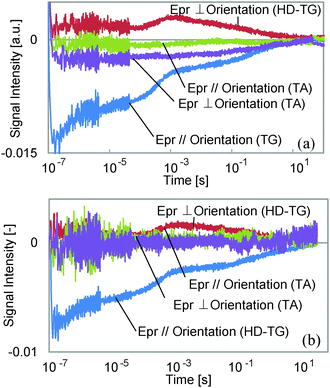 | ||
| Fig. 4 A comparison between the HD-TG and TA responses at probe wavelengths of (a) 532 nm, and (b) 638 nm. For the TA responses, the negative signal indicates an absorption increase. | ||
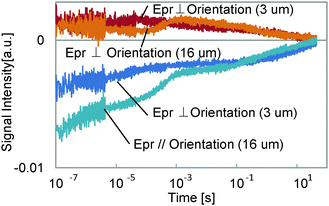
The thickness dependence was studied, and is shown in Fig. 5. For the thinner sample, the 3rd component at 100 μs to 1 ms was lost in the response, while the other components did not change. As was explained in the experimental section, the component without a probe polarization dependence of the signal sign is supposed to have a thermal origin. Furthermore, the time region for this component is a typical thermal response time for polymers or thin films.26,27 It is reasonable that this component was caused by the density change due to temperature increase, which was lost when the film thickness was decreased, because a thinner layer caused a smaller phase change for the probe light, which is the origin of the HD-TG signal. The thermal diffusion time did not depend on the temperature so much, which indicates that the thermal conductivity of the film was similar for both temperatures, but it looks slightly faster for a probe polarization parallel to the molecular orientation than for a probe polarization perpendicular to the molecular orientation, which indicates the anisotropic thermal property of the film.
A sample before polymerization was measured, which was just a mixture of the monomer and the crosslinker, and the result is shown in Fig. 6. We found the 5th component, corresponding to the transformation from the cis to trans isomer, but the signal intensity was around one-fifth of that for the polymerized samples, and no remarkable response except for the photo-isomerization was observed, although an unknown small response was observed at <10 μs. Thus, it is thought that the 1st, 2nd and 4th components originate from the LC polymer.
Discussion
With regard to the 1st component, like the 3rd component, the changes in the refractive index showed negative signs for both probe polarizations, which indicate that the corresponding process is an isotropic change. Since the temporal range was of the order of hundreds of nanoseconds, and the thermal response was assigned to the 3rd component, this is caused by an isotropic change not of thermal origin. Because azobenzene itself is photo-isomerized at least within several tens of picoseconds,28,29 the time response was too slow for this process. Thus, it is considered that this corresponds to an isotropic polymer structural change followed by the photo-isomerization of the azobenzene molecules. Since the sign of the refractive index change was negative, the corresponding change is the contraction of the LC polymer. This is consistent with the explanation that the photo-irradiated region contracted when the film was bent.The 2nd and 4th components were observed in the microsecond to millisecond region. In previous studies24,25 on the dynamics of LCs when they were structurally disordered by a pulsed laser, there were typically two processes; reorientation due to the molecular rotation, and molecular ordering. Thus, it is considered that the 2nd and 4th components correspond to these. In studies on the phase transition dynamics of LCs including azobenzene by using transient absorption30 and transient reflectivity31 measurements, the motion of the LC molecules occurs over the temporal range of hundreds of microseconds, where the molecules are rotated and disordered. The time-scale for this process agrees with that for the 2nd component, which suggests that this corresponds to the molecular rotation process. On the other hand, photo-induced formation of a holographic grating for an azobenzene polymer takes several tens of milliseconds,32 where the molecules are orderly aligned causing a refractive index change. Since this time agrees with the time constants for the 4th component, it would thus correspond to the reorientation process in the state including the cis-azobenzene. The unknown process observed only for a sample before polymerization, observed around <10 μs, will correspond to the rotation and reorientation processes, which are smaller in signal intensity and faster than those for the polymerized sample. It is supposed that the collective molecular motion is less organized than for the polymerized sample, causing a smaller refractive index change, and that the flexible molecular structure results in a faster motion of the molecules.
However, these rotation and reorientation processes were not clearly separated and it is supposed that they proceed over the same time from 10 μs to 100 ms. Since the back-transformation from the cis to the trans isomer proceeds on a time-scale slower than 100 ms, the rotation and reorientation processes correspond to the molecular motions during which the film becomes a quasi-stationary state including cis-azobenzene, which would be the preliminary molecular realignment for bending. The transient response was extended over a wide temporal range, and could not be fitted with a simple function such as a combination of exponential functions, and we need to further study the molecular dynamics by comparing the responses for different monomer ratios, temperatures, and thicknesses, etc. In our measurements, the LC polymer was not actually bent due to confinement in the liquid crystal cell, and we observed that the force applied to the LC polymer was gradually relaxed in the cell by the back-transformation from the cis to the trans isomer.
One thing to note is that the refractive index change was more anisotropic at 65 °C than at 30 °C, and this can be interpreted as more molecules moving in the direction parallel to the orientation direction and less molecules moving in the direction perpendicular to the orientation direction. This is consistent with the fact that the film is easily bent at 65 °C because of the larger collaborative molecular motion in a specific direction.
Conclusions
We studied the molecular dynamics induced by photo-irradiation of a LC polymer film including azobenzene, which is well known as a photomobile plastic. We successfully measured the anisotropic response via the refractive index change, and volume contraction, rotation and reorientation dynamics were observed over nanoseconds to milliseconds, which are the preliminary molecular dynamics before macroscopic bending. This methodology gives a deep understanding of the temporal expansion of molecular interactions to macroscopic change. However, the study of the dynamics with regards to spatial or directional change is still lacking, and we need to add more structural information by combining microscopic observation, which is now being studied. Furthermore, we need to understand the difference between the molecular motion of the free standing film and that in the LC cell in this study, to clarify the actual motion when bending occurs, and it would help the development of new materials if such information could be related to the mechanical properties and the response time.Notes and references
- A. Emoto, E. Uchida and T. Fukuda, Polymers, 2012, 4, 150–186 CrossRef CAS
.
- F. Ercole, T. P. Davis and R. A. Evans, Polym. Chem., 2010, 1, 37–54 RSC
.
- C. J. Barrett, J. I. Mamiya, K. G. Yager and T. Ikeda, Soft Matter, 2007, 3, 1249–1261 RSC
.
- Y. Yu and T. Ikeda, J. Photochem. Photobiol., C, 2004, 5, 247–265 CrossRef CAS
.
- T. Ubukata, T. Seki and K. Ichimura, Adv. Mater., 2000, 12, 1675–1678 CrossRef CAS
.
- A. Shishido, Polym. J., 2010, 42, 525–533 CrossRef CAS
.
- T. Seki and S. Nagano, Chem. Lett., 2008, 37, 484–489 CrossRef CAS
.
-
A. Natunsohn and P. Rochon, in Photonic and Optoelectronic Polymers, ed. S. A. Jenekhe and K. J. Wynne, American Chemical Society, 1997, vol. 672, pp. 236–250 Search PubMed
.
- N. Kawatsuki, T. Hasegawa, H. Ono and T. Tamoto, Adv. Mater., 2003, 15, 991–994 CrossRef CAS
.
- N. Kawatsuki, Chem. Lett., 2011, 40, 548–554 CrossRef CAS
.
- V. Shibaev, A. Bobrovsky and N. Boiko, Prog. Polym. Sci., 2003, 28, 729–836 CrossRef CAS
.
- Y. L. Yu, M. Nakano and T. Ikeda, Nature, 2003, 425, 145 CrossRef CAS PubMed
.
- T. Seki, Polym. J., 2004, 36, 435–454 CrossRef CAS
.
- T. Ikeda, M. Nakano, Y. L. Yu, O. Tsutsumi and A. Kanazawa, Adv. Mater, 2003, 15, 201–205 CrossRef CAS
.
- M. Yamada, M. Kondo, J. I. Mamiya, Y. L. Yu, M. Kinoshita, C. J. Barrett and T. Ikeda, Angew. Chem., Int. Ed., 2008, 47, 4986–4988 CrossRef CAS PubMed
.
- M. Yamada, M. Kondo, R. Miyasato, Y. Naka, J.-i. Mamiya, M. Kinoshita, A. Shishido, Y. Yu, C. J. Barrett and T. Ikeda, J. Mater. Chem., 2009, 19, 60–62 RSC
.
- T. J. White, S. V. Serak, N. V. Tabiryan, R. A. Vaia and T. J. Bunning, J. Mater. Chem., 2009, 19, 1080–1085 RSC
.
- F. Simoni and O. Francescangeli, J. Phys.: Condens. Matter, 1999, 11, R439 CrossRef CAS
.
- J.-i. Mamiya, Polym. J., 2013, 45, 239–246 CrossRef CAS
.
- K. Katayama, M. Yamaguchi and T. Sawada, Appl. Phys. Lett., 2003, 82, 2775–2777 CrossRef CAS
.
- M. Okuda and K. Katayama, Chem. Phys. Lett., 2007, 443, 158–162 CrossRef CAS
.
- M. Okuda and K. Katayama, J. Phys. Chem. A, 2008, 112, 4545–4549 CrossRef CAS PubMed
.
- M. Terazima, Bull. Chem. Soc. Jpn., 1996, 69, 1881–1887 CrossRef CAS
.
- T. Chiba, H. Inoue, S. Kuwahara and K. Katayama, J. Photochem. Photobiol., A, 2013, 266, 1–5 CrossRef CAS
.
- B. Yoon, S. H. Kim, I. Lee, S. K. Kim, M. Cho and H. Kim, J. Phys. Chem. B, 1998, 102, 7705–7713 CrossRef CAS
.
- M. Arai, T. Fujii, H. Inoue, S. Kuwahara and K. Katayama, Anal. Sci., 2013, 29, 401–404 CrossRef CAS PubMed
.
- H. Hata, K. Katayama, Q. Shen and T. Toyoda, Jpn. J. Appl. Phys., 2012, 51, 042601 CrossRef
.
- N. Tamai and H. Miyasaka, Chem. Rev., 2000, 100, 1875–1890 CrossRef CAS PubMed
.
- T. Fujino, S. Y. Arzhantsev and T. Tahara, J. Phys. Chem. A, 2001, 105, 8123–8129 CrossRef CAS
.
- O. Tsutsumi, T. Shiono, T. Ikeda and G. Galli, J. Phys. Chem. B, 1997, 101, 1332–1337 CrossRef CAS
.
- A. Shishido, O. Tsutsumi, A. Kanazawa, T. Shiono, T. Ikeda and N. Tamai, J. Am. Chem. Soc., 1997, 119, 7791–7796 CrossRef CAS
.
- T. Yamamoto, A. Ohashi, S. Yoneyama, M. Hasegawa, O. Tsutsumi, A. Kanazawa, T. Shiono and T. Ikeda, J. Phys. Chem. B, 2001, 105, 2308–2313 CrossRef CAS
.
Footnote |
| † Electronic supplementary information (ESI) available: Pictures of the film bending, the DSC scan for the film, the principle of the heterodyne transient grating method, and the alignment of the sample and light polarization. See DOI: 10.1039/c4cp00457d |
| This journal is © the Owner Societies 2014 |

