 Open Access Article
Creative Commons Attribution 3.0 Unported Licence
Enhanced sensitivity of electron-nuclear double resonance (ENDOR) by cross polarisation and relaxation†
Roberto
Rizzato
a and
Marina
Bennati
*ab
aResearch Group EPR Spectroscopy, Max Planck Institute for Biophysical Chemistry, Am Fassberg 11, 37077 Göttingen, Germany. E-mail: mbennat@gwdg.de; Fax: +49 551 201 1383; Tel: +49 551 201 1911
bDepartment of Chemistry, University of Göttingen, Tammanstr. 2, 37077 Göttingen, Germany
First published on 3rd March 2014
Abstract
Electron-nuclear double resonance (ENDOR) is a method of choice to detect magnetic nuclei in the coordination sphere of paramagnetic molecules, but its sensitivity substantially suffers from saturation effects. Recently we introduced a new pulsed ENDOR experiment based on electron-nuclear cross polarisation (CP) transfer. Here we analyse the time evolution of the spin polarization in CP-ENDOR and show that CP combined with inherent fast relaxation leads to enhanced sensitivity as compared to Davies ENDOR.
Electron-nuclear double resonance (ENDOR) comprises a well-established group of spectroscopic methods that detect magnetic nuclei in the vicinity of paramagnetic centers.1–4 The technique plays a key role in a wide number of applications ranging from structural investigation of proteins and metalloenzymes5–8 to catalysis,9 materials science and quantum information research.10–13 Specifically, ENDOR is a double frequency experiment in which microwave (mw) and radio frequency (RF) irradiations are used to transfer polarization from electron to nuclear spins. The detection of nuclear spin transitions occurs via the electron spins providing much higher sensitivity with respect to a conventional nuclear magnetic resonance (NMR) experiment. Although standard pulse ENDOR, such as Davies and Mims,1,2 should theoretically deliver a complete transfer of spin polarization (ENDOR effect), in practice this rarely happens due to experimental constraints such as inhomogeneities in the RF field and off-resonance effects in broad lines of powder samples.14,15 The scarce ENDOR effect needs to be compensated either by a large amount of the sample or by accumulating signals for long times. Therefore, the role of signal averaging combined with spin relaxation becomes of prime importance. Unfortunately, standard pulsed ENDOR techniques require that the waiting time for repetition of the sequence is on the order of the nuclear spin-lattice relaxation time T1I. For experiments performed in frozen solutions at very low temperatures and/or for detecting low-gamma nuclei, this might lead to measurement times of several days. Pulsed ENDOR efficiencies have been analyzed in several papers3,4,14–18 and modifications of the Davies ENDOR experiment have been proposed, but their performance in powder samples is still not optimal. We have recently proposed19 a new ENDOR experiment, which utilizes electron-nuclear cross polarization (CP) to polarize ENDOR transitions, as earlier introduced in the context of dynamic nuclear polarization.20–22 The so-called CP-ENDOR spectra are characterized by an asymmetric intensity of the ENDOR lines, which permits extraction of the relative sign of hyperfine couplings. Moreover, this method appeared insensitive to nuclear saturation effects. In this communication we analyze the time evolution of spin polarization after electron-nuclear cross polarization. We find that the steady state CP-ENDOR polarization is due to the peculiar relaxation behavior related to the asymmetric polarization of the hyperfine lines combined with the effect of the CP sequence.
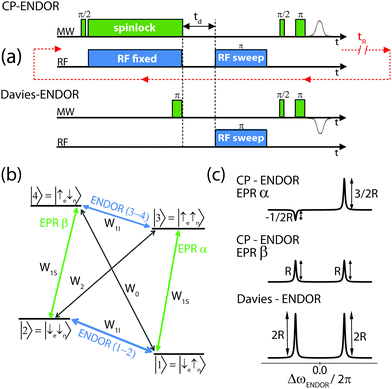
The CP-ENDOR experiment is illustrated in Fig. 1a. A selective mw 90° pulse excites the magnetization of either the α or the β EPR transition (defined in Fig. 1b). Subsequently, a mw spin-lock pulse with a 90° phase shift is applied for several μs, during which the electron spin system can be considered to be in a dressed state.20,23 Additional RF irradiation induces transitions between pairs of states, if specific resonance conditions (matching conditions) are fulfilled. In a two-spin system S = 1/2, I = 1/2 there are four possible matching conditions, but in powders only two given by ΔωCPn = ±(ωβ + ωα)/2 lead to a net nuclear polarization effect,19–21 where ωα and ωβ are the effective fields of the electron spin in the mw spin-lock frame  , A is the hyperfine (hf) coupling, ΔωCPn and Δωe are the RF-CP and mw field offsets and ω1e is the mw field strength. For sufficiently long irradiation times, the effect of the RF is to saturate a matched pair of energy levels and to create a strong non-Boltzmann polarization across the ENDOR lines.19 Thus, the CP step acts similarly as the preparation π-pulse in Davies ENDOR (Fig. 1a); however, the generated polarization profile is quite different. When a CP condition is met for a spin packet by the appropriate CP-RF offset then the CP-ENDOR intensities depend on the detected electron spin manifold, α or β. The ENDOR lines can have either opposite asymmetric polarization (Fig. 1c, top) or equal and positive polarization (Fig. 1c, center). In the following we denote the first case as an asymmetric and the second as a symmetric CP-ENDOR spectrum. In a powder sample, detection of EPR α and β transitions from different spin packets occurs concomitantly, resulting in the sum of these two contributions, i.e. an absorptive asymmetric CP-ENDOR spectrum. In comparison, the Davies ENDOR spectrum consists of two symmetric lines (Fig. 1c, bottom).
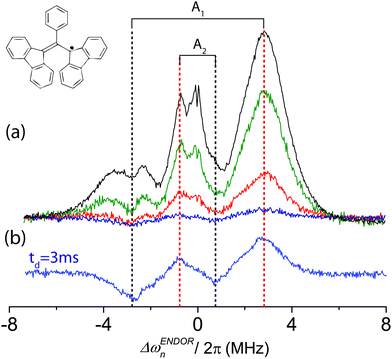
In our previous paper we reported the observation that the CP-ENDOR spectrum is little affected by saturation for repetition times tr ≤ T1S, the electron spin-lattice relaxation time, in contrast to the Davies ENDOR. Thus, to be able to investigate kinetics we have varied the time delay td between the spin-lock pulse and the rf read out π-pulse (Fig. 1a). The CP-ENDOR spectrum of 0.1% 1H bis-diphenylene-phenyl-allyl (BDPA) in protonated polystyrene matrix at 34 GHz is shown in Fig. 2. At very short td the spectrum consists of four lines arising from two hf-couplings of about |1| and |5| MHz. Because the hf couplings have different signs, the enhanced ENDOR lines (Fig. 2, red grids) occur at different sides of the Larmor frequency. By increasing td the polarization pattern changes and two ENDOR lines (the non-enhanced ones, Fig. 2 grey grids) become emissive.‡ To analyse the kinetics in more detail, we plotted the intensity of the ENDOR lines at ΔωENDORn/2π = ±2.5 MHz as a function of the time delay td. The whole CP-ENDOR spectrum was recorded at each delay time td and S = IENDOR − IENDOR,baseline was extracted. The obtained decay curves at two different EPR frequencies, i.e. 34 and 94 GHz, are displayed in Fig. 3a and b. In all traces the time evolution of nuclear polarization follows a bi-exponential behaviour of the form SENDOR(t) = A1e−t/τ1 ∓ A2e−t/τ2, with a fast and a slow relaxing amplitude. We were able to fit the decay of both ENDOR lines with bi-exponentials of similar values and amplitudes at each respective frequency (Table 1).
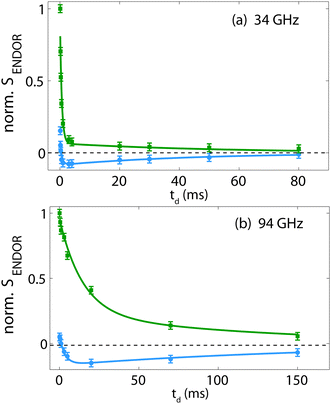 | ||
| Fig. 3 Intensity of the CP-ENDOR lines at ΔωENDORn/2π = +2.5 MHz (green) and −2.5 MHz (blue) as a function of td at 34 GHz and T = 20 K (a) and 94 GHz, T = 50 K (b). Exp. conditions for 94 GHz: π/2 mw: 100 ns; tCP = 200 μs, π rf = 28 μs, ΔωCPn/2π = −2.2 MHz, ω1e/2π = 2.5 MHz; tr = 20–200 ms, 512 points; 16 scans. Random RF acquisition. Temperature values were chosen to satisfy high T approximation. The error bars were estimated from the S/N ratio in the spectra. 34 GHz data were recorded using the set up as shown in Fig. 2. 94 GHz data were recorded using a Bruker E 680 Elexsys spectrometer (Ugrade 2, P = 400 mW) and a cylindrical Bruker EN 680-1021H TeraFlex resonator. | ||
| A 1 | τ 1 (ms) | A 2 | τ 2 (ms) | T 1S (1) (ms) | T 1S (2) (ms) | T 1I (ms) | |
|---|---|---|---|---|---|---|---|
| ν mw = 34 GHz | |||||||
| ENDOR line: +2.5 MHz | +0.88 ± 0.26 | 0.59 | +0.065 ± 0.025 | 50 | 0.6 | 5 | 40 |
| ENDOR line: −2.5 MHz | +0.19 ± 0.06 | 0.59 | −0.084 ± 0.008 | 45 | |||
| ν mw = 94 GHz | |||||||
| ENDOR line: +2.5 MHz | +0.77 ± 0.025 | 15 | +0.18 ± 0.14 | 196 | 3 | 22 | 160 |
| ENDOR line: −2.5 MHz | +0.23 ± 0.02 | 4 | −0.17 ± 0.02 | 172 | |||
The opposite signs for the amplitude coefficients of the slow relaxing component reflect the change in sign of ENDOR lines observed in Fig. 2. To assign the fitted rate values, the electron spin-lattice relaxation time was determined by inversion recovery experiments§ and the nuclear spin-lattice relaxation time T1I of the ENDOR lines at ΔωENDORn = ±2.5 MHz was estimated by monitoring the signal intensity of Davies ENDOR-spectra as a function of the shot repetition time (SI), as proposed by Tyryshkin et al.14 All values are summarized in Table 1. The data indicate that the measured kinetics reflect an interplay of the electronic T1S and nuclear T1I. We observe that at the considered frequencies and temperature, T1I is one order of magnitude larger than T1S.
To rationalize the effect of spin relaxation during the CP ENDOR experiment, we consider relaxation in the electron-nuclear two-spin system introduced in Fig. 1b. The eigenvectors are defined as: |1〉 = |βeαn〉; |2〉 = |βeβn〉; |3〉 = |αeαn〉; |4〉 = |αeβn〉. Since the ENDOR sequence produces a non-Boltzmann distribution of spin populations across the four states, spin relaxation acts during the time evolution of the spin system. For simplicity we neglect relaxation during the pulses and assume that coherences relax very fast after the pulses.17 All possible spin-lattice relaxation pathways are illustrated in Fig. 1b. In the high temperature approximation, which allows us to discuss analytical solutions for 34 GHz down to ∼20 K and for 94 GHz down to ∼50 K, the transition probabilities between a pair of levels i and j are the same in both directions, i.e. wij = wji. The distribution of spin populations can be calculated by solving the master equation according to Solomon24 (SI). Assuming the electron Larmor frequency ω0S to be much larger than the nuclear one, ω0I, and neglecting the nuclear spin Boltzmann polarization, the master equations lead to the following time evolution of the ENDOR lines (ESI†):
 | (1) |
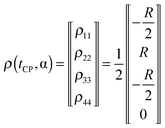 | (2a) |
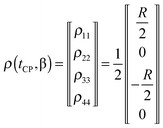 | (2b) |
| S(ENDOR1–2, EPRα) ∼ [ρ11(td) − ρ33(td)]no-RF − [ρ22(td) − ρ33(td)]RF1–2 = ρ11(td) − ρ22(td) |
| S(ENDOR3–4, EPRα) ∼ [ρ11(td) − ρ33(td)]no-RF − [ρ11(td) − ρ44(td)]RF3–4 = ρ44(td) − ρ33(td) | (3) |
For EPR detection of the β transition the ENDOR signal has the same intensity but a reverse sign. Utilizing the matrix elements of eqn (2a) and (3) in eqn (1) we obtain for the ENDOR intensity S during the free evolution td:
 | (4) |
 | (5) |
Experimentally, in a powder pattern we expect to observe the sum of contributions from eqn (4) and (5). Further, residual ENDOR effects caused by the initial mw π/2 and mw spin-lock sequence with unmatched CP also contribute to the total ENDOR intensity.19 Therefore, the amplitudes of the components decaying with TΔ are considerably larger than those decaying with T1I. This is qualitatively consistent with our experimental finding if we compare the fitted amplitudes A1 and A2 of the ENDOR lines at 2.5 MHz (Table 1). However, the most important result concerns the amplitudes A2 for the slow relaxing components. For both frequencies (34 and 94 GHz), the fitted amplitudes A2 are of the same size and opposite signs within one ENDOR spectrum, as expected from spin packets that fulfill eqn (4). This is in agreement with the appearance of the spectrum in Fig. 2b at long delay times. The results demonstrate that for 1/R1I ≫ td ≫ 1/RΔ only polarization from the asymmetric CP-ENDOR spectrum is left and the spectrum becomes completely polarized, according to eqn (4).
Finally, expressions similar to eqn (4) and (5) can be derived for the free evolution of the two-spin spin system during the repetition time tr after the RF π read-out pulse and selective detection by a π/2 mw pulse. We find here again that the decay is bi-exponential, similar to eqn (4), but with a larger amplitude following T1I and a smaller following TΔ. Nevertheless, to rationalize the combined effect of the CP sequence and relaxation during signal averaging far out of the high temperature approximation (T = 5 K), where actually most of the ENDOR experiments are carried out,¶ we performed numerical simulations of the time evolution of the populations in the four level system for the repetition of several shots. We followed the master equation approach developed in ref. 17, in which the rate equations are solved numerically, combined with the analytical expressions for the evolution of populations during CP given in our previous work.19 In Fig. 4, we display the intensities of the ENDOR lines as a function of the ratio tr/T1S for the three cases of ENDOR spectra discussed here (Fig. 1C). During accumulation we find that a steady-state is reached after about 4 shots (Fig. S4, ESI†). The results show that a repetition time on the order of T1S should be sufficient to recover most (up to 80%) of the asymmetric CP-ENDOR spectrum (blue symbols), but it partially saturates the symmetric spectrum (red) to different extents for the two lines. The residual ENDOR effect for non-resonant CP-RF is recovered instead with T1I (green curves).
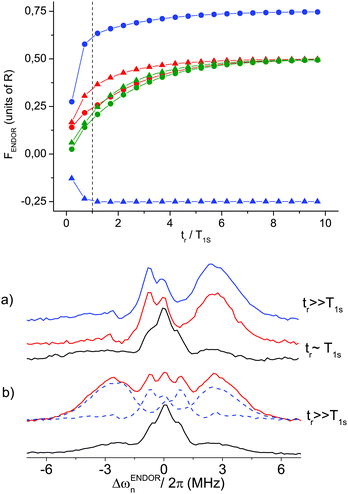 | ||
| Fig. 4 Top: numerical simulations for the intensities of the ENDOR lines 1–2 (dots) and 3–4 (triangles) in the asymmetric CP-ENDOR (blue), the symmetric CP-ENDOR (red) and residual ENDOR (CP with RF off) after repetition of 4 shots. νEPR = 94 GHz, T = 5 K, T1I = T1x = 10·T1S. T1x is 1/Rx or 1/(w2 − w0). Bottom: the W-band 94 GHz Davies ENDOR spectrum (black) and CP-ENDOR spectra (red/blue) of 1H-BDPA under comparable exp. conditions: (a) black/red: 100 shots/point, tr = 100 ms, 1 scan. Blue: random RF acquisition, one shot/point, 100 scans. Acquisition time/spectrum: 17 min. (b) Comparison of spectra under random RF acquisition. CP-spectrum (red) is the sum of two spectra (blue dashes) with opposite polarization profile obtained in two consecutive experiments with ±ΔωCPn. T = 5 K, π/2 mw: 200 ns; tCP = 200 μs, π rf = 25 μs, ΔωCPn/2π = 1.2 MHz. Set up for 94 GHz data as given in caption of Fig. 3. | ||
To examine the situation experimentally, we have recorded CP and Davies ENDOR spectra at low temperatures under comparable experimental conditions. The data are displayed in Fig. 4, bottom. A comparison of spectra for tr ≈ T1Sversus long repetition times tr ≫ T1S (from random RF acquisition) shows that the intensity of the high frequency line (enhanced in CP-ENDOR spectrum) differs by only 30% whereas in the Davies spectrum by 80%. This is in good qualitative agreement with the predictions from the simulations (we remind that the simulations are performed for an isolated 2-spin system). When comparing the line shapes of the CP-ENDOR spectra at tr ≈ T1S and tr ≫ T1S (red and blue in Fig. 4a) no visible change is observed likely due to a counteracting effect of the relaxing components. In random RF acquisition, saturation of Davies ENDOR is alleviated, but only if T1I is on the order of the acquisition time of one spectrum, as is the case here. The overall signal gain SCP/SDavies in the latter case is 5. Finally, Fig. 4 illustrates that the sum of two CP-ENDOR spectra recorded for a positive and negative CP-RF offset completely recovers the Davies ENDOR line shape, but shows a substantial improvement in S/N.
Conclusions
We have demonstrated that the CP ENDOR experiment can be carried out using a repetition time on the order of the electron spin relaxation time in contrast to standard Davies ENDOR, which requires waiting times on the order of the nuclear spin lattice relaxation. These two relaxation times usually differ by at least one order of magnitude, leading to substantial gain in acquisition time in CP-ENDOR. The observed kinetics are qualitatively consistent with rate equations derived from the previous analytical description of the CP-ENDOR experiments for a two spin-system. Because of the faster acquisition time and the considerable gain in S/N, the CP-ENDOR experiment will potentially provide an attractive alternative to standard Davies ENDOR in several applications. Experiments are in progress to examine the performance of CP-ENDOR with low-gamma nuclei and on real samples.Acknowledgements
We are indebted to I. Kaminker and S. Vega for critical reading of the manuscript and donation of their Mathematica codes used to cross check our numerical simulations. We would also like to thank N. Enkin and I. Tkach for discussions. The work was supported by the DFG priority program SPP1601 and the Max Planck Society.Notes and references
- W. B. Mims, Proc. R. Soc. London, Ser. A, 1965, 283, 452 CrossRef CAS.
- E. R. Davies, Phys. Lett. A, 1974, 47, 1 CrossRef CAS.
- C. Gemperle and A. Schweiger, Chem. Rev., 1991, 91, 1481 CrossRef CAS.
- A. Grupp and M. Mehring, in Modern Pulsed and Continuous Wave EPR, ed. L. Kevan and M. Bowmann, Wiley & Sons, 1990, p. 195 Search PubMed.
- (a) T. Argirevic, C. Riplinger, J. Stubbe, F. Neese and M. Bennati, J. Am. Chem. Soc., 2012, 134, 17661 CrossRef CAS PubMed; (b) A. J. Fielding, K. Parey, U. Ermler, S. Scheller, B. Jaun and M. Bennati, J. Biol. Inorg. Chem., 2013, 18, 915 CrossRef PubMed.
- (a) N. Cox, D. A. Pantazis, F. Neese and W. Lubitz, Acc. Chem. Res., 2013, 46(7), 1588 CrossRef CAS PubMed; (b) A. Silakov, E. J. Reijerse, S. P. J. Albracht, E. C. Hatchikian and W. Lubitz, J. Am. Chem. Soc., 2007, 129, 11447 CrossRef CAS PubMed.
- B. M. Hoffman, D. Lukoyanov, D. R. Dean and L. C. Seefeldt, Acc. Chem. Res., 2013, 46(2), 587–595 CrossRef CAS PubMed.
- I. Kaminker, A. Sushenko, A. Potapov, S. Daube, B. Akabayov, I. Sagi and D. Goldfarb, J. Am. Chem. Soc., 2011, 133, 15514 CrossRef CAS PubMed.
- C. Novara, A. Alfayate, G. Berlier, S. Maurelli and M. Chiesa, Phys. Chem. Chem. Phys., 2013, 15, 11099 RSC.
- M. M. Mehring, J. Mende and W. Scherer, Phys. Rev. Lett., 2003, 90, 153001 CrossRef CAS.
- G. W. Morley, M. Warner, A. M. Stoneham, P. T. Greenland, J. van Tol, C. W. M. Kay and G. Aeppli, Nat. Mater., 2010, 9, 725 CrossRef CAS PubMed.
- J. J. L. Morton, A. M. Tyryshkin, A. Ardavan, S. C. Benjamin, K. Porfyrakis, S. A. Lyon and G. A. D. Briggs, Nat. Phys., 2006, 2, 40 CrossRef CAS.
- S. B. Simmons, R. M. Brown, H. Riemann, N. V. Abrosimov, P. Becker, H. Pohl, M. L. W. Thewalt, K. M. Itoh and J. J. L. Morton, Nature, 2011, 470, 69 CrossRef CAS PubMed.
- A. M. Tyryshkin, J. J. L. Morton, A. Ardavan and S. A. Lyon, J. Chem. Phys., 2006, 124, 234508 CrossRef PubMed.
- J. J. L. Morton, N. S. Lees, B. M. Hoffman and S. Stoll, J. Magn. Reson., 2008, 191, 315 CrossRef CAS PubMed.
- M. T. Bennebroek and J. Schmidt, J. Magn. Reson., 1997, 128, 199 CrossRef CAS.
- B. Epel, A. Pöppl, P. Manikandan, S. Vega and D. Goldfarb, J. Magn. Reson., 2001, 148, 388 CrossRef CAS PubMed.
- T. Yang and B. M. Hoffman, J. Magn. Reson., 2006, 181, 280 CrossRef CAS PubMed.
- R. Rizzato, I. Kaminker, S. Vega and M. Bennati, Mol. Phys., 2013, 111, 2809 CrossRef CAS.
- V. Weis, M. Bennati, M. Rosay and R. G. Griffin, J. Chem. Phys., 2000, 113, 6795 CrossRef CAS PubMed.
- V. Weis and R. G. Griffin, Solid State Nucl. Magn. Reson., 2006, 29, 105 CrossRef PubMed.
- N. Pomplun, B. Heitmann, N. Khaneja and S. J. Glaser, Appl. Magn. Reson., 2008, 34, 331 CrossRef CAS.
- G. Jeschke, Chem. Phys. Lett., 1999, 301, 524 CrossRef CAS.
- I. Solomon, Phys. Rev., 1955, 99, 559 CrossRef CAS.
Footnotes |
| † Electronic supplementary information (ESI) available: Master equations in high temperature approximation; measurement of T1I; global fits of kinetic curves at 94 GHz; and ENDOR intensities as a function of the number of shots. See DOI: 10.1039/c3cp55395g |
| ‡ A similar effect was reported in ref. 21 but no quantitative analysis was performed. |
| § The two values of T1S reflect the bi-exponential inversion recovery curve. The fastest component is attributed to spectral diffusion due to selective excitation in the inhomogeneous EPR line. |
| ¶ Usually, the choice of low temperatures in real samples is dictated by the low intensity of the EPR signals. Particularly in proteins, radical yields are on the order of a few μM, which is at the lowest edge of sensitivity for Davies ENDOR. We note that the BDPA sample, as a model system, does not require low temperatures for ENDOR and the relaxation/saturation issue is alleviated at room temperature. However, we employ here the low temperatures to reproduce the relaxation behaviour and issues of organic radicals in real samples. |
| This journal is © the Owner Societies 2014 |

