 Open Access Article
 This Open Access Article is licensed under a
 Creative Commons Attribution 3.0 Unported Licence
Structure, ligands and substrate coordination of the oxygen-evolving complex of photosystem II in the S2 state: a combined EPR and DFT study†
Thomas
Lohmiller
a,
Vera
Krewald
a,
Montserrat Pérez
Navarro
a,
Marius
Retegan
a,
Leonid
Rapatskiy
a,
Marc M.
Nowaczyk
b,
Alain
Boussac
c,
Frank
Neese
a,
Wolfgang
Lubitz
a,
Dimitrios A.
Pantazis
*a and
Nicholas
Cox
*a
aMax-Planck-Institut für Chemische Energiekonversion, Stiftstrasse 34-36, D-45470 Mülheim an der Ruhr, Germany. E-mail: dimitrios.pantazis@cec.mpg.de; nicholas.cox@cec.mpg.de; Fax: +49 208 306 3955; Tel: +49 208 306 3552
bRuhr-University Bochum, Universitätsstrasse 150, D-44780 Bochum, Germany
ciBiTec-S, SB2SM, UMR 8221, CEA Saclay, 91191 Gif-sur-Yvette, France
First published on 31st January 2014
Abstract
The S2 state of the oxygen-evolving complex of photosystem II, which consists of a Mn4O5Ca cofactor, is EPR-active, typically displaying a multiline signal, which arises from a ground spin state of total spin ST = 1/2. The precise appearance of the signal varies amongst different photosynthetic species, preparation and solvent conditions/compositions. Over the past five years, using the model species Thermosynechococcus elongatus, we have examined modifications that induce changes in the multiline signal, i.e. Ca2+/Sr2+-substitution and the binding of ammonia, to ascertain how structural perturbations of the cluster are reflected in its magnetic/electronic properties. This refined analysis, which now includes high-field (W-band) data, demonstrates that the electronic structure of the S2 state is essentially invariant to these modifications. This assessment is based on spectroscopies that examine the metal centres themselves (EPR, 55Mn-ENDOR) and their first coordination sphere ligands (14N/15N- and 17O-ESEEM, -HYSCORE and -EDNMR). In addition, extended quantum mechanical models from broken-symmetry DFT now reproduce all EPR, 55Mn and 14N experimental magnetic observables, with the inclusion of second coordination sphere ligands being crucial for accurately describing the interaction of NH3 with the Mn tetramer. These results support a mechanism of multiline heterogeneity reported for species differences and the effect of methanol [Biochim. Biophys. Acta, Bioenerg., 2011, 1807, 829], involving small changes in the magnetic connectivity of the solvent accessible outer MnA4 to the cuboidal unit Mn3O3Ca, resulting in predictable changes of the measured effective 55Mn hyperfine tensors. Sr2+ and NH3 replacement both affect the observed 17O-EDNMR signal envelope supporting the assignment of O5 as the exchangeable μ-oxo bridge and it acting as the first site of substrate inclusion.
1 Introduction
In oxygenic photosynthesis, light-driven water oxidation is catalysed by the oxygen-evolving complex (OEC) of the transmembrane protein complex photosystem II (PSII). The OEC consists of a μ-oxo-bridged tetramanganese-calcium cofactor (Mn4O5Ca), embedded in its protein matrix. This matrix includes the redox-active tyrosine residue YZ (D1-Tyr161), which couples electron transfer between the Mn4O5Ca cluster and P680˙+, the photooxidant of the PSII reaction centre. The four-electron water oxidation reaction requires four consecutive light-induced charge separation events, driving the catalytic cycle of the OEC.1,2 This cycle involves five redox intermediates, the Sn states, where n = 0–4 indicates the number of stored oxidizing equivalents. All S-state transitions represent oxidations of the Mn4O5Ca cluster by YZ˙ with the exception of the regeneration of S0 from S4, which proceeds spontaneously under the release of molecular triplet oxygen and the rebinding of at least one substrate water molecule. The rate-limiting step, oxidation of S3 by YZ˙, has prevented the transient, fast-decaying S4 state from being characterized yet. For a general introduction into water oxidation by the OEC, see ref. 3–8.The structure of the Mn4O5Ca inorganic core9 resembles a ‘distorted chair’ where the base is formed by a μ-oxo-bridged cuboidal Mn3O4Ca unit (Fig. 1), while the fourth, ‘outer’ Mn, MnA4 is attached to this core structure via two μ-oxo bridges, O4 and O5. Spectroscopic evidence suggests that all five oxygen bridges are deprotonated in the S2 state.10–15 In addition to the μ-oxo-bridged network, the Mn4O5Ca scaffold is held together by six carboxylate ligands, four of which (D1-Asp342, D1-Asp170, D1-Glu333 and CP47-Glu354) form μ-carboxylato bridges between Mn sites. The cluster has only one immediate nitrogen ligand, the imidazole imino-N of D1-His332.
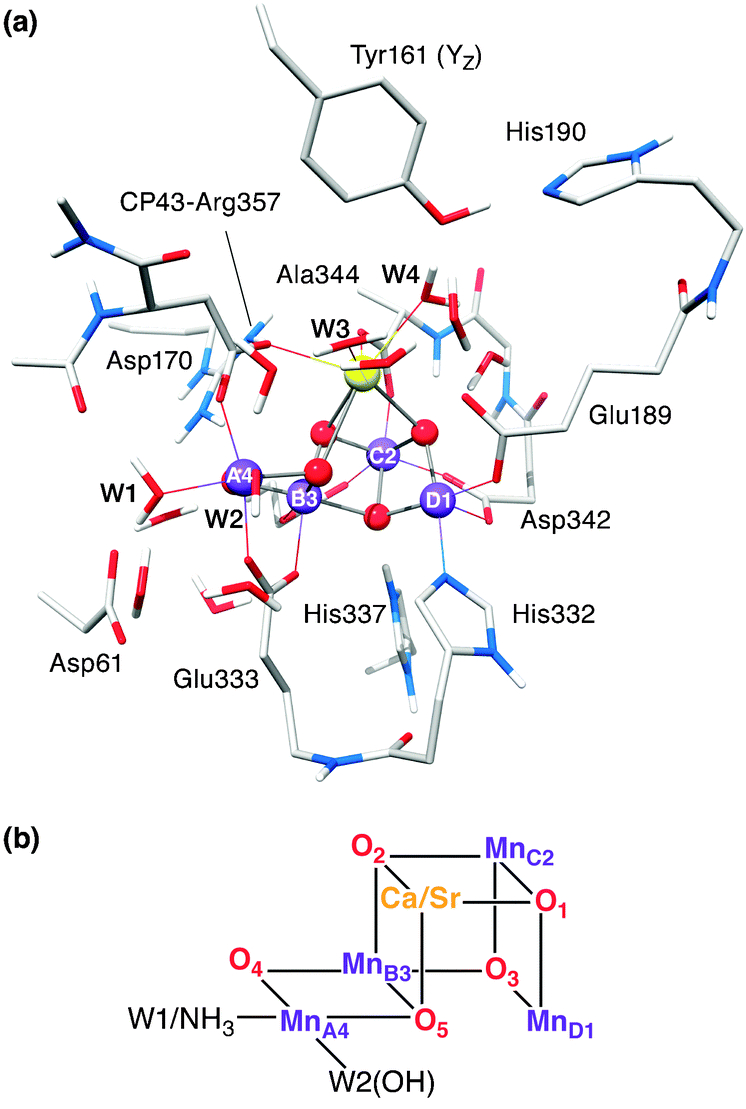 | ||
| Fig. 1 (a) DFT cluster model of the native OEC and its immediate surrounding in the S2 (ST = 1/2) state. Mn ions are depicted in purple, O in red, Ca in yellow, C in light grey, N in blue and H in white; most H atoms are omitted for clarity. (b) Mn4O5Ca/Sr–H2O/NH3 cores showing the atom and ligand labels used in this work. | ||
An understanding of the mechanism of water oxidation catalysis is intimately linked to an understanding of the electronic states of the paramagnetic tetranuclear Mn complex. Electron paramagnetic resonance (EPR) spectroscopy represents a powerful methodology in this endeavour.16–19 The S2 state, being readily generated from the dark-stable S1 state, is the most extensively characterized S state by EPR. It is intrinsically heterogeneous,20–22 existing in two ground state configurations. The lowest energy form exhibits a ground state of total spin ST = 1/2. This spin configuration gives rise to the well-known S2 state EPR multiline signal centred at g ≈ 2.0, with a hyperfine pattern of at least 24 peaks, with a line spacing around 87 G.23 Depending on the conditions used, the S2 state can also exhibit other broad EPR signals, centred at g ≥ 4.1, which have been assigned to (an) ST ≥ 5/2 spin state(s).20,24–28 The g ≥ 4.1 signal can also be induced by near-infrared illumination of the S2 multiline state at temperatures ≤160 K.24,25,29 Pulse electron nuclear double resonance (ENDOR) experiments,30 especially at Q-band frequencies,31–34 have enabled a more detailed examination of the electronic structure by uniquely determining four 55Mn hyperfine interactions that give rise to the multiline pattern of the corresponding ST = 1/2 EPR signal. This ENDOR analysis has strongly suggested that the OEC contains one MnIII ion and three MnIV ions when poised in the S2 state.30–34
OEC models developed from broken-symmetry (BS) density functional theory (DFT) have been crucial for the interpretation of EPR and related magnetic resonance results.12,14,18,33,35–44 These calculations now allow different S-state models to be assessed based on the spin multiplicities and relative energies of their lowest magnetic levels, and, by means of the spin projection formalism (see ref. 18 and 36), the metal and ligand hyperfine couplings. This strategy enables the assignment of individual Mn oxidation states and coordination geometries and represents a method to develop unified models of the OEC that combine constraints from X-ray diffraction, EXAFS and magnetic resonance.
Site perturbation of the OEC provides a means to further characterize the global geometric and electronic structure of the Mn tetramer and obtain information about localized changes associated with the introduced modification. The two best described OEC perturbations in the literature are (i) the replacement of the Ca2+ with a Sr2+ ion33,45–47 and (ii) the binding of NH3 to the cluster.48–55 Both of these perturbations do not inhibit functional turnover of the catalyst, but do modify the kinetics of O–O bond formation, substrate water uptake and its subsequent deprotonation. A brief description of these two modified OEC forms is given below:
(i) Sr2+ can be introduced into the OEC through chemical removal of the Ca2+ ion45,46,56 or alternatively by biosynthetic incorporation in cyanobacterial cultures grown in the presence of SrCl2 instead of CaCl2.47 Without Ca2+ (or Sr2+) the OEC is inhibited,56–63 not progressing further than a modified form of the S2 state, i.e. the S2′YZ˙ state.60–62 Sr2+ is unique as it is the only ion which can replace the Ca2+ ion while retaining catalytic activity, albeit at a lower enzymatic rate.45,47,56 Presumably this is because Sr2+ has a similar size and Lewis acidity as Ca2+.64 While slowing the turnover rate of the catalyst, Sr2+ substitution at the same time enhances the exchange rate with bulk water of at least one of the bound substrates,65,66 as observed by time-resolved membrane inlet mass spectrometry (MIMS).67,68 This behaviour suggests the Ca2+ ion may play an important role in substrate water binding and possibly proton release (for reviews, see ref. 3 and 69).
(ii) Ammonia binding to the Mn cluster (in the presence of high Cl− concentrations)48,50,51,54 only occurs upon formation of the S2 state. It is subsequently released at some point during the S-state cycle (S3 → S0 → S1), such that it is not bound upon return to S1.51 As with Sr2+ replacement, NH3 binding does not inhibit catalytic function. In the higher plant electron spin echo envelope modulation (ESEEM) study of Britt et al.,70 NH3 was shown to bind as a direct ligand of the Mn tetramer. The precise binding site and coordination mode of the NH3 molecule was the subject of a recent study on cyanobacterial PSII from our laboratory.44 By employing electron electron double resonance (ELDOR)-detected NMR (EDNMR), it was concluded that NH3 replaces the water ligand of MnA4trans to the O5 bridge (W1, Fig. 1b). As the binding of NH3 was also shown not to affect substrate exchange rates, these results suggest W1 does not represent a substrate water. One or more additional NH3 binding sites, which are inhibitory, are known but are less well characterized.49,50,71
Here, we present an extension of our earlier multifrequency EPR studies33,34,44 of different ‘archetypal’ multiline forms, namely the native (Mn4O5Ca), Sr2+ substituted (Mn4O5Sr) and NH3-treated (Mn4O5Ca–NH3) S2 states, providing a comprehensive analysis of all present X-, Q- and W-band data of 55Mn, 14N/15N and 17O signals and for the first time including additional data on the doubly modified (Mn4O5Sr–NH3) S2 state. Improved 55Mn ENDOR experimental conditions provide more reliable spectral line shapes than before, confirming our previous general S2 state model. Extended BS-DFT models are shown to reproduce all EPR, 55Mn and 14N magnetic spectroscopic observables for the native and the modified systems, a feature not achieved previously. The experimental results and calculations for 14N/15N ligands of the various S2 state forms serve to prove that the basic electronic structure is not perturbed by these modifications, a result crucial for the interpretation of concomitant perturbations of the 17O EDNMR signal envelope. This combined experimental and theoretical approach supports our qualitative model for multiline heterogeneity, demonstrating that the magnetic connectivity between the two subunits and also within the trimeric moiety governs the structure of the multiline signal.34 This basic structural template also explains the apparent orientations of the 55Mn hyperfine tensors, as inferred from spectral simulations and single crystal measurements,32 and potentially provides a framework to further examine substrate binding. The different OEC forms represent a starting point to examine the energetics of higher S-state transitions, as they differ with regard to substrate binding and the kinetics of O–O bond formation and O2 release.
2 Materials and methods
2.1 PSII sample preparation
Ca2+- and Sr2+-containing PSII core complex preparations from T. elongatus72 were isolated as reported before47,73,74 with the same modifications for the X-band samples as described in ref. 44. Universal 15N-labelling of the PSII proteins was achieved by growing the cyanobacteria in a modified BG11 or DTN medium that contained 15NH4Cl and 15NO3− salts as the sole nitrogen source.75 PSII preparations were stored at −80 °C until use. Dark-adapted samples were placed in X-, Q- or W-band quartz tubes with inner diameters of 3.0, 1.6 and 0.6 mm, respectively, and kept at 77 K (liquid N2) until use. A sample concentration of 3.0–4.0 mg chlorophyll per ml was used throughout this study. All work was conducted in the dark or under dim green light. NH3 modification was conducted as described in ref. 44, see also Section S1 of the ESI.† Isotopically enriched H217O buffer exchange was achieved as described in ref. 14.2.2 X-, Q-, and W-band EPR and ENDOR measurements
X-band (≈9 GHz) continuous-wave (CW) EPR spectra were recorded at liquid He temperatures on a Bruker ELEXSYS E500 spectrometer, equipped with an ESR 900 liquid helium flow cryostat and an ITC503 helium flow temperature controller (Oxford Instruments Ltd). X-band pulse EPR measurements were carried out at 4.3 K using a Bruker ELEXSYS E580 spectrometer, equipped with a CF935 cryostat and an ITC503 temperature controller. Q-band (≈34 GHz) pulse EPR measurements were performed around 5 K using an ELEXSYS E580 spectrometer, equipped with a homebuilt TE011 microwave cavity,76 a CF935 liquid helium cryostat, an ITC-503 temperature controller and a radiofrequency (RF) amplifier ENI 5100L. W-band (≈94 GHz) EPR experiments were performed at 4.8 K using a Bruker ELEXSYS E680 EPR spectrometer. All W-band experiments were carried out using a homebuilt ENDOR microwave cavity, which contained a solenoid of Teflon coated silver wire integrated into a commercial ENDOR probe head (Bruker). In order to ensure broadband microwave excitation and minimize distortions, the loaded quality factor QL was lowered to 700 to obtain a microwave frequency bandwidth of 130 MHz.Electron spin echo-detected (ESE) field-swept EPR spectra were measured using the pulse sequence tp–τ–2tp–τ–echo,77 three-pulse ESEEM spectra by use of tp–τ–tp–T–tp–τ–echo78 and hyperfine sublevel correlation (HYSCORE) spectra by employing tp–τ–tp–T1–2tp–T2–tp–τ–echo.79 The lengths of the π/2 microwave pulses were generally set to tp = 16 ns (X-band), 12 ns (Q-band) and 24 ns (W-band), respectively. For ESE-detected EPR experiments, inter-pulse distances were τ = 260 ns (Q-band) and 300 ns (W-band). For the three-pulse ESEEM measurements, multiple τ values in the ranges τ = 136–248 ns (X-band) and 200–356 ns (Q-band) and an optimum τ = 260 ns for the HYSCORE experiments were chosen to account for blind-spotting artefacts. Q-band 55Mn-ENDOR spectra were acquired employing the Davies-type pulse sequence tinv–tRF–T–tp–τ–2tp–τ–echo80 using a length tinv = 24 ns for the π inversion microwave pulse and a radio frequency π pulse length tRF = 3.5 μs. The length of the π/2 microwave pulse in the detection sequence was generally set to tp = 12 ns and the inter-pulse delays to T = 2 μs and τ = 268 ns. A shot repetition time of 1 ms was used for all measurements. EDNMR measurements were collected using the pulse sequence tHTA–T–tp–τ–2tp–τ–echo.81 The high turning angle (HTA) microwave pulse was applied at microwave frequencies νmw. The Hahn echo detection pulse sequence tp–τ–2tp–τ–echo, at a microwave frequency ν(0)mw matched to the cavity resonance, was set at a sufficient time T after the HTA pulse to ensure near-complete decay of the electron spin coherencies. The π/2 pulse length used for detection was tp = 200 ns (14N, 17O) or 80 ns (15N) and an inter-pulse separation of τ = 500 ns was used. The echo was integrated ≈600 ns around its maximum. The spectra were acquired via continuously sweeping the HTA frequency νmw at a fixed magnetic field in steps of 78.1 kHz (14N), 128.9 kHz (15N) or 162.1 kHz (17O). A HTA microwave pulse of length tHTA = 14 μs (14N, 17O) and 8 μs (15N) and an amplitude ω1 = 12–16 × 106 rad s−1 was used.
2.3 Spectral simulations
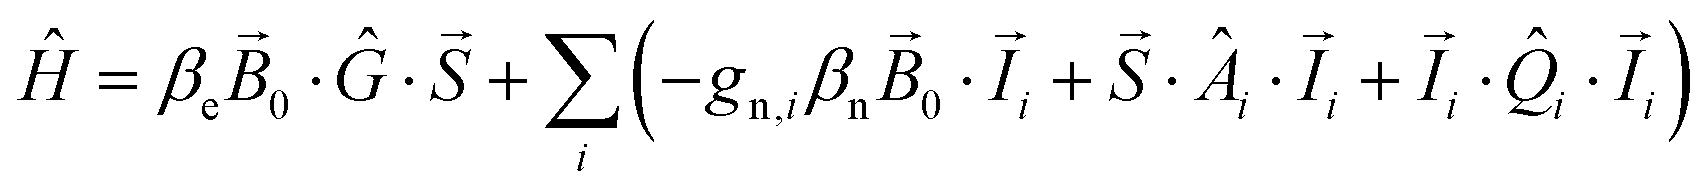
Spectra were fit assuming an effective spin ST = 1/2 ground state (Section S4.2, ESI†). The basis set that describes the 55Mn tetramer-single electron spin manifold (eqn (1)) and the 14N, 15N and 17O single nucleus-single electron spin manifolds (eqn (2)) can be built from the product of the eigenstates of the interacting spins:| |½MI1m1I2m2I3m3I4m4〉 | (1) |
| |½MIm〉 | (2) |
 | (3) |
2.4 DFT calculations
All calculations were performed with ORCA.83 The DFT models of the OEC systems consist of 238 or 239 atoms (with H2O or NH3 at the W1 position, respectively) and were constructed as described in Pantazis et al.40 Alternative ammonia binding modes, including terminal or bridging amido and imido substitution, can be rejected on energetic grounds alone (see Fig. S2, ESI†). Geometry optimizations of the cluster models used the BP86 density functional84,85 with the zeroth-order regular approximation (ZORA)86–88 and specially adapted segmented all-electron relativistically recontracted basis sets89 (ZORA-TZVP for Mn, O and N; ZORA-SVP for C and H). The conductor-like screening model (COSMO)90 was used with a dielectric constant ε = 8.0. D3 dispersion corrections91 were applied in all calculations. Exchange coupling constants, assuming an isotropic Heisenberg Hamiltonian of the form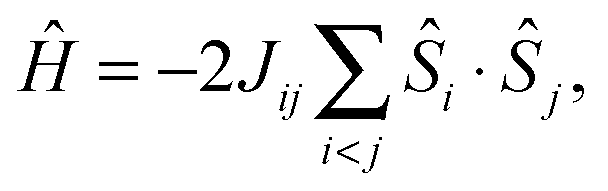 | (4) |
For the calculation of the hyperfine tensors, triple-zeta ZORA-recontracted basis sets were used on all atoms, while locally dense radial grids were used for Mn, N and O atoms (integration accuracy of 11 for Mn and 9 for N and O as per ORCA nomenclature). Picture change effects were applied for the calculation of EPR parameters and the complete mean-field approach was used for the spin–orbit coupling operator. The results were transformed into on-site or spin-projected values as detailed previously.36 To compare computed 55Mn hyperfine coupling constants using the methods described above with experimental results, a scaling factor of 1.78 was calculated from a set of twelve MnIIIMnIV mixed-valence dimers.102
3 Results and discussion
3.1 DFT models of different OEC forms in the S2 state
Geometric parameters of optimized DFT cluster models of the S2 state of the OEC in the ST = 1/2 configuration40 are shown in Fig. 2 (for coordinates, see Section S5, ESI†). Four variants were considered in this study: (i) the native cofactor system (Mn4O5Ca, also see Fig. 1), (ii) the Sr2+-substituted system obtained by replacing Ca2+ with Sr2+ (Mn4O5Sr), (iii) the NH3-modified system obtained by replacing the H2O in the W1 position with NH3 (Mn4O5Ca–NH3), and (iv) the combined Sr2+-substituted and NH3-modified system (Mn4O5Sr–NH3). In all models, W2 was considered to be an OH− ligand, as determined previously.12 Mulliken spin population analysis of all four variants confirms that the only MnIII ion of the tetramanganese complex is MnD1. The three MnIV ions (MnA4, MnB3 and MnC2) represent coordinatively saturated, 6-coordinate octahedral sites, whereas the MnD1III is 5-coordinate square-pyramidal, with a Jahn–Teller elongation along the axis of the MnD1-Asp342 carboxylate ligand, opposite to its open coordination site.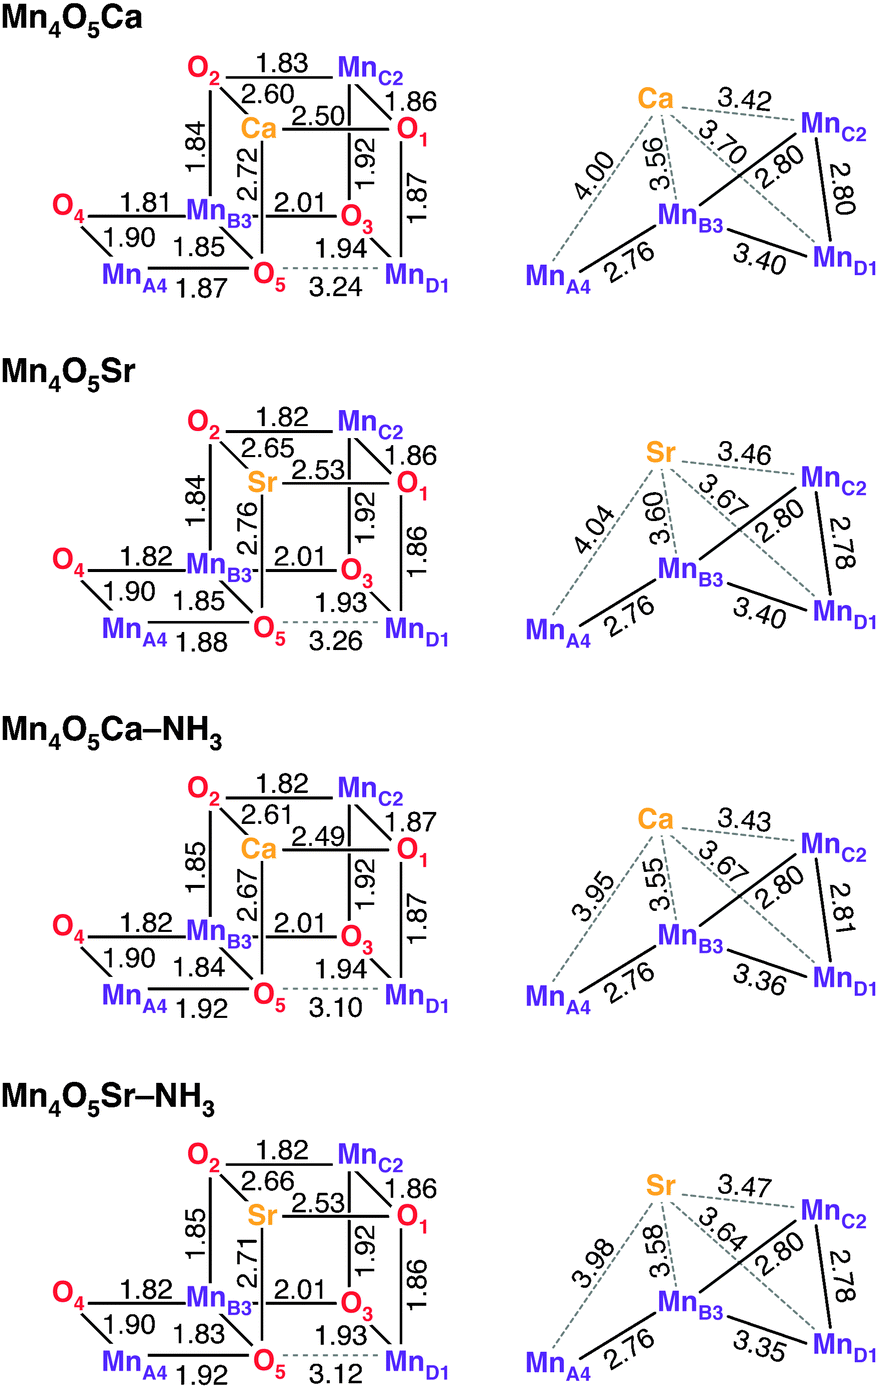 | ||
| Fig. 2 Bond lengths and metal–metal distances in Å of the four geometry-optimized DFT models. | ||
In accordance with previous DFT and QM/MM structures,12,37,38,40–42,103–106 the optimized Mn–Mn and Mn–Ca distances of the Mn4O5Ca model are consistent with those determined from EXAFS spectroscopy.107–110 Only minor changes are observed between the Mn4O5Ca and the Mn4O5Sr models (Fig. 2). As a result of the larger radius of Sr2+, the O–Sr bond lengths increase by 0.04 Å, while the Mn–Sr distances also increase by 0.04 Å except for MnD1–Sr, which is 0.03 Å shorter than the MnD1–Ca distance. On average, this is in line with observations from EXAFS spectroscopy108 and with the recent 2.1 Å resolution crystallographic model of Sr2+-substituted PSII.111 The Mn–Mn distances are almost entirely unaffected, with the exception of MnD1–MnC2, which is shortened by 0.02 Å in the Mn4O5Sr model.
Upon NH3 substitution of W1 (Mn4O5Ca–NH3), only the MnD1–MnB3 distance and the Ca2+ distance from the terminal Mn ions change notably, albeit by less than 0.05 Å (Fig. 2). Only one structural element is more significantly perturbed, i.e. the position of O5, the μ-oxo bridge trans to the binding position of NH3. The MnA4–O5 distance increases by 0.05 Å with concomitant decrease of the MnD1–O5 distance by 0.14 Å. Other ligands of MnA4, such as the second water-derived ligand, W2, remain unaffected. A similar modification to the connectivity of the Mn4O5 core was seen for the smaller OEC models reported in our previous study.44 We note that EXAFS data for the NH3-modified OEC have only been reported for samples purified from spinach, not from the cyanobacterial model systems T. elongatus/vulcanus, and suggested an elongation of one of the short Mn–Mn distances of 0.02 Å.113 This type of perturbation is not observed in our optimized Mn4O5Ca–NH3 model. The structural model including both Sr2+ and NH3 (Mn4O5Sr–NH3) is found to replicate both effects seen in the singly modified structures.
3.2 Multifrequency EPR and 55Mn-ENDOR of the S2 states of the OEC variants
Multifrequency EPR/55Mn-ENDOR experiments spanning the microwave range from ≈9 to ≈90 GHz were employed to experimentally characterize the electronic structures of the different S2 state forms described above. Fig. 3A (black solid traces) depicts X-band CW EPR spectra of the S2 state of native PSII (Mn4O5Ca),33 Sr2+-substituted PSII (Mn4O5Sr),33 NH3-modified (annealed) native PSII (Mn4O5Ca–NH3)44 and NH3-modified Sr2+-substituted PSII (Mn4O5Sr–NH3). Shown are light-minus-dark spectra, generated by taking the difference between the illuminated spectrum (S2) and the dark-state spectrum (S1) in order to remove background signals, such as from the cytochromes b559 and c550. The modified multiline (Mn4O5Sr, Mn4O5Ca–NH3) displays 26 lines of altered intensity as compared to the native multiline signal with 24 lines. The Mn4O5Sr–NH3 S2 state yields essentially the same modified multiline signal; the simulation superimposing this data trace uses the parameters that fit the Mn4O5Sr dataset.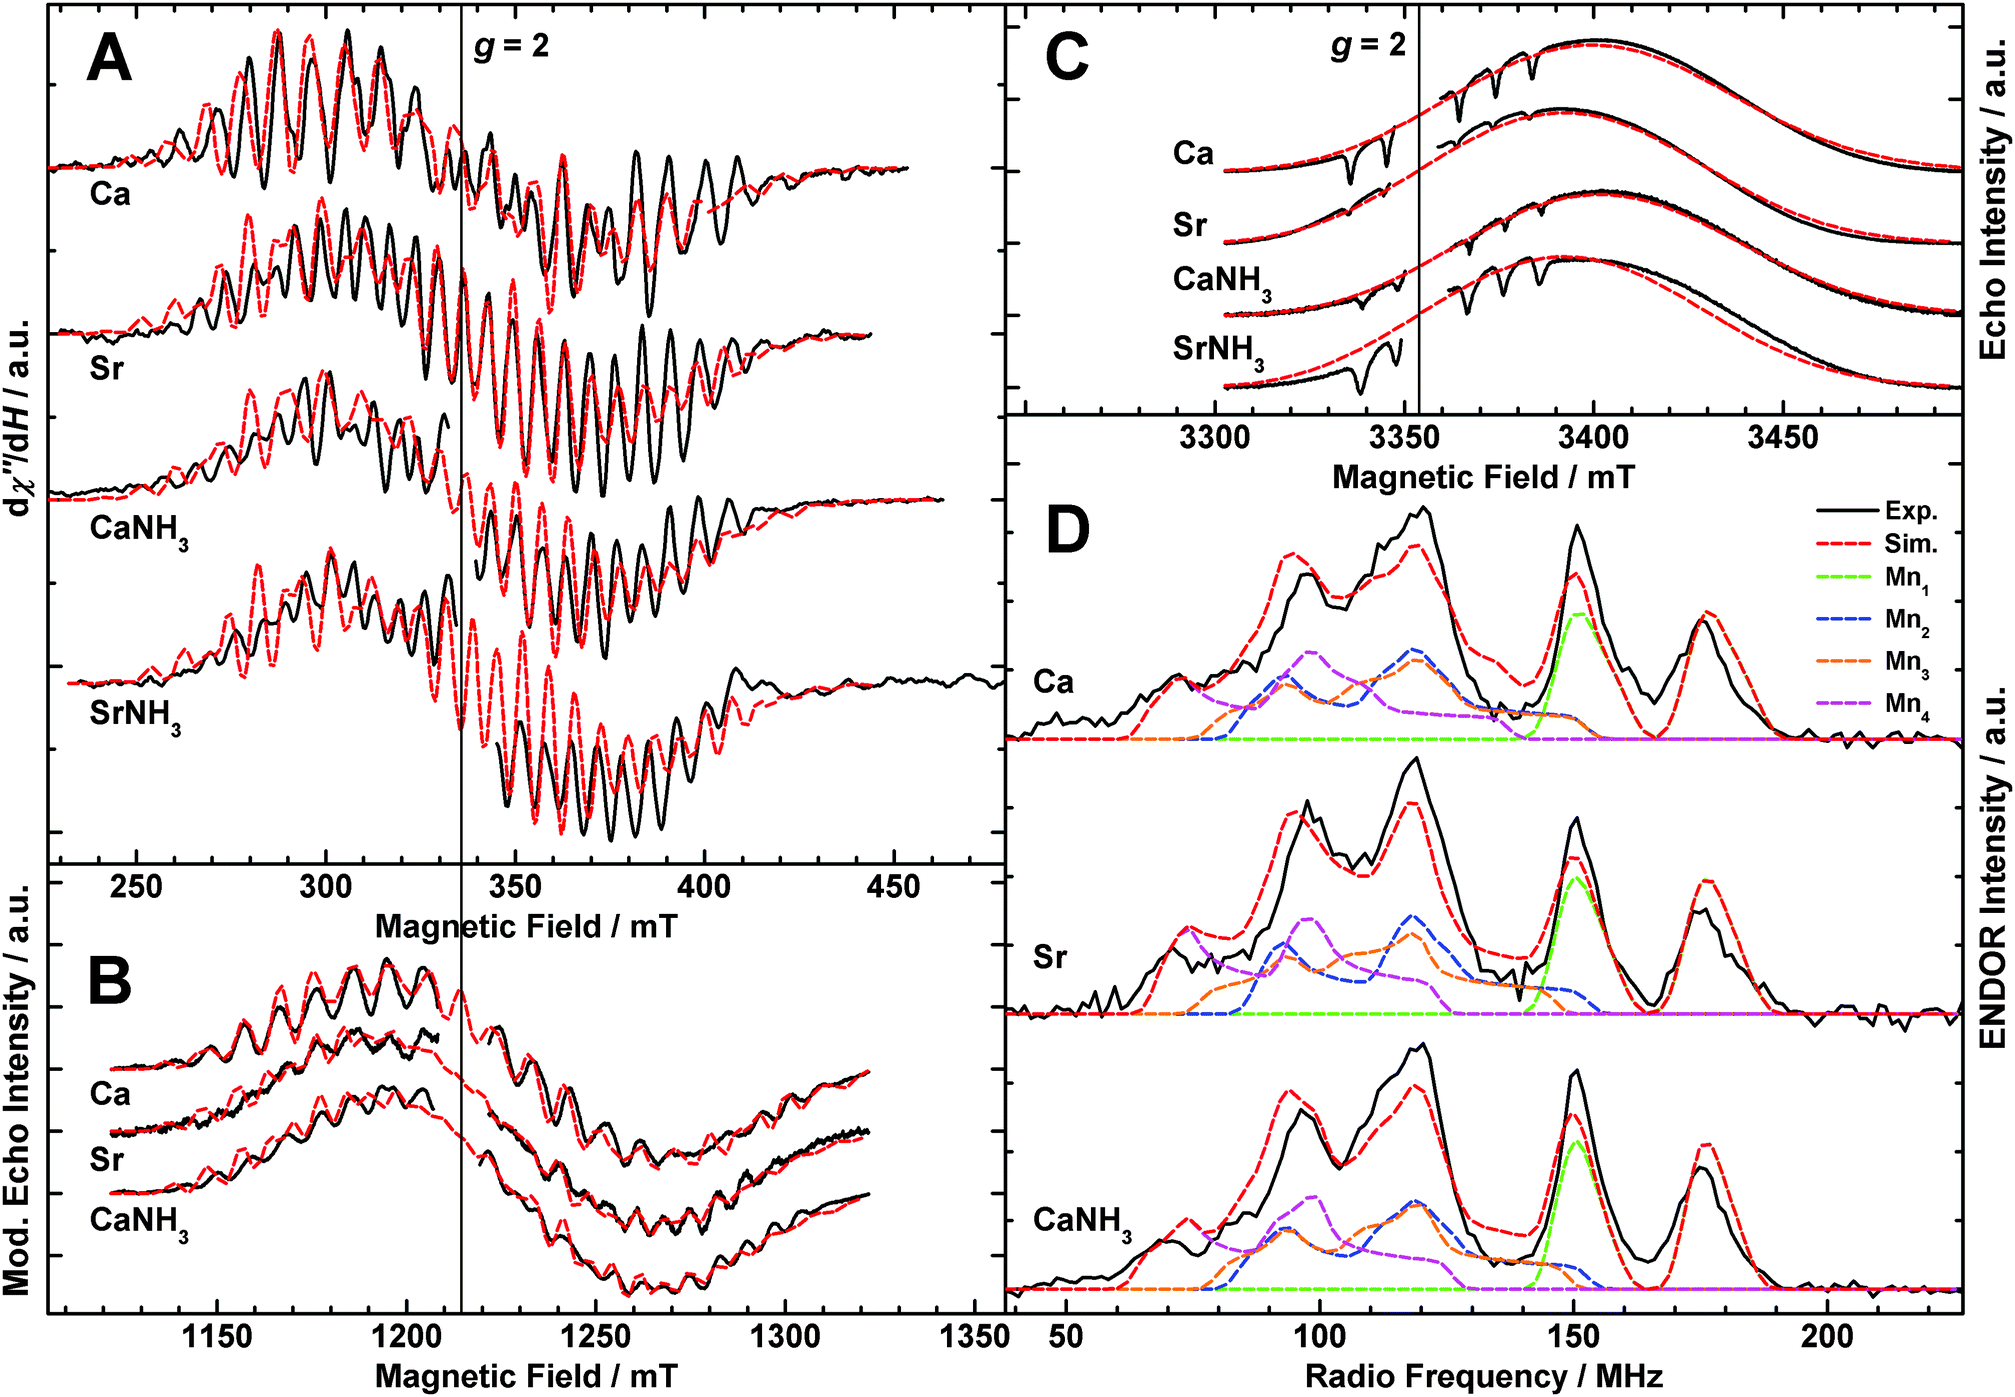 | ||
| Fig. 3 EPR and 55Mn-ENDOR spectra of the S2 states of the native (Ca), Sr2+-substituted (Sr), NH3-modified (CaNH3) and NH3-modified Sr2+-substituted (SrNH3) OEC in PSII isolated from T. elongatus. In panels A, B and D, the black solid traces depict the light-minus-dark subtractions of the experimental spectra. If present, the g ≈ 2 radical signal of YD˙ (D2-Tyr160) was removed from the EPR spectra for clarity of presentation. Least-squares fittings to the EPR and 55Mn-ENDOR datasets using a model based on the spin Hamiltonian formalism (see Section 2.3 and Sections S3 and S4, ESI†) are represented by superimposing red dashed lines. In panel D, coloured dashed lines represent a decomposition of the simulation showing contributions from the individual 55Mn nuclei. Simulations superimposed on the SrNH3 spectra are those fitted to the Sr dataset. The optimized parameter sets are listed in Table 1. (A) X-band CW EPR. In the Ca and Sr samples, YD had been replaced by a phenylalanine, removing the YD˙ signal from the spectra,112 which were taken from Cox et al.33 The CaNH3 spectrum was originally published in ref. 44. Experimental parameters: microwave frequencies: 9.4097 GHz (Ca), 9.4213 GHz (Sr), 9.4075 GHz (CaNH3), 9.4970 GHz (SrNH3); microwave power: 20 mW; modulation amplitude: 25 G; time constant: 82 ms; temperature: 8.6 K. (B) Q-band ESE-detected EPR. The experimental data are presented as pseudo-modulated, derivative-shaped spectra. Experimental parameters: microwave frequencies: 34.0368 GHz (Ca), 34.0430 GHz (Sr), 34.0162 GHz (CaNH3); shot repetition time: 1 ms; microwave pulse length (π): 24 ns; τ: 260 ns; temperature: 5.2 K. (C) W-band ESE-detected EPR. Contaminating Mn2+, present in the samples in varying concentrations, is evident as over-rotated hyperfine features of negative signal intensity. Experimental parameters: microwave frequencies: 93.9894 GHz (Ca), 93.9781 GHz (Sr), 94.0669 GHz (CaNH3), 94.0615 GHz (SrNH3); shot repetition time: 1 ms (Ca, Sr), 5 ms (CaNH3, SrNH3); microwave pulse length (π): 48 ns; τ: 300 ns; temperature: 4.8 K. (D) Q-band Davies ENDOR. Experimental parameters: microwave frequencies: 33.9678 GHz (Ca), 33.9950 GHz (Sr), 34.0053 GHz (CaNH3); magnetic field: 1220 mT; shot repetition time: 1 ms; microwave pulse length (π): 32 ns; τ: 268 ns; RF pulse length (πRF): 3.5 μs; temperature: 4.8 K. | ||
Fig. 3B shows the corresponding Q-band ESE-detected S2 state multiline EPR signals of the Mn4O5Ca, Mn4O5Sr and Mn4O5Ca–NH3 OEC forms. Pseudo-modulated (CW-like) spectra are shown in order to more clearly visualize differences in the hyperfine structures between the three forms. Compared to earlier published data by Cox et al.,33 the spectra are essentially free of contaminating hexaquo-Mn2+ signals. Furthermore, there is a small difference of the centre positions of the multiline spectral envelopes, presumably due to inaccuracy in the microwave frequency calibration of this earlier study.
Fig. 3C shows the W-band ESE-detected multiline signals of the Mn4O5Ca, Mn4O5Sr, Mn4O5Ca–NH3 and Mn4O5Ca–NH3 S2 state forms. These spectra do contain small hexaquo-Mn2+ contaminations. This contamination manifests itself as six inverted hyperfine lines centred at g ≈ 2, as the high-spin Mn2+ signal (S = 5/2) is over-rotated when using optimal instrumental settings to visualize the S = 1/2 multiline signal. No 55Mn hyperfine structure is observable in the W-band multiline EPR spectra. Thus, these signals provide no additional information on the hyperfine matrices. The utility of these high-frequency data instead is to constrain the G tensor. While the spectra of the Mn4O5Ca and the Mn4O5Ca–NH3 cluster show similar signals, centred at g = 1.975, the Mn4O5Sr spectrum is shifted to higher field and centred at g = 1.980, similar to the shift observed in W-band spectra from the Bittl laboratory.114 The NH3-modified Sr2+-substituted S2 state signal is centred at g = 1.979. The almost identical high-field shift, illustrated by the superimposed Mn4O5Sr simulation, indicates that the G-tensor shift is dependent only on the presence of Sr2+ but not NH3. This is in contrast to the result at X-band, which showed that the hyperfine structure is approximately the same for both modifications.
Fig. 3D shows the Q-band Davies 55Mn-ENDOR light-minus-dark spectra, measured at the central magnetic field position of the corresponding EPR spectra (Fig. 3B). The line shape of the 55Mn-ENDOR signal shows only a small field dependence over the 1190 to 1260 mT range (not shown), consistent with its assignment to the tetranuclear Mn cluster.31 In contrast to the X-band CW EPR spectra described above (Fig. 3A), the S2 states of the native, Sr2+-substituted, NH3-annealed and doubly modified (not shown) OEC give rise to highly similar 55Mn-ENDOR spectra. Five peaks are observed for all three sample types appearing at approximately the same frequency positions and of similar intensities. Small differences in the region of the largest peak (≈115 MHz) may represent residual Mn2+ contaminations. Importantly, no large difference is seen with regard to the total spectral breadth of the signal (≈55 to ≈195 MHz). For the NH3-modified S2 state, the results are nominally consistent with the earlier X-band ENDOR data of Peloquin et al.30 The Q-band ENDOR spectra presented here do slightly differ from those presented in ref. 33, 34, 44 and 115 with regard to line intensities, discussed in detail in the Section S6 (ESI†).
Spectral simulations of the complete EPR and 55Mn-ENDOR datasets using the spin Hamiltonian formalism are also shown in Fig. 3 (red dashed lines); the fitted effective G and hyperfine tensors A of the Mn clusters in the low-spin S2 state are listed in Table 1. The effective G tensors of all three spin systems are in the same range as inferred from EPR measurements on PSII single crystals at W-band, i.e. G = [1.997, 1.970, 1.965]116 and G = [1.988, 1.981, 1.965].117 As found previously,30,31,33,34,44 the inclusion of four hyperfine tensors of approximately the same magnitude and near-axial symmetry is required to simultaneously fit the X-, Q- and W-band EPR and Q-band 55Mn-ENDOR line widths and shapes. The z component represents the principal component for the fitted G and all four hyperfine tensors. Comparison of the fitted parameters demonstrates that the three samples basically exhibit the same electronic structure. The sets of the four isotropic values Ai,iso deviate only by ≤4% between the three different systems and the signs and magnitudes of the anisotropies Ai,aniso are broadly similar, suggesting that there are no significant differences in the electronic exchange coupling schemes of the Mn4O5Ca/Sr(–NH3) clusters.
| G | A i /MHz | |||||
|---|---|---|---|---|---|---|
| A 1 | A 2 | A 3 | A 4 | |||
| a All G and A tensors are collinear. b The equatorial and axial G and Ai values are defined as G⊥ = (Gx + Gy)/2, G∥ = Gz, and Ai,⊥ = (Ai,x + Ai,y)/2, Ai,∥ = Ai,z. c The isotropic G and Ai (i = 1–4) values are the averages of the individual values: Giso = (Gx + Gy + Gz)/3 and Ai,iso = (Ai,x + Ai,y + Ai,z)/3. d The anisotropy in the G and Ai values is expressed as the difference Ai,aniso = Ai,⊥ − Ai,∥. | ||||||
| Native | x | 1.989 | 350 | 214 | 214 | 173 |
| y | 1.978 | 329 | 195 | 184 | 157 | |
| ⊥b | 1.983 | 339 | 204 | 199 | 165 | |
| zb | 1.956 | 321 | 282 | 282 | 251 | |
| isoc | 1.974 | 333 | 230 | 227 | 194 | |
| anisod | 0.028 | 19 | −78 | −83 | −87 | |
| Sr2+-substituted | x | 1.992 | 328 | 213 | 215 | 161 |
| y | 1.981 | 347 | 201 | 180 | 175 | |
| ⊥b | 1.986 | 338 | 207 | 197 | 168 | |
| zb | 1.963 | 320 | 283 | 270 | 224 | |
| isoc | 1.978 | 332 | 232 | 221 | 187 | |
| anisod | 0.024 | 17 | −76 | −73 | −56 | |
| NH3-modified | x | 1.989 | 326 | 214 | 215 | 154 |
| y | 1.978 | 345 | 195 | 187 | 175 | |
| ⊥b | 1.984 | 336 | 204 | 201 | 164 | |
| zb | 1.956 | 322 | 283 | 275 | 229 | |
| isoc | 1.975 | 331 | 231 | 225 | 186 | |
| anisod | 0.027 | 13 | −79 | −74 | −65 | |
3.3 Calculated magnetic properties for the native and modified S2 states of the OEC
The electronic structure of the coupled OEC spin system is defined by the set of six pairwise Mn–Mn exchange interaction terms Jij, which can be calculated using BS-DFT. For all four computational models describing the set of native and chemically perturbed S2 state clusters, the calculations reveal that the αββα spin configuration (Fig. 4A and B) is the lowest in energy. Sets of Jij coupling constants are given in Table S1 of the ESI.† Diagonalization of the Heisenberg Hamiltonian to obtain the complete spin ladder confirms that all four models exhibit an effective total spin ST = 1/2 ground state, as observed experimentally, and an ST = 3/2 first excited state. The estimated energy differences between the two lowest states of the spin ladder are on the order of 24–26 cm−1 for the Mn4O5Ca/Sr S2 state structures, lowering by 7 cm−1 upon exchange of W1 for NH3 (Table S1, ESI†). These values are in the range inferred from experiments.‡![[thin space (1/6-em)]](https://www.rsc.org/images/entities/char_2009.gif) 33,34,118,119
33,34,118,119
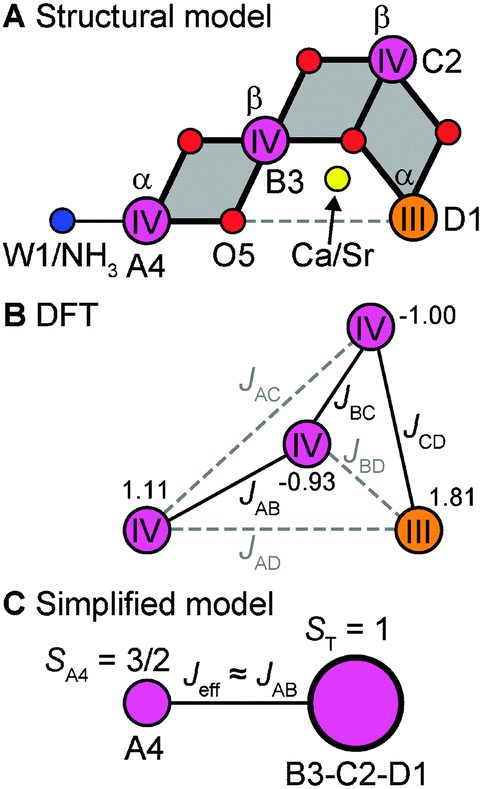 | ||
| Fig. 4 The magnetism of the low-spin S2 state. (A) Connectivity of the inorganic centres showing the three μ-oxo-bridged dimanganese units, defining the main electronic exchange pathways of the cluster. (B) Spin coupling scheme showing the main (black solid lines) and weak (grey dashed lines) exchange couplings Jij within the OEC. The numbers next to the Mn ions represent their spin projection factors ρi,iso for the native S2 state BS-DFT model. (C) Simplified spin coupling model in which the trimer unit MnB3MnC2MnD1 interacts with the outer MnA4via an effective coupling Jeff that may be approximated as JAB. | ||
For all four S2 state OEC forms, the J-coupling topology consists of three main coupling pathways (Table S1, ESI† and Fig. 4B): (i) an antiferromagnetic coupling pathway between MnD1 and MnC2 (JCD); (ii) a ferromagnetic coupling pathway between MnC2 and MnB3 (JBC); (iii) and an antiferromagnetic coupling pathway between MnB3 and MnA4 (JAB). The ferromagnetic exchange pathway JBC = 19–28 cm−1 is the largest in absolute magnitude, while the antiferromagnetic pathways JCD = −16 to −18 cm−1 and JAB = −12 to −16 cm−1 are slightly weaker. The remaining exchange coupling constants JAC, JAD and JBD are small, as can be expected from geometric considerations (see Table S1, ESI†). JCD and JBC represent the two largest exchange interactions within the cuboidal trimer unit (MnB3MnC2MnD1) of the cluster, whereas JAB can be considered to a good approximation as being representative of an effective exchange interaction between this cuboidal unit and the outer MnA4, as shown in Fig. 4C.
Systematic differences are observed for the exchange pathways upon the two chemical perturbations, replacement of Ca2+ by Sr2+ and NH3 exchange at W1 (Table S1, ESI†). When comparing the structure pairs that differ in terms of the presence of Ca2+ or Sr2+, i.e. Mn4O5Ca vs. Mn4O5Sr and Mn4O5Ca–NH3vs. Mn4O5Sr–NH3, it is seen that only the major coupling pathways JCD and JBC are modified, decreasing by 2 cm−1 and 5 cm−1, respectively. JAB remains unchanged. By contrast, for the corresponding structure pairs where NH3 is exchanged for W1, the JCD pathway is unchanged, while JBC and JAB increase by 4 cm−1. It is noted that the perturbation of the O5 position upon NH3 substitution, as shown in Fig. 2, results also in an enhancement of JBD by 3 cm−1. In both cases, the changes in the magnetic interactions can be understood within the geometric changes discussed in Section 3.1 (see Fig. 2): Sr2+ substitution mostly affects the structure of the cuboidal unit, thus perturbing principally the exchange pathways within the Mn-trimer unit, whereas NH3 binding perturbs mostly the connectivity between the trimeric moiety and the outer MnA4 (Fig. 4C).
Calculated 55Mn on-site (intrinsic/not spin-projected) hyperfine tensors as in the full (non-effective) spin Hamiltonian based on the BS-DFT models are listed in Table 2 for the four S2 state variants. The calculated isotropic hyperfine values ai,iso for the three MnIV ions fall within the range seen in MnIV model compounds experimentally, i.e. |aiso| = 187–253 MHz (see ref. 30 and 33). The anisotropy of the calculated hyperfine tensors for these three sites is also small, of the order seen in octahedral MnIV model complexes, i.e. |aaniso| < 30 MHz.33 For the MnD1III ion, the calculated isotropic hyperfine value (≈130 MHz) is smaller than that for MnIV, as expected, and lies just outside the range seen in MnIII compounds, i.e. |aiso| = 165–225 MHz.30,33 As typical for MnIII, it exhibits a significant hyperfine anisotropy, more pronounced than for the MnIV ions. However, it is noted that the calculated values for the MnD1III site are unexpectedly large. Nevertheless, the computed parameters correlate with the inferred site geometry of MnD1, namely that of a square-pyramidal 5-coordinate MnIII ion. Such a coordination environment generally yields a small isotropic 55Mn on-site hyperfine coupling and a negative anisotropy (see Table 2), consistent with an effective local 5B1 electronic ground state for the MnD1III ion.30,33,120
| Mn ion | Structure | Spin projections | BS-DFT | Experiment | |||
|---|---|---|---|---|---|---|---|
| ρ i,iso | ρ i,aniso | a i,iso | a i,aniso | a i,iso | a i,aniso | ||
| a The isotropic ρi,iso and ai,iso values are the averages of the individual tensor components ρi,iso = (2ρi,⊥ + ρi,∥)/3 and ai,iso = (ai,x + ai,y + ai,z)/3. b The anisotropies of the ρi and ai tensors are expressed as the differences ρi,aniso = ρi,⊥ − ρi,∥ and ai,aniso = ai,⊥ − ai,∥, i.e. between the perpendicular and parallel tensor components. c The intrinsic fine structure values of MnIV ions were assumed to be dA4 = dB3 = dC2 = 0 cm−1. For the MnD1III ion, a value of dD1 = –1.43 cm−1 was fitted, with eD1/dD1 = 0. | |||||||
| MnA4 (MnIV) | Mn4O5Ca | 1.11 | 0.23 | −247 | −33 | −206 | 25 |
| Mn4O5Sr | 1.13 | 0.19 | −247 | −32 | −204 | 31 | |
| Mn4O5Ca–NH3 | 0.94 | 0.36 | −242 | −30 | −245 | −9 | |
| MnB3 (MnIV) | Mn4O5Ca | −0.93 | 0.29 | 194 | −22 | 207 | 26 |
| Mn4O5Sr | −0.92 | 0.24 | 194 | −21 | 202 | 8 | |
| Mn4O5Ca–NH3 | −0.86 | 0.44 | 193 | −19 | 221 | −33 | |
| MnC2 (MnIV) | Mn4O5Ca | −1.00 | 0.32 | 212 | −17 | 226 | 9 |
| Mn4O5Sr | −0.99 | 0.27 | 212 | −18 | 224 | 11 | |
| Mn4O5Ca–NH3 | −1.01 | 0.46 | 213 | −16 | 226 | −26 | |
| MnD1 (MnIII) | Mn4O5Ca | 1.81 | 0.38 | −128 | −142 | −186 | −46 |
| Mn4O5Sr | 1.78 | 0.32 | −138 | −144 | −188 | −41 | |
| Mn4O5Ca–NH3 | 1.92 | 0.54 | −127 | −142 | −176 | −52 | |
The effective hyperfine couplings measured by EPR spectroscopy for oligonuclear metal complexes reflect the on-site hyperfine couplings of the individual metal ion nuclei scaled by the contribution of the electronic spin of each metal ion to the effective spin state: Ai = ρiai. The set of scaling factors ρi, termed spin projection coefficients, are primarily determined by the set of pairwise exchange couplings as detailed in ref. 18, 30, 31, 33, 34, 36, 37 and 63. However, additional terms must be included to correctly estimate such spin projections for the OEC, specifically the relevant on-site fine structure parameters di for the individual Mni ions,18,30,33,34,63 yielding what are more accurately described as spin projection tensors. As the coordination geometries of the three MnIV ions of the S2 state are all octahedral, their local electronic structure should be of approximate spherical symmetry, their orbitals of t2g origin (dxy, dxz and dyz) being half-filled (local high-spin d3 configuration). As such, the MnIV ions are expected to only display small fine structure parameters di (<0.3 cm−1)121 and hence do not need to be explicitly considered. Thus, the set of parameters which define the spin projection tensors in the S2 state are the six pairwise exchange interaction terms and the fine structure parameter of the MnIII ion, dD1.
Using these spin projection tensors, the fitted projected 55Mn hyperfine tensors were scaled back to on-site hyperfine tensors to allow comparison to the BS-DFT values discussed above (Table 2). The only plausible assignment for all three forms of the OEC is that A1, A2, A3, and A4 correspond to aD1, aA4, aC2 and aB3, respectively. In our previous work,33 using BS-DFT structural models predating the latest crystal structure,9 values of −1.2 to −1.3 cm−1 were estimated for a supposedly axially symmetric dD1 in the native and Sr2+-substituted S2 states. Using the same approach, dD1 was re-estimated. It was possible to obtain on-site hyperfine anisotropies in the ranges characteristic for MnIII and MnIV ions employing a single value of −1.43 cm−1 for the three OEC systems, well within the range typically seen for MnIII model complexes. As discussed above with regard to the hyperfine tensor anisotropy of MnD1III, a negative d value requires an effective local 5B1 state for the MnD1III ion and is thus consistent with the square-pyramidal 5-coordinate ligand geometry of MnD1III, as present in all computational models. The experimental on-site hyperfine tensor values (Table 2) generally agree well with the BS-DFT estimates and MnIII and MnIV model compounds, with smaller isotropic values ai,iso for the MnIII ion than for the MnIV ions. In the native and Sr2+-substituted models, MnA4 displays a smaller aA4,iso than computed and in the NH3-modified system, where it exhibits the largest coupling of the MnIV ions. Compared to the calculations, the anisotropic components for the MnIV ions show a larger variance within |ai,aniso| ≲ 30 MHz. For MnD1III, aD1,aniso < −40 MHz is less negative than calculated. Overall, the experimental results confirm that the computed spin coupling schemes serve as a valid description of the native and modified S2 states.
3.4 The MnD1–His332-imino-N interaction
Three-pulse ESEEM measurements were performed to characterize the imino-N signal of His332 associated with the OEC variants in the S2 state. Fig. S4 and S5 (ESI†), respectively, depict τ- and magnetic-field-dependent (g ≈ 2.10–1.90) light-minus-dark- subtracted spectra and simulations of the native Mn4O5Ca (A, B), Sr2+-substituted Mn4O5Sr (C, D) and NH3-modified Mn4O5Ca–NH3 (E, F) S2 state samples. As noted in Pérez Navarro et al.,44 the 14N nitrogen signal observed for the native S2 state from T. elongatus is very similar to that measured in PSII from both higher plants (spinach)122 and the mesophilic cyanobacteria Synechocystis sp. PCC 6803,123 assigned to the imino-N of His332 via mutagenesis.123,124 The signals are essentially the same in the native, Sr2+-substituted and NH3-modified OEC clusters with regard to both their τ and magnetic-field dependence. The His332 imino-14N signal at Q-band nearly fulfils the cancellation condition, where Aiso is twice the 14N nuclear Larmor frequency (νn = 3.75 MHz at 1.22 T). The spectra are characterized by three features: the lines centred at frequencies below 2.5 MHz (να = νn − |Aiso|/2), single-quantum transitions around 7.5 MHz (νβ = νn + |Aiso|/2) and smaller double-quantum resonances around 15 MHz (ν2β = 2νn + |Aiso|). The line structuring is defined both by the 14N hyperfine anisotropy and the NQI.HYSCORE spectroscopy (a two-dimensional ESEEM technique) was performed on the three S2 state OECs at different magnetic-field positions (g ≈ 2.07–1.93) of the corresponding Q-band EPR envelopes to further constrain the 14N hyperfine and quadrupolar interaction matrices. Panels A, C and E in Fig. 5 show the Fourier-transformed spectra and simulations at the centre field position; low- and high-field spectra and simulations are presented in Fig. S6 and S7 in the ESI.† As seen for the three-pulse ESEEM spectra, their appearance is highly similar for all three variants of the OEC in the S2 state. In two dimensions, the three features that comprise the Q-band ESEEM spectra appear as cross peaks at corresponding frequencies both in the (−,+) and the (+,+) quadrants. As the 14N hyperfine coupling matches the cancellation condition, the cross peaks are shifted away from the diagonal, instead appearing near the frequency axes. Overall, virtually no orientation dependence is seen comparing the spectra at the three different magnetic fields (Section S8.2, ESI†), consistent with the electron–nuclear interaction being dominated by the isotropic component of the hyperfine coupling as compared to the anisotropic part and the traceless NQI, as in ref. 122, 123 and 125. Thus, the orientation of the His332 imino-14N hyperfine tensor relative to the G tensor cannot be determined from this dataset.
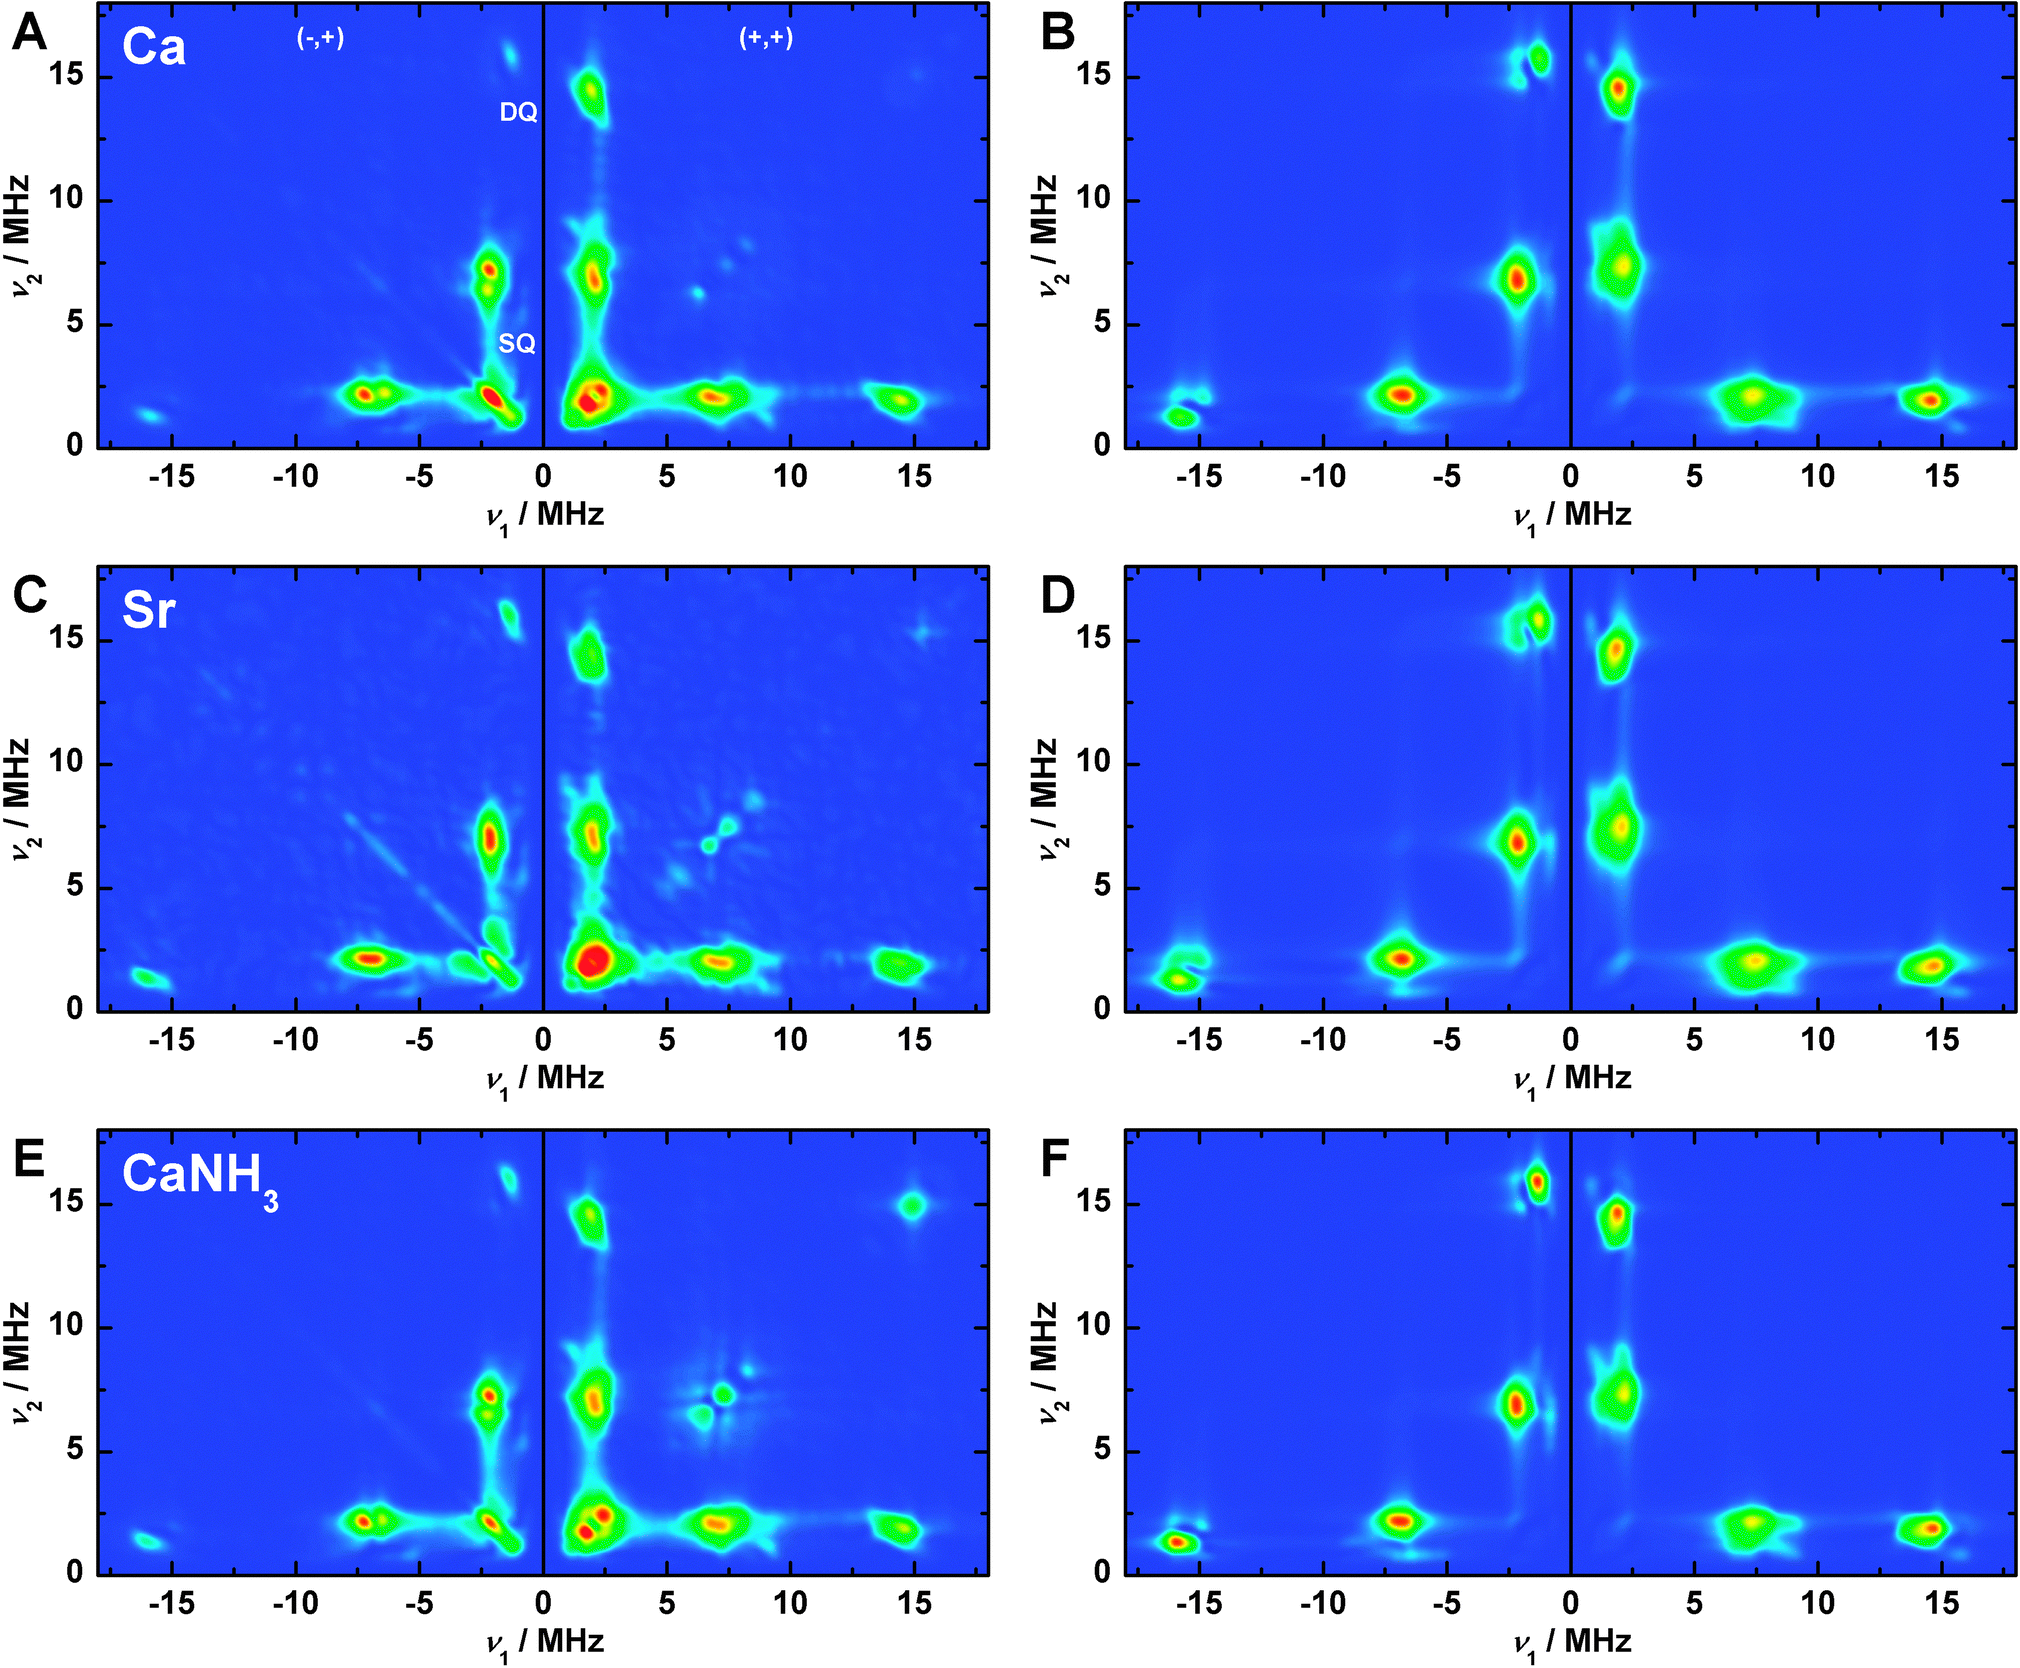 | ||
| Fig. 5 (−,+) and (+,+) quadrants of the Fourier-transformed Q-band HYSCORE experimental spectra (A, C, E) and spin Hamiltonian-based simulations (B, D, F) of the S2 state Mn4O5Ca (A, B), S2 state Mn4O5Sr (C, D) and annealed S2 state Mn4O5Ca–NH3 (E, F) clusters in PSII samples isolated from T. elongatus at central magnetic field. SQ and DQ point out the regions of single- and double-quantum transitions, respectively. The optimized parameter sets for the simulations, as described in Section 2.3 and Sections S3, S4 and S8.4 (ESI†), are listed in Table 3 and, in detail, in Table S2 (ESI†). Experimental parameters: microwave frequencies: 34.0370 GHz (Ca), 34.0433 GHz (Sr), 34.0151 GHz (NH); magnetic fields: 1220 mT (Ca), 1222 mT (NH3, Sr); shot repetition time: 1 ms; microwave pulse length (π/2): 12 ns; τ: 260 ns; ΔT: 100 ns; temperature: 5.2 K. | ||
Fitted spin Hamiltonian parameters derived from the simultaneous simulation of both the ESEEM and HYSCORE datasets are given in Table 3 together with BS-DFT estimates. To directly compare DFT values with experiment, the calculated site hyperfine tensor for the His332 was multiplied by the axial MnD1 spin projection tensor described in Section 3.3. All DFT models yield virtually the same hyperfine and quadrupole values. The calculated Aiso underestimates experimental results by <20%, but the dipolar component Adip and the rhombicity Aη nominally agree with experiment. It is noted that the on-site 14N hyperfine tensor a is expected to be axial with its unique component a1 aligned along the MnD1–N bond, as seen in our calculations (Table S2, ESI†). As such, the axial 14N hyperfine component a1 is essentially rotated 90° relative to that of the MnD1 spin projection tensor, which is expected to coincide with the Jahn–Teller axis of MnD1III. This 90° rotation explains why the 14N hyperfine tensor A is rhombic in the projected (experimental) reference frame. For a more detailed description of the simulations, see Section S8.4 (ESI†). Importantly, the near-invariance of the imino-N spin Hamiltonian parameters for the three S2 state forms requires the His332 ligation, the electronic structure of the MnD1III ion and by extension the whole tetranuclear Mn cluster, to not be significantly perturbed by Ca2+/Sr2+ and NH3/W1 exchange, in line with the EPR/55Mn ENDOR results described in Section 3.2.
| S2 state | 14N | Method | |Aisoa| | A dip | A η | |e2Qq/h| | η |
|---|---|---|---|---|---|---|---|
| a A iso is defined as the average of the principal components of the hyperfine tensor: Aiso = (A1 + A2 + A3)/3. b A dip is defined in terms of T1, T2, and T3 as Adip = (T1 + T2)/2 = –T3/2. c The rhombicity is defined by Aη or η = (T1 − T2)/T3, respectively. T1, T2, and T3 represent the three principal components of the hyperfine tensors minus Aiso and of the NQI tensors and are labelled such that |T1| ≤ |T2| ≤ |T3|. d The Euler rotation angles [α, β, γ] of the NQI relative to the A tensors are [20, 12, 0]°, [18, 9, 0]° and [16, 16, 0]° for the Mn4O5Ca, Mn4O5Sr and Mn4O5Ca–NH3 clusters, respectively. | |||||||
| Native | His332d | Exp. | 7.1 | 0.75 | 0.81 | 1.97 | 0.75 |
| DFT | 5.8 | 0.59 | 0.74 | 1.65 | 0.91 | ||
| Sr2+-substituted | His332d | Exp. | 7.3 | 0.69 | 0.83 | 1.98 | 0.79 |
| DFT | 5.8 | 0.57 | 0.61 | 1.65 | 0.91 | ||
| NH3-modified | His332d | Exp. | 7.2 | 0.75 | 0.89 | 1.96 | 0.80 |
| DFT | 6.1 | 0.71 | 0.99 | 1.68 | 0.88 | ||
| NH3 | Exp. | 2.36 | 0.33 | 0.22 | 1.52 | 0.47 | |
| DFT | 2.68 | −0.65 | 0.02 | 0.94 | 0.87 | ||
| NH3-modified, Sr2+-substituted | NH3 | Exp. | 2.37 | 0.28 | 0.23 | 1.58 | 0.45 |
| DFT | 2.68 | −0.59 | 0.03 | 0.93 | 0.87 | ||
While the orientation of the hyperfine tensor relative to the G tensor cannot be determined using ESEEM/HYSCORE at Q-band frequencies, it can be measured at W-band, e.g. using EDNMR. In our earlier study,14 it was found that the hyperfine tensor is orientated such that its principal, i.e. the smallest component A1 is aligned such that it is mid-way between Gx, and Gz. Importantly though, it is noted that the set of spin Hamiltonian parameters deduced from Q-band ESEEM/HYSCORE (Table 3) does not reproduce the W-band data sets (Section S8.3, ESI†). This is not due to the inclusion/exclusion of the NQI term, which, for the W-band EDNMR data, mainly contributes to the spectral line width. To reproduce the field dependence of the 14N- and 15N-EDNMR signals (Fig. S8 and S9, ESI†), the values determined from Q-band ESEEM/HYSCORE needed to be scaled: Aiso was decreased by 10%, whereas Adip was increased by a factor of two (Table S2, ESI†). The same results were observed for all three S2 state forms, which basically exhibit the same 14N-EDNMR spectra. A possible reason for this difference comes from the observation that the ground spin state, an effective spin ST = 1/2 state, is not very well separated energetically from higher spin states in the regime of the W-band excitation energy (≈3 cm−1), consistent with DFT estimates for the ground-to-first excited state energy splitting ΔE (Section S7, ESI†). Excited-state mixing due to a small ΔE has the consequence of altering spin Hamiltonian observables such as effective 55Mn and 14N hyperfine tensors. Alternatively, the rhombicity of the effective G tensor as inferred from the EPR/55Mn-ENDOR simulations may be artificial, a consequence of using collinear G and 55Mn hyperfine tensors. This latter suggestion would also explain why the G tensors inferred from W-band measurements on PSII single crystals116,117 differ from those inferred from our multifrequency measurements on frozen solution PSII samples.
The lack of agreement between the two 14N datasets brings into question whether the W-band 14N/15N-EDNMR signals can be used to assign the exchangeable μ-oxo bridge 17O signal based on the relative orientations of the 14N and 17O hyperfine tensors, as suggested by Rapatskiy et al.14 Thus, further experimental results, particularly from single crystals of PSII, are needed to test this proposal (see Section 3.6).
3.5 NH3 binding to the Ca2+- and the Sr2+-containing OEC
In the NH3-modified S2 state, a second nitrogen nucleus is bound to the Mn cluster as a terminal ligand, as described in Pérez Navarro et al.44 Its binding can be observed using X-band (three-pulse) ESEEM, as shown in Fig. S11 (ESI†) for 14NH3/15NH3-bound, Ca2+- and Sr2+-containing PSII. The 14NH3 resonances comprise three characteristic single-quantum lines at 0.5, 0.95 and 1.45 MHz split by the NQI and smaller double-quantum transitions centred at 4.9 MHz, highly similar to the higher plant data.70 Due to the lack of the NQI, the 15NH3 signal is clearly less complicated, consisting only of one single-quantum hyperfine peak centred at 0.3 MHz. As seen for the His332 imino-14N signal at Q-band, the NH3 interaction at X-band fulfils the cancellation condition, leading to a narrow να line while the νβ line is broadened beyond detection.70 Most importantly, the spectra of the 14NH3-modified Ca2+- and Sr2+-containing 14N-PSII samples are essentially identical. Thus, NH3 binding to the Sr2+-substituted S2 state cluster is the same as in the native S2 state.In our first report on NH3 binding to the OEC, only the 14NH3 interaction was considered.44 Here, we simultaneously fit the spectra of both the 14NH3-modified 15N-PSII and the 15NH3-modified 14N-PSII in the S2 state (Table 3, Fig. S11 and Table S3, ESI†). This resulted in an optimized hyperfine tensor A = [2.76 2.62 1.69] MHz for 14NH3 (and for 15N scaled by the ratio of the nuclear g values of 15N and 14N) and 14N NQI parameters e2Qq/h = 1.52 MHz and η = 0.47. Highly similar hyperfine and NQI values reproduce the NH3 signal observed in the annealed S2 state of Sr2+-containing 14N-PSII. The isotropic 14N hyperfine coupling Aiso = 2.36 MHz and Adip = 0.33 MHz, e2Qq/h and the asymmetry parameter η are the same as reported before for PSII from T. elongatus44 and similar to the values from the analysis of higher plant X-band ESEEM spectra70 (Table 3).
An axial projected 14NH3 hyperfine tensor is obtained from BS-DFT calculations, as seen in the experiment. This is because (i) the on-site 14NH3 hyperfine tensor is axial, and (ii) its axial and equatorial components are essentially coincident with those of the MnA4 spin projection tensor (Table S3, ESI†), unlike the case for the His332 imino-14N a tensor (see Section 3.4). The BS-DFT calculations also reproduce the comparably large and rhombic NQI parameters (Table 3), although the sign of the hyperfine anisotropy is inverted compared to experiment. For more details, see Section S9 in the ESI.†
3.6 Interactions with exchangeable 17O species
As we have recently shown,14,19 EDNMR spectroscopy at W-band, due to its comparatively high sensitivity, is the preferred method to measure the interactions of exchangeable 17O nuclei with fast-relaxing electronic species such as the S2 state of the OEC. Fig. 6 shows these spectra and simulations (see Section 2.3 and Sections S3 and S4, ESI† for details) of the single-quantum region for the native, the Sr2+-substituted, the NH3-annealed and the Sr2+- and NH3-modified S2 state variants after H217O buffer exchange in the S1 state (see Fig. S12 (ESI†) for the double-quantum region). The spectrum of the native system exhibits the single- and double-quantum resonances of the imino-14N of His332 (blue) and of three different classes of 17O species,14i.e. (i) a strongly coupled, bridging species (green), (ii) an intermediately coupled terminal O-ligand (orange), and (iii) a weakly coupled terminal class (cyan). These were assigned to the μ-oxo bridge O5, the hydroxide ion W212 and the H2O matrix (comprising ligand W1 of MnA4 and two H2O ligands at the Ca2+ ion), respectively. NH3 binding causes a narrowing of the 17O single- and double-quantum envelopes, reproduced by a decrease of the hyperfine couplings of O5 and W2 and concomitant reduction of the matrix line intensity, which was interpreted by NH3 binding to MnA4 in exchange for W1.44 Comparing these two spectral forms to those of the corresponding Sr2+-substituted W1- and NH3-containing clusters (Fig. S13, ESI†), we see a systematic narrowing of the single-quantum envelope by ≈0.5 MHz and a corresponding narrowing of the double-quantum envelope. This can be reproduced by spectral simulations in which the hyperfine couplings of the μ-oxo bridge are reduced accordingly (W1: 9.2 MHz vs. 9.7 MHz, NH3: 6.5 vs. 7.0 MHz), while the other 17O interactions remain unaltered (for a complete set of hyperfine parameters, see Table S4, ESI†). Although weaker than the NH3 effect, the narrowing was found to be reproducible in all Sr2+-substituted PSII samples. It clearly shows that Ca2+/Sr2+ exchange perturbs the μ-oxo bridge, in addition to a simultaneous modification by NH3 binding.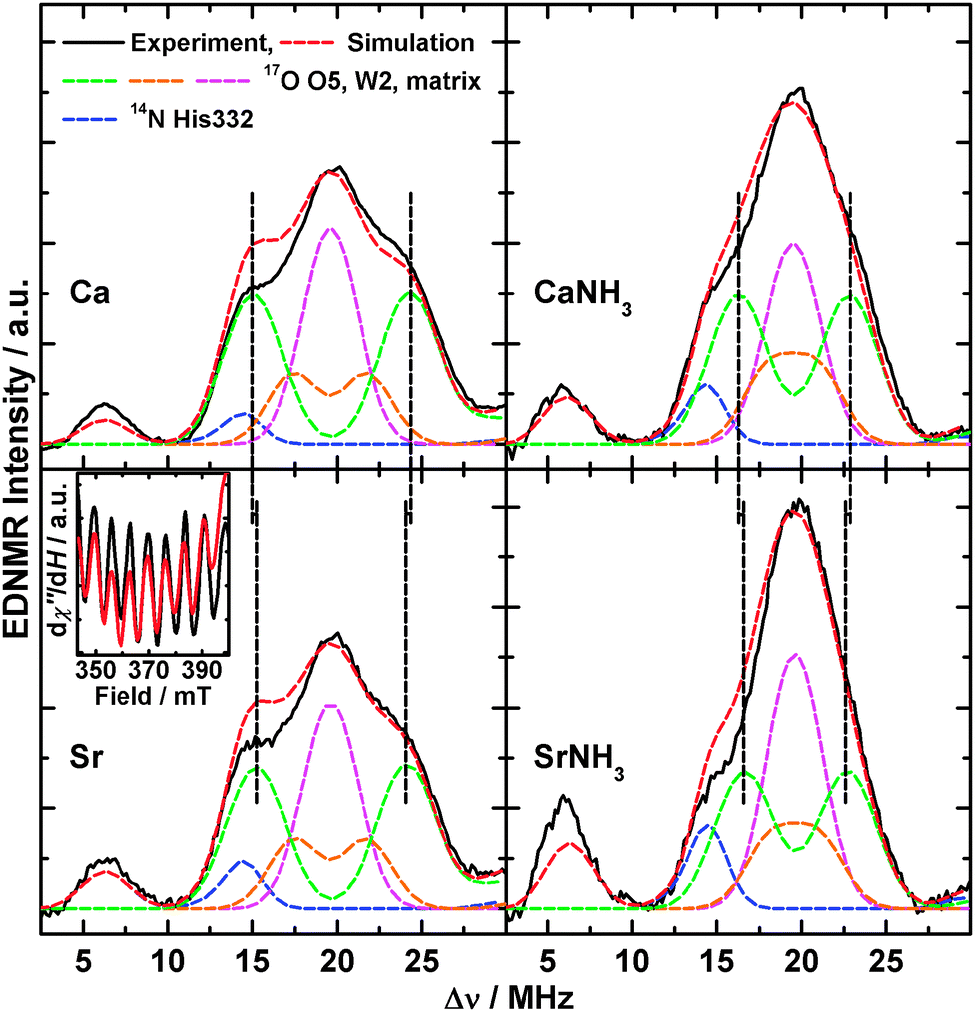 | ||
| Fig. 6 17O-EDNMR spectra of the native (Ca) the Sr2+-substituted (Sr), the NH3-annealed (CaNH3) and the Sr2+-substituted NH3-annealed (SrNH3) S2 states in PSII samples isolated from T. elongatus. Black solid traces depict the single-quantum region of background-corrected experimental spectra; superimposing red dashed traces represent simulations based on the spin Hamiltonian formalism as outlined in Section 2.3 and Sections S3 and S4 (ESI†). Coloured dashed lines represent a decomposition of the simulation showing contributions from the individual 14N and 17O nuclei. Black dashed lines highlight the decrease of the strong 17O interaction upon Ca2+/Sr2+ exchange. The optimized parameter sets are listed in Table S4 (ESI†). Double-quantum regions are shown in Fig. S12 (ESI†). Inset: a section of the X-band CW EPR spectra of the Sr2+-substituted S2 state in PSII samples in the absence (black) and presence (red) of H217O showing no line broadening upon 17O exchange. Experimental parameters: see Fig. S12 and for the inset Fig. S14 (ESI†). | ||
The inset in Fig. 6 depicts a section of the X-Band CW EPR spectra of the Sr2+-substituted S2 state, which exhibits an intrinsically smaller average line width (≈3.6 mT peak-to-peak) than the native form (≈4 mT), in the presence and absence of 17O (see Fig. S14 (ESI†) for the entire spectra). No EPR line broadening is observed upon 17O exchange. This demonstrates that the largest 17O coupling represents only one exchangeable oxo bridge. In the case of two hyperfine interactions of ≈10 MHz, the effective line broadening due to the combined 17O couplings would be larger than 120 MHz or 4.3 mT, exceeding the actual line width.
4 Discussion
4.1 A common electronic structure of the S2 state variants
Our DFT results show that the Sr2+-substituted, the NH3-annealed and the Sr2+- and NH3-modified low-spin S2 states basically represent the same structure on both a geometric and electronic level. This result is not immediately obvious from their X-band EPR signals. Indeed historically, the Sr2+-substituted and NH3-modified forms were explained in terms of a change of the valence state distribution within the Mn tetramer and thus of the coordination environment of the MnIII ion.126 The comprehensive approach pursued in this study conclusively rules out such a mechanism for electronic structure perturbation. Instead, as proposed by our group,33,34,63 multiline heterogeneity reflects rather subtle changes of the Mn-tetramer structure. The similarity of the perturbed multiline forms suggest a common mechanism for electronic perturbation, which probably also explains S1 state heterogeneity. This is discussed below, with reference to solvent access, substrate binding and exchange.The magnetic observable that is altered upon Ca2+/Sr2+ replacement and/or W1/NH3 exchange, leading to the perturbed multiline forms is the 55Mn hyperfine anisotropy. Small perturbations of the four hyperfine tensors result in a change in the hyperfine peak superposition, altering the apparent structure of the X-band EPR signal (Fig. 3A). Importantly these changes are subtle, as demonstrated by the invariance of the 55Mn-ENDOR spectra (Fig. 3D). The 55Mn hyperfine anisotropy is not a site property, but instead an indirect measure of the fine structure splitting of the MnIII ion30,33,34,63 or, in the ‘monomer–trimer’ model, the zero-field splitting of the whole trimer unit. Within this model, its contribution is modulated by the electronic connectivity between the two fragments, predominantly the exchange pathway JAB, the coupling that mostly defines the energy splitting ΔE between the ground state and the first excited state (Fig. 4C). Our BS-DFT results support this basic mechanism for electronic structure perturbation and, for the first time, describe the changes on the molecular level that impart this variation, and which differ for the two modifications. Upon replacement of Ca2+ by Sr2+, the slight distortion of the cuboidal moiety leads to a perturbation of the intra-cuboidal exchange network and possibly the MnD1III site fine structure splitting. It is noted that this, besides changing the 55Mn hyperfine anisotropy, also manifests itself in terms of the G tensor, also contributing to the altered multiline appearance and the g shift of the W-band EPR signal. Exchange of W1 by NH3 affects the connectivity of the outer MnA4 to the cuboidal unit, as modulated by the μ-oxo bridge O5, perturbing the JAB exchange pathway, thus changing the 55Mn hyperfine anisotropy. In the case of the S2 state variant that contains both these modifications, their effects on the electronic structure are additive. It is noted that it is the properties of the cuboidal unit that define the G tensor as opposed to the outer MnA4, which presumably has an isotropic on-site g value. This is expected, as it is the MnD1III ion, which is part of the trimer fragment in the S = 1/2 configuration, that should form the dominant contribution to the anisotropy of the G tensor in all four systems.
4.1.2a The MnD1–His332-imino-N interaction. As described by Stich et al.,123 the magnitude of the MnD1–His332 imino-N hyperfine interaction, as compared against mixed-valence MnIIIMnIV model compounds and protein cofactors with imidazole ligands to MnIII (Aiso ≤ 13 MHz) and MnIV ions (Aiso = 1.5–3.3 MHz),128–134 favours assigning MnD1 as the only MnIII ion of the S2 state, consistent with the EPR/55Mn-ENDOR/DFT results already reported in the literature and detailed above (Sections 3.1–3.3). The large hyperfine couplings seen for ligands coordinating to MnIII in S2 (and model systems) comes from the fact that the MnIII ion carries the largest spin projection coefficient, i.e. in Mn dimers ρiso(MnIII) = 2 and ρiso(MnIV) = –1. Interestingly, the hyperfine and quadrupole couplings of imidazole ligands of MnIII ions differ depending on whether they represent axial (Aiso = 9–13 MHz, e2Qq/h = 2.1–3.0 MHz)128–132 or equatorial ligands (Aiso = 1.5–6.6 MHz, e2Qq/h = 1.5–2.5 MHz).131–134 The values seen for the His332 imino-N (Aiso = 7.1 MHz, e2Qq/h = 1.97 MHz) fall closer to the equatorial range supporting its assignment as an equatorial ligand consistent with DFT structural models. In such models,12,37,40,103,106 the local Jahn–Teller axis of the MnD1III ion is aligned along the open coordination site, thus considered a pseudo-Jahn–Teller axis, perpendicular to the MnD1–N bond. It is supposed that the reason why the 14N couplings measured for the His332 do not exactly fall within the range seen in model complexes is that all model complexes measured thus far represent 6-coordinate MnIII ions whereas the MnD1III ion in the S2 state is 5-coordinate.
4.1.2b The MnA4–NH3 interaction. As recently shown in Pérez Navarro et al.,44 the binding site of NH3 is likely the W1 site. The small effective isotropic 14N hyperfine coupling (Aiso = 2.36 MHz) and the axiality of the hyperfine tensor are both consistent with a terminal ligand to a MnIV (d3) ion.44,70 The similar Aiso in the Mn4O5Sr–NH3 cluster confirms that the oxidation state of the MnA4 ion is not altered by Sr2+ substitution. Moreover, the binding mode and perturbation mechanism of NH3 is the same in the Ca2+- and Sr2+-containing Mn clusters. The non-axiality of the electric field gradient (η = 0.47) is characteristic for this ligand. A large asymmetry parameter is uncommon for a terminal ligand of MnIV (although our value is already ≈20% smaller than that reported earlier70). The latest crystal structure9 suggests that such an asymmetric distortion could be present for the W1 site due to the charged residue D1-Asp61, in H-bonding distance to W1/NH3, as seen for other protein systems.135 Indeed, upon inclusion of the Asp61 residue, which was not included in our previous, smaller BS-DFT model,44 the asymmetric quadrupole tensor is now reproduced, and the hyperfine coupling constant shows better agreement with experiment (Fig. 7 and Table 3). In contrast, such an asymmetric distortion is not seen for the W2 ligand as a similar charged amino-acid residue partner is not present to provide a H-bond.
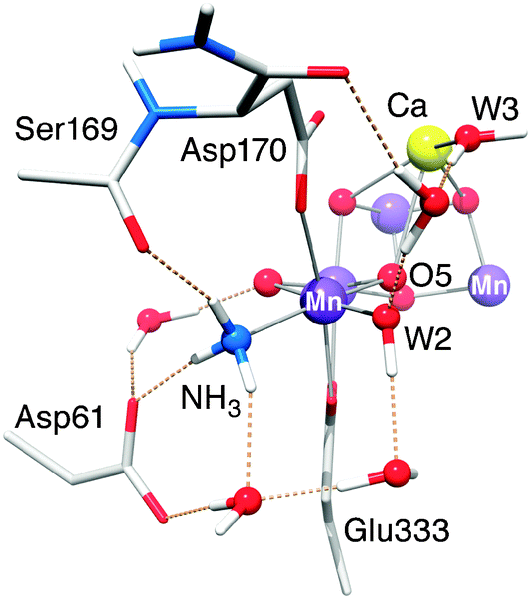 | ||
| Fig. 7 Hydrogen bonding network in the vicinity of the MnA4-bound NH3, as observed in the optimized DFT structure of the Mn4O5Ca–NH3 model. Mn ions are depicted in purple, O in red, Ca in yellow, C in light grey, N in blue and H in white. Only relevant residues, water molecules and protons are shown. | ||
4.2 The exchangeable μ-oxo bridge
Both modifications investigated, Ca2+/Sr2+ substitution and NH3/W1 replacement, perturb the 17O-EDNMR signals of exchangeable oxygen species of the OEC, specifically the exchangeable μ-oxo bridge. It is this bridge that likely represents one of the substrate water sites of the Mn tetramer. As the electronic structure of the OEC is essentially invariant for all four OEC forms, the change in hyperfine coupling for this μ-oxo bridge must represent a site modification, near or at the oxygen nucleus. NH3 binding primarily affects the connectivity of the outer MnA4 to the cuboidal trimer, whereas Sr2+ substitution instead perturbs the exchange network within the cluster. Thus, it can be surmised that the exchangeable μ-oxo bridge must both coordinate to the outer MnA4 and be associated with the Ca2+/Sr2+ ion itself as a structural element of the cuboidal trimer. Only the bridge O5 fulfils both these criteria. As a ligand to the Ca2+/Sr2+ ion, O5 is affected by the exchange of these ions of the same charge but different sizes. Similarly, as argued in Pérez Navarro et al.,44 NH3/W1 exchange perturbs O5 by binding trans to this bridge position, distorting the MnA4–O5 bond length.It is noted that these results exclude the possibility that NH3 displaces the exchangeable μ-oxo bridge as a bridging –NH2– species, an alternative rationale for the narrowing of the 17O signal envelope in line with earlier suggestions.70 Ca2+/Sr2+ and W1/NH3 exchange are additive in terms of their effect on the width of the 17O-EDNMR envelope, modelled here as defined by the μ-oxo bridge hyperfine coupling Aiso. This result mirrors the structural modifications observed for the doubly modified Mn4O5Sr–NH3 OEC model; i.e., the model contains additive structural modifications reflecting both singularly modified Mn4O5Sr and Mn4O5Ca–NH3 structures. If instead the NH3 did indeed replace the bridge, the width of the 17O-EDNMR envelope would be now defined by the W2 hyperfine coupling, and as such should be invariant to Ca2+/Sr2+ substitution. It is also noted that NH3 replacement of the exchangeable bridge O5 cannot quantitatively explain the virtually unaltered 14NH3 signal upon exchange of the O5-binding Ca2+, and the 17O hyperfine changes. Assuming an unaltered spin density on the bridge position, as follows from the similar spin projection factors for the four Mn ions, the measured 14N hyperfine coupling for the bound ammonia at this position is far too small. On the other hand, the 17O coupling of 6.5–7 MHz seen for the NH3/W1-exchanged system is in the range of those observed in Mn model complexes with a N-ligand trans to the oxo bridge.14
5 Conclusions
Time-dependent mass spectrometry experiments indicate that the early binding substrate (WS) is associated with all intermediate states of the OEC.66,136 Furthermore, the relatively slow exchange and the S-state dependence of this bound substrate with bulk water suggests that it represents a ligand of (a) Mn ion(s). As Ca2+/Sr2+ substitution also perturbs its exchange rate, WS is also supposed to coordinate to the Ca2+ ion.65,66 Of the exchangeable oxygen species identified here by 17O-EDNMR, only O5 is a ligand to both Mn and Ca2+. Similarly, only the O5 spectral signature is perturbed by Ca2+/Sr2+ exchange. Thus, O5 is the most likely candidate for WS. This assignment limits the possible reaction pathways for photosynthetic water splitting, and lays a foundation for studies of higher oxidized S states, which will serve to identify the second, fast exchanging substrate and eventually elucidate the mechanism of O–O bond formation. Currently two pathways are envisaged: O–O bond formation could proceed as a coupling between O5 and either (i) MnA4-bound W2 or Ca2+-bound W3, or (ii) a further oxygen not present yet in the S2 state.Acknowledgements
Financial support was provided by the Max-Planck-Gesellschaft, the “Bioénergie” program of the Commissariat à l'Énergie Atomique et aux Énergies Alternatives, the French Infrastructure for Integrated Structural Biology (FRISBI) ANR-10-INSB-05-01 program, and the EU/Energy Network project SOLAR-H2 (FP7 contract 212508). T.L. was supported by the Federal Ministry of Education and Research of Germany (BMBF) in the framework of the Bio-H2 project (03SF0355C). M.P.N. acknowledges support from the Spanish Ministerio de Economia y Competitividad (MAT 2008-03461).Notes and references
- P. Joliot, G. Barbieri and R. Chabaud, Photochem. Photobiol., 1969, 10, 309–329 CrossRef CAS.
- B. Kok, B. Forbush and M. McGloin, Photochem. Photobiol., 1970, 11, 457–475 CrossRef CAS.
- J. P. McEvoy and G. W. Brudvig, Chem. Rev., 2006, 106, 4455–4483 CrossRef CAS PubMed.
- W. Lubitz, E. J. Reijerse and J. Messinger, Energy Environ. Sci., 2008, 1, 15–31 CAS.
- J. Messinger, T. Noguchi and J. Yano, in Molecular Solar Fuels, ed. T. J. Wydrzynski and W. Hillier, Royal Society of Chemistry, Cambridge, 2012, pp. 163–207 Search PubMed.
- N. Cox and W. Lubitz, in Chemical Energy Storage, ed. R. Schlögl, De Gruyter Publishers, Berlin, 2012, pp. 185–224 Search PubMed.
- N. Cox and J. Messinger, Biochim. Biophys. Acta, Bioenerg., 2013, 1827, 1020–1030 CrossRef CAS PubMed.
- N. Cox, D. A. Pantazis, F. Neese and W. Lubitz, Acc. Chem. Res., 2013, 46, 1588–1596 CrossRef CAS PubMed.
- Y. Umena, K. Kawakami, J.-R. Shen and N. Kamiya, Nature, 2011, 473, 55–60 CrossRef CAS PubMed.
- C. P. Aznar and R. D. Britt, Philos. Trans. R. Soc. London, Ser. B, 2002, 357, 1359–1365 CrossRef CAS PubMed.
- K. A. Åhrling, M. C. W. Evans, J. H. A. Nugent, R. J. Ball and R. J. Pace, Biochemistry, 2006, 45, 7069–7082 CrossRef PubMed.
- W. Ames, D. A. Pantazis, V. Krewald, N. Cox, J. Messinger, W. Lubitz and F. Neese, J. Am. Chem. Soc., 2011, 133, 19743–19757 CrossRef CAS PubMed.
- S. Milikisiyants, R. Chatterjee, C. S. Coates, F. H. M. Koua, J.-R. Shen and K. V. Lakshmi, Energy Environ. Sci., 2012, 5, 7747–7756 CAS.
- L. Rapatskiy, N. Cox, A. Savitsky, W. M. Ames, J. Sander, M. M. Nowaczyk, M. Rögner, A. Boussac, F. Neese, J. Messinger and W. Lubitz, J. Am. Chem. Soc., 2012, 134, 16619–16634 CrossRef CAS PubMed.
- H. Nagashima and H. Mino, Biochim. Biophys. Acta, Bioenerg., 2013, 1827, 1165–1173 CrossRef CAS PubMed.
- A. Haddy, Photosynth. Res., 2007, 92, 357–368 CrossRef CAS PubMed.
- L. Kulik and W. Lubitz, Photosynth. Res., 2009, 102, 391–401 CrossRef CAS PubMed.
- T. Lohmiller, W. Ames, W. Lubitz, N. Cox and S. K. Misra, Appl. Magn. Reson., 2013, 44, 691–720 CrossRef CAS.
- N. Cox, W. Lubitz and A. Savitsky, Mol. Phys., 2013, 111, 2788–2808 CrossRef CAS.
- J. L. Casey and K. Sauer, Biochim. Biophys. Acta, Bioenerg., 1984, 767, 21–28 CrossRef CAS.
- J. C. de Paula and G. W. Brudvig, J. Am. Chem. Soc., 1985, 107, 2643–2648 CrossRef CAS.
- K. A. Åhrling, M. C. Evans, J. H. Nugent and R. J. Pace, Biochim. Biophys. Acta, Bioenerg., 2004, 1656, 66–77 CrossRef PubMed.
- G. C. Dismukes and Y. Siderer, Proc. Natl. Acad. Sci. U. S. A., 1981, 78, 274–278 CrossRef CAS.
- A. Boussac, S. Un, O. Horner and A. W. Rutherford, Biochemistry, 1998, 37, 4001–4007 CrossRef CAS PubMed.
- A. Boussac, H. Kuhl, S. Un, M. Rögner and A. W. Rutherford, Biochemistry, 1998, 37, 8995–9000 CrossRef CAS PubMed.
- O. Horner, E. Rivière, G. Blondin, S. Un, A. W. Rutherford, J.-J. Girerd and A. Boussac, J. Am. Chem. Soc., 1998, 120, 7924–7928 CrossRef CAS.
- A. Boussac and A. W. Rutherford, Biochim. Biophys. Acta, Bioenerg., 2000, 1457, 145–156 CrossRef CAS.
- A. Haddy, K. V. Lakshmi, G. W. Brudvig and H. A. Frank, Biophys. J., 2004, 87, 2885–2896 CrossRef CAS PubMed.
- A. Boussac, J. J. Girerd and A. W. Rutherford, Biochemistry, 1996, 35, 6984–6989 CrossRef CAS PubMed.
- J. M. Peloquin, K. A. Campbell, D. W. Randall, M. A. Evanchik, V. L. Pecoraro, W. H. Armstrong and R. D. Britt, J. Am. Chem. Soc., 2000, 122, 10926–10942 CrossRef CAS.
- L. V. Kulik, B. Epel, W. Lubitz and J. Messinger, J. Am. Chem. Soc., 2007, 129, 13421–13435 CrossRef CAS PubMed.
- C. Teutloff, S. Pudollek, S. Kessen, M. Broser, A. Zouni and R. Bittl, Phys. Chem. Chem. Phys., 2009, 11, 6715–6726 RSC.
- N. Cox, L. Rapatskiy, J.-H. Su, D. A. Pantazis, M. Sugiura, L. Kulik, P. Dorlet, A. W. Rutherford, F. Neese, A. Boussac, W. Lubitz and J. Messinger, J. Am. Chem. Soc., 2011, 133, 3635–3648 CrossRef CAS PubMed.
- J.-H. Su, N. Cox, W. Ames, D. A. Pantazis, L. Rapatskiy, T. Lohmiller, L. V. Kulik, P. Dorlet, A. W. Rutherford, F. Neese, A. Boussac, W. Lubitz and J. Messinger, Biochim. Biophys. Acta, Bioenerg., 2011, 1807, 829–840 CrossRef CAS PubMed.
- F. Neese, Coord. Chem. Rev., 2009, 253, 526–563 CrossRef CAS PubMed.
- D. A. Pantazis, M. Orio, T. Petrenko, S. Zein, E. Bill, W. Lubitz, J. Messinger and F. Neese, Chem.–Eur. J., 2009, 15, 5108–5123 CrossRef CAS PubMed.
- D. A. Pantazis, M. Orio, T. Petrenko, S. Zein, W. Lubitz, J. Messinger and F. Neese, Phys. Chem. Chem. Phys., 2009, 11, 6788–6798 RSC.
- S. Schinzel, J. Schraut, A. Arbuznikov, P. Siegbahn and M. Kaupp, Chem.–Eur. J., 2010, 16, 10424–10438 CrossRef CAS PubMed.
- N. Cox, W. Ames, B. Epel, L. V. Kulik, L. Rapatskiy, F. Neese, J. Messinger, K. Wieghardt and W. Lubitz, Inorg. Chem., 2011, 50, 8238–8251 CrossRef CAS PubMed.
- D. A. Pantazis, W. Ames, N. Cox, W. Lubitz and F. Neese, Angew. Chem., Int. Ed., 2012, 51, 9935–9940 CrossRef CAS PubMed.
- H. Isobe, M. Shoji, S. Yamanaka, Y. Umena, K. Kawakami, N. Kamiya, J.-R. Shen and K. Yamaguchi, Dalton Trans., 2012, 41, 13727–13740 RSC.
- K. Yamaguchi, H. Isobe, S. Yamanaka, T. Saito, K. Kanda, M. Shoji, Y. Umena, K. Kawakami, J.-R. Shen, N. Kamiya and M. Okumura, Int. J. Quantum Chem., 2013, 113, 525–541 CrossRef CAS.
- V. Krewald, F. Neese and D. A. Pantazis, J. Am. Chem. Soc., 2013, 135, 5726–5739 CrossRef CAS PubMed.
- M. Pérez Navarro, W. M. Ames, H. Nilsson, T. Lohmiller, D. A. Pantazis, L. Rapatskiy, M. M. Nowaczyk, F. Neese, A. Boussac, J. Messinger, W. Lubitz and N. Cox, Proc. Natl. Acad. Sci. U. S. A., 2013, 110, 15561–15566 CrossRef PubMed.
- A. Boussac and A. W. Rutherford, Biochemistry, 1988, 27, 3476–3483 CrossRef CAS.
- T. A. Ono and Y. Inoue, Arch. Biochem. Biophys., 1989, 275, 440–448 CrossRef CAS.
- A. Boussac, F. Rappaport, P. Carrier, J. M. Verbavatz, R. Gobin, D. Kirilovsky, A. W. Rutherford and M. Sugiura, J. Biol. Chem., 2004, 279, 22809–22819 CrossRef CAS PubMed.
- W. F. Beck, J. C. de Paula and G. W. Brudvig, J. Am. Chem. Soc., 1986, 108, 4018–4022 CrossRef CAS.
- W. F. Beck and G. W. Brudvig, Biochemistry, 1986, 25, 6479–6486 CrossRef CAS.
- L.-E. Andréasson, Ö. Hansson and K. von Schenck, Biochim. Biophys. Acta, Bioenerg., 1988, 936, 351–360 CrossRef.
- A. Boussac, A. W. Rutherford and S. Styring, Biochemistry, 1990, 29, 24–32 CrossRef CAS.
- D. H. Kim, R. D. Britt, M. P. Klein and K. Sauer, J. Am. Chem. Soc., 1990, 112, 9389–9391 CrossRef CAS.
- D. H. Kim, R. D. Britt, M. P. Klein and K. Sauer, Biochemistry, 1992, 31, 541–547 CrossRef CAS.
- A. Boussac, M. Sugiura, Y. Inoue and A. W. Rutherford, Biochemistry, 2000, 39, 13788–13799 CrossRef CAS PubMed.
- M. C. W. Evans, R. J. Ball and J. H. A. Nugent, FEBS Lett., 2005, 579, 3081–3084 CrossRef CAS PubMed.
- D. F. Ghanotakis, G. T. Babcock and C. F. Yocum, FEBS Lett., 1984, 167, 127–130 CrossRef CAS.
- P. O. Sandusky and C. F. Yocum, Biochim. Biophys. Acta, 1984, 766, 603–611 CrossRef CAS.
- P. O. Sandusky and C. F. Yocum, Biochim. Biophys. Acta, 1986, 849, 85–93 CrossRef CAS.
- T.-a. Ono and Y. Inoue, FEBS Lett., 1988, 227, 147–152 CrossRef CAS.
- A. Boussac, J. L. Zimmermann and A. W. Rutherford, Biochemistry, 1989, 28, 8984–8989 CrossRef CAS.
- M. Sivaraja, J. Tso and G. C. Dismukes, Biochemistry, 1989, 28, 9459–9464 CrossRef CAS.
- A. Boussac, J. L. Zimmermann, A. W. Rutherford and J. Lavergne, Nature, 1990, 347, 303–306 CrossRef CAS.
- T. Lohmiller, N. Cox, J.-H. Su, J. Messinger and W. Lubitz, J. Biol. Chem., 2012, 287, 24721–24733 CrossRef CAS PubMed.
- J. S. Vrettos, D. A. Stone and G. W. Brudvig, Biochemistry, 2001, 40, 7937–7945 CrossRef CAS PubMed.
- G. Hendry and T. Wydrzynski, Biochemistry, 2003, 42, 6209–6217 CrossRef CAS PubMed.
- W. Hillier and T. Wydrzynski, Coord. Chem. Rev., 2008, 252, 306–317 CrossRef CAS PubMed.
- J. Messinger, M. Badger and T. Wydrzynski, Proc. Natl. Acad. Sci. U. S. A., 1995, 92, 3209–3213 CrossRef CAS.
- K. Beckmann, J. Messinger, M. R. Badger, T. Wydrzynski and W. Hillier, Photosynth. Res., 2009, 102, 511–522 CrossRef CAS PubMed.
- B. A. Diner and R. D. Britt, in Photosystem II: The Light-Driven Water:Plastoquinone Oxidoreductase, ed. T. Wydrzynski and K. Satoh, Springer, Dordrecht, 2005, vol. 1, pp. 207–233 Search PubMed.
- R. D. Britt, J. L. Zimmermann, K. Sauer and M. P. Klein, J. Am. Chem. Soc., 1989, 111, 3522–3532 CrossRef CAS.
- M. Tsuno, H. Suzuki, T. Kondo, H. Mino and T. Noguchi, Biochemistry, 2011, 50, 2506–2514 CrossRef CAS PubMed.
- M. Sugiura, A. Boussac, T. Noguchi and F. Rappaport, Biochim. Biophys. Acta, Bioenerg., 2008, 1777, 331–342 CrossRef CAS PubMed.
- N. Ishida, M. Sugiura, F. Rappaport, T. L. Lai, A. W. Rutherford and A. Boussac, J. Biol. Chem., 2008, 283, 13330–13340 CrossRef CAS PubMed.
- J. Sander, M. Nowaczyk, J. Buchta, H. Dau, I. Vass, Z. Deák, M. Dorogi, M. Iwai and M. Rögner, J. Biol. Chem., 2010, 285, 29851–29856 CrossRef CAS PubMed.
- M. M. Nowaczyk, K. Krause, M. Mieseler, A. Sczibilanski, M. Ikeuchi and M. Rögner, Biochim. Biophys. Acta, Bioenerg., 2012, 1817, 1339–1345 CrossRef CAS PubMed.
- E. Reijerse, F. Lendzian, R. Isaacson and W. Lubitz, J. Magn. Reson., 2012, 214, 237–243 CrossRef CAS PubMed.
- E. L. Hahn, Phys. Rev., 1950, 80, 580–594 CrossRef.
- L. G. Rowan, E. L. Hahn and W. B. Mims, Phys. Rev., 1965, 137, A61–A71 CrossRef.
- P. Höfer, A. Grupp, H. Nebenführ and M. Mehring, Chem. Phys. Lett., 1986, 132, 279–282 CrossRef.
- E. R. Davies, Phys. Lett. A, 1974, A47, 1–2 CrossRef.
- P. Schosseler, T. Wacker and A. Schweiger, Chem. Phys. Lett., 1994, 224, 319–324 CrossRef CAS.
- S. Stoll and A. Schweiger, J. Magn. Reson., 2006, 178, 42–55 CrossRef CAS PubMed.
- F. Neese, Wiley Interdiscip. Rev.: Comput. Mol. Sci., 2012, 2, 73–78 CrossRef CAS.
- J. P. Perdew, Phys. Rev. B: Condens. Matter Mater. Phys., 1986, 33, 8822–8824 CrossRef.
- A. D. Becke, Phys. Rev. A: At., Mol., Opt. Phys., 1988, 38, 3098–3100 CrossRef CAS.
- E. van Lenthe, E. J. Baerends and J. G. Snijders, J. Chem. Phys., 1993, 99, 4597–4610 CrossRef CAS PubMed.
- E. van Lenthe, E. J. Baerends and J. G. Snijders, J. Chem. Phys., 1994, 101, 9783–9792 CrossRef CAS PubMed.
- C. van Wüllen, J. Chem. Phys., 1998, 109, 392–399 CrossRef PubMed.
- D. A. Pantazis, X. Y. Chen, C. R. Landis and F. Neese, J. Chem. Theory Comput., 2008, 4, 908–919 CrossRef CAS.
- A. Klamt and G. Schüürmann, J. Chem. Soc., Perkin Trans. 2, 1993, 799–805 RSC.
- S. Grimme, J. Antony, S. Ehrlich and H. Krieg, J. Chem. Phys., 2010, 132, 154104–154119 CrossRef PubMed.
- V. N. Staroverov, G. E. Scuseria, J. Tao and J. P. Perdew, J. Chem. Phys., 2003, 119, 12129–12137 CrossRef CAS PubMed.
- J. Tao, J. P. Perdew, V. N. Staroverov and G. E. Scuseria, Phys. Rev. Lett., 2003, 91, 146401 CrossRef.
- L. Noodleman, J. Chem. Phys., 1981, 74, 5737–5743 CrossRef CAS PubMed.
- K. Yamaguchi, T. Tsunekawa, Y. Toyoda and T. Fueno, Chem. Phys. Lett., 1988, 143, 371–376 CrossRef CAS.
- S. Yamanaka, T. Kawakami, H. Nagao and K. Yamaguchi, Chem. Phys. Lett., 1994, 231, 25–33 CrossRef CAS.
- A. Bencini and F. Totti, J. Chem. Theory Comput., 2009, 5, 144–154 CrossRef CAS.
- M. Orio, D. A. Pantazis and F. Neese, Photosynth. Res., 2009, 102, 443–453 CrossRef CAS PubMed.
- F. Neese, J. Comput. Chem., 2003, 24, 1740–1747 CrossRef CAS PubMed.
- F. Neese, F. Wennmohs, A. Hansen and U. Becker, Chem. Phys., 2009, 356, 98–109 CrossRef CAS PubMed.
- F. Weigend, Phys. Chem. Chem. Phys., 2006, 8, 1057–1065 RSC.
- M. Orio, D. A. Pantazis, T. Petrenko and F. Neese, Inorg. Chem., 2009, 48, 7251–7260 CrossRef CAS PubMed.
- P. E. M. Siegbahn, Acc. Chem. Res., 2009, 42, 1871–1880 CrossRef CAS PubMed.
- S. Luber, I. Rivalta, Y. Umena, K. Kawakami, J.-R. Shen, N. Kamiya, G. W. Brudvig and V. S. Batista, Biochemistry, 2011, 50, 6308–6311 CrossRef CAS PubMed.
- X. Li, E. M. Sproviero, U. Ryde, V. S. Batista and G. Chen, Int. J. Quantum Chem., 2013, 113, 474–478 CrossRef CAS.
- M. Retegan, F. Neese and D. A. Pantazis, J. Chem. Theory Comput., 2013, 9, 3832–3842 CrossRef CAS.
- Y. Pushkar, J. Yano, P. Glatzel, J. Messinger, A. Lewis, K. Sauer, U. Bergmann and V. K. Yachandra, J. Biol. Chem., 2007, 282, 7198–7208 CrossRef CAS PubMed.
- Y. L. Pushkar, J. Yano, K. Sauer, A. Boussac and V. K. Yachandra, Proc. Natl. Acad. Sci. U. S. A., 2008, 105, 1879–1884 CrossRef CAS PubMed.
- H. Dau, A. Grundmeier, P. Loja and M. Haumann, Philos. Trans. R. Soc. London, Ser. B, 2008, 363, 1237–1243 CrossRef CAS PubMed.
- A. Grundmeier and H. Dau, Biochim. Biophys. Acta, Bioenerg., 2012, 1817, 88–105 CrossRef CAS PubMed.
- F. H. Koua, Y. Umena, K. Kawakami and J.-R. Shen, Proc. Natl. Acad. Sci. U. S. A., 2013, 110, 3889–3894 CrossRef CAS PubMed.
- M. Sugiura, F. Rappaport, K. Brettel, T. Noguchi, A. W. Rutherford and A. Boussac, Biochemistry, 2004, 43, 13549–13563 CrossRef CAS PubMed.
- H. Dau, J. C. Andrews, T. A. Roelofs, M. J. Latimer, W. Liang, V. K. Yachandra, K. Sauer and M. P. Klein, Biochemistry, 1995, 34, 5274–5287 CrossRef CAS.
- S. Pudollek, Doctoral Thesis, Freie Universität Berlin, 2012 Search PubMed.
- S. Pudollek, F. Lendzian and R. Bittl, Biochem. Soc. Trans., 2008, 36, 1001–1004 CrossRef CAS PubMed.
- C. Teutloff, S. Kessen, J. Kern, A. Zouni and R. Bittl, FEBS Lett., 2006, 580, 3605–3609 CrossRef CAS PubMed.
- H. Matsuoka, K. Furukawa, T. Kato, H. Mino, J.-R. Shen and A. Kawamori, J. Phys. Chem. B, 2006, 110, 13242–13247 CrossRef CAS PubMed.
- D. Koulougliotis, R. H. Schweitzer and G. W. Brudvig, Biochemistry, 1997, 36, 9735–9746 CrossRef CAS PubMed.
- G. A. Lorigan and R. D. Britt, Photosynth. Res., 2000, 66, 189–198 CrossRef CAS.
- K. A. Campbell, D. A. Force, P. J. Nixon, F. Dole, B. A. Diner and R. D. Britt, J. Am. Chem. Soc., 2000, 122, 3754–3761 CrossRef CAS.
- M. Zheng, S. V. Khangulov, G. C. Dismukes and V. V. Barynin, Inorg. Chem., 1994, 33, 382–387 CrossRef CAS.
- G. J. Yeagle, M. L. Gilchrist, L. M. Walker, R. J. Debus and R. D. Britt, Philos. Trans. R. Soc. London, Ser. B, 2008, 363, 1157–1166 CrossRef CAS PubMed.
- T. A. Stich, G. J. Yeagle, R. J. Service, R. J. Debus and R. D. Britt, Biochemistry, 2011, 50, 7390–7404 CrossRef CAS PubMed.
- R. J. Debus, K. A. Campbell, W. Gregor, Z. L. Li, R. L. Burnap and R. D. Britt, Biochemistry, 2001, 40, 3690–3699 CrossRef CAS PubMed.
- G. J. Yeagle, M. L. Gilchrist, R. M. McCarrick and R. D. Britt, Inorg. Chem., 2008, 47, 1803–1814 CrossRef CAS PubMed.
- M. Zheng and G. C. Dismukes, Inorg. Chem., 1996, 35, 3307–3319 CrossRef CAS PubMed.
- A. Guskov, J. Kern, A. Gabdulkhakov, M. Broser, A. Zouni and W. Saenger, Nat. Struct. Mol. Biol., 2009, 16, 334–342 CAS.
- X. L. Tan, Y. Gultneh, J. E. Sarneski and C. P. Scholes, J. Am. Chem. Soc., 1991, 113, 7853–7858 CrossRef CAS.
- X. S. Tang, M. Sivaraja and G. C. Dismukes, J. Am. Chem. Soc., 1993, 115, 2382–2389 CrossRef CAS.
- S. Khangulov, M. Sivaraja, V. V. Barynin and G. C. Dismukes, Biochemistry, 1993, 32, 4912–4924 CrossRef CAS.
- K.-O. Schäfer, R. Bittl, W. Zweygart, F. Lendzian, G. Haselhorst, T. Weyhermüller, K. Wieghardt and W. Lubitz, J. Am. Chem. Soc., 1998, 120, 13104–13120 CrossRef.
- S. Sinnecker, F. Neese, L. Noodleman and W. Lubitz, J. Am. Chem. Soc., 2004, 126, 2613–2622 CrossRef CAS PubMed.
- S. Sinnecker, F. Neese and W. Lubitz, J. Biol. Inorg. Chem., 2005, 10, 231–238 CrossRef CAS PubMed.
- T. A. Stich, J. W. Whittaker and R. D. Britt, J. Phys. Chem. B, 2010, 114, 14178–14188 CrossRef CAS PubMed.
- D. T. Edmonds, Phys. Rep., 1977, 29, 234–290 CrossRef.
- W. Hillier and T. Wydrzynski, Phys. Chem. Chem. Phys., 2004, 6, 4882–4889 RSC.
Footnotes |
| † Electronic supplementary information (ESI) available: PSII sample preparation; data processing: baseline correction and light-minus-dark subtraction; spectral simulations; theoretical background; DFT calculations: NH3 binding modes and spatial coordinates of the S2 state models; Q-band 55Mn-ENDOR: comparison of instrumental settings; electronic structures: exchange couplings and spin states of the BS-DFT models; the MnD1–His332-imino-N interaction: Q-band three-pulse ESEEM, Q-band HYSCORE, W-band EDNMR and simulations; X-band 14N- and 15N-three pulse ESEEM experiments on the NH3-modified S2 state; exchangeable 17O species: W-band EDNMR and X-band EPR. See DOI: 10.1039/c3cp55017f |
| ‡ Differences in the experimental numbers between the Mn4O5Ca–NH3 (≥30 cm−1) and the Mn4O5Ca/Sr (≈25 cm−1) S2 states are likely due to different sample types, i.e. higher plant vs. cyanobacterial PSII with and without EtOH, respectively. |
| This journal is © the Owner Societies 2014 |