Strain relaxation and order–disorder phase transition in irradiated MgAl2O4
Anna
Kossoy†
Los Alamos National Laboratory, Bikini Atoll, Los Alamos, New Mexico, USA
First published on 18th November 2013
Abstract
MgAl2O4 spinel is widely studied in many fields of material science because of its variety of interesting properties and potential applications. The influence of cation disorder on the physical properties of MgAl2O4 makes understanding of the effects related to this disorder particularly important. It is known that, upon ion irradiation at low temperature, MgAl2O4 undergoes an order–disorder phase transition followed by amorphization. This paper reports a combined high resolution X-ray diffraction and transmission electron microscopy study elucidating the linkage between this phase transition and irradiation-induced elastic strain. Irradiations were carried out on 〈110〉 and 〈111〉-oriented single crystals of MgAl2O4 at T = 77 K with 600 keV Xe ions over a wide range of doses. The data suggests that the beginning of the order–disorder phase transition coincides with the beginning of strain relaxation. This result indicates that the volume of the new phase is slightly smaller than that of the unirradiated spinel. The dose at which the phase transformation occurs is found to be dependent on the crystal orientation, which can be attributed to both elastic and crystallographic properties.
Introduction
MgAl2O4 is an extensively investigated material in several fields of material science because of a variety of interesting physical properties and potential uses. Thus during recent years, spinel has generated interest for optical applications. Cobalt doped MgAl2O4 is a promising Q-switch material.1–3 Excellent transmittance in the infra-red (IR) range makes MgAl2O4 suitable for use as a material for IR windows in optical devices. This application motivates research into obtaining transparent polycrystalline MgAl2O4 ceramics.4 The properties of MgAl2O4 in the visible range5 make it promising for use in light emitting diodes.6 On the other hand, MgAl2O4 was a decades-long focus in nuclear material science due to its high radiation tolerance, especially as a waste form and as an inert nuclear fuel matrix.7MgAl2O4 displays varying degrees of Mg–Al antisite disorder. The degree of disorder has an effect on the physical properties of this material. Thus, it affects the optical absorption of MgAl2O4 doped with transition metals.5 Cation disorder was found to determine the exceptional radiation stability of MgAl2O4 within different irradiation regimes.7–9 It was found, by means of transmission electron microscopy (TEM), that, at low temperature, ion irradiated MgAl2O4 undergoes a disordering phase transition8,9 that takes place prior to amorphization. The transition from ordered (defective) spinel (lattice parameter 8.08 Å, space group Fd![[3 with combining macron]](https://www.rsc.org/images/entities/char_0033_0304.gif) m) to a disordered structure (lattice parameter is about half of that of spinel, space group Fm
m) to a disordered structure (lattice parameter is about half of that of spinel, space group Fm![[3 with combining macron]](https://www.rsc.org/images/entities/char_0033_0304.gif) m) is easily indicated by the disappearance of the spinel (220) and (111) reflections, which results in fewer allowed spots in diffraction patterns.8,9 The phase transition occurs by cation disordering when Mg and Al move to octahedral sites, while anions preserve a cubic close packed (ccp) arrangement. The new phase has the rock-salt structure and occurs during cryo-temperature irradiations in either stoichiometric or non-stoichiometric spinels.8–10 A similar spinel ↔ rock-salt phase transition has been observed in magnesium chromium,11 lithium manganese and lithium iron spinels, which are extensively studied due to their use in electrochemistry.12
m) is easily indicated by the disappearance of the spinel (220) and (111) reflections, which results in fewer allowed spots in diffraction patterns.8,9 The phase transition occurs by cation disordering when Mg and Al move to octahedral sites, while anions preserve a cubic close packed (ccp) arrangement. The new phase has the rock-salt structure and occurs during cryo-temperature irradiations in either stoichiometric or non-stoichiometric spinels.8–10 A similar spinel ↔ rock-salt phase transition has been observed in magnesium chromium,11 lithium manganese and lithium iron spinels, which are extensively studied due to their use in electrochemistry.12
Irradiation with energetic particles often results in a metastable state because of the large quantity of defects. The excess energy, especially the elastic energy due to irradiation-induced elastic strain, is the origin of the radiation-induced structural and microstructural modifications. The objective of the present study is to identify the changes in the structure of MgAl2O4 spinel single crystals with strain evolution over a wide dose range. This was performed by irradiating 〈111〉 and 〈110〉-oriented MgAl2O4 single crystals with doses equivalent to 0.3–28 dpa (displacements per atom) that were subsequently characterized by X-ray diffraction (XRD) that probes elastic strain variation in ion-irradiated materials (see e.g.ref. 13–17). Transmission Electron Microscopy analysis was also performed to identify microstructural and structural changes upon irradiation.
Experimental
MgAl2O4 single crystals of 〈111〉 and 〈110〉 orientations (manufactured by Union Carbide and MTI, respectively) were irradiated with 600 keV Xe ions at 77 K. Ion irradiations were carried at the Ion Beam Materials Laboratory (IBML) at Los Alamos National Laboratory (LANL) using a Danfysik 200 kV research implanter. The flux during implantation was kept below 1012 Xe cm−2 s−1 (<0.003 dpa s−1) to minimize potential beam heating effects. The samples were tilted 7° relative to the incidence beam direction in order to avoid ion channeling. Simulation of the Xe–spinel interactions was performed using the SRIM program.34 The samples are designated by the maximum deposited damage dose (see Table 1). Values of implanted Xe ion fluences were verified by Rutherford Backscattering Spectrometry (RBS) measurements that were also performed at the IBML.| Crystal orientation | Maximum dose [dpa] | Fluence [Xe cm−2] |
|---|---|---|
| 〈111〉 | 0.3 | 1.1 × 10¹⁴ |
| 1.5 | 5.5 × 10¹⁴ | |
| 3 | 1.1 × 10¹⁵ | |
| 7 | 2.6 × 10¹⁵ | |
| 9 | 3.5 × 10¹⁵ | |
| 〈110〉 | 0.3 | 1 × 10¹⁴ |
| 1.5 | 5.3 × 10¹⁴ | |
| 3 | 1 × 10¹⁵ | |
| 5 | 2.0 × 10¹⁵ | |
| 7 | 2.6 × 10¹⁵ | |
| 9 | 3.5 × 10¹⁵ | |
| 12 | 4.4 × 10¹⁵ | |
| 19 | 7.4 × 10¹⁵ | |
| 28 | 1.1 × 10¹⁶ | |
XRD measurements (see Fig. 1–3) were performed at the Institute for Fundamental Electronics (IEF – Orsay, France) using a Philips X'Pert PRO MRD diffractometer equipped with a standard Cu tube. An intense and monochromatic beam was obtained by using a multilayer mirror behind the tube followed by a four-crystal monochromator (4xGe220) in an asymmetric configuration. The resulting primary-beam divergence was ∼18 arcsec (0.005°). Symmetric θ–2θ scans and reciprocal space maps (RSMs) were recorded in the vicinity of the (444) (2θ–82.677°) and (440) (2θ–65.236°) Bragg reflections; asymmetric reflections (e.g. (444) for (110)-oriented crystals) were also probed. A detector slit, for RSMs, or a three-bounce crystal analyzer (3xGe220), for θ–2θ scans, was used to further limit the detector acceptance.
The notations used in Fig. 1–3a are based on ref. 18: (i) KN and K∥ are the normal (out-of-plane) and parallel (in-plane) components of the scattering vector K (2sinΘ/λ), respectively; (ii) H(hkl) refers to the reciprocal lattice vector for the (444) or (440) reflections; (iii) qN is defined as KN–H(hkl) and represents the deviation from the reciprocal lattice vector (which is sometimes called the reduced scattering vector); (iv) (−qN/H(hkl)) is equal to the elastic strain in the direction normal to the surface of the irradiated samples; (v) (ΔK∥/H(hkl)) indicates the width (here in degrees) of the reciprocal lattice point in the transverse direction.
TEM analysis (see Fig. 4–8) was performed at the Electron Microscopy Laboratory at LANL using a FEI Tecnai F30 operated at 300 kV. The samples were measured at room temperature. Cross-sectional samples were made by tripod polishing and subsequent Ar ion milling to electron transparency. Diffraction patterns and images were recorded under the conditions indicated in the figure captions. For selected area diffraction (SAD) patterns, the projected aperture size was 268 nm.
Results and discussion
Damage build-up determined by XRD measurements
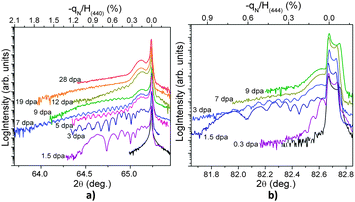
XRD patterns obtained from 〈110〉-oriented spinel single crystals are shown in Fig. 1a. The patterns exhibit typical features observed for low-energy ion-irradiated materials.14,16 First, an intense and sharp Bragg peak originating from the unirradiated, bulk part of the crystals is visible. This peak is due to the fact that the X-ray penetration depth (tenths of microns) is much larger than the irradiated layer thickness (<300 nm) and it is used as an internal strain gauge. Second, in the patterns measured on irradiated samples, an additional interference signal that comes from the irradiated layer is observed. This signal is on the low-angle wing of the curves, which indicates expanded lattice spacing in the direction perpendicular to the crystal surface. This signal has a shape that clearly evolves with the dose. A fringe pattern is observed as the dose increases up to 3 dpa. It has been shown that this pattern is due to the presence of a strain which changes with distance from the surface. Several approaches were developed in order to model the strain depth profile.19–23 Fitting results will be presented in the following section. However, it should be noted that the maximum value of strain in the irradiated layer can be obtained already from these patterns, since the maximal strain corresponds to the most distant fringe from the main Bragg peak. In the present case (i.e. for the 〈110〉 orientation), this level reaches nearly 2% at 7 dpa. Note, however, that at 5 dpa, a significant change in the XRD pattern shape is observed. A hump appears at ∼0.25% strain level while the fringe pattern starts to smooth out. At 19 dpa, the fringes totally vanish and only the hump remains with a minor shift in position.Fig. 1b displays XRD patterns for the 〈111〉-oriented crystals. Here, a double Bragg peak is observed from the unirradiated part of crystals. This finding suggests the presence of two regions with slightly different compositions (no such double-peak has been observed in rocking-curves). It has been verified that this peculiarity did not have any effect on the overall behavior upon irradiation. Actually, the XRD patterns exhibit the same evolution as that observed for the 〈110〉-oriented crystals. However, two important differences are observed. First, the most significant change in the XRD pattern shape appears at a significantly lower dose. This transition is observed between 1.5 and 3 dpa on the 〈111〉 orientation whereas it is detected between 3 and 5 dpa for the 〈110〉 orientation. Second, the maximum strain level produced in the irradiated layer amounts to ∼0.8% (instead of ∼2% for the 〈110〉 orientation). This latter finding is consistent with the fact that MgAl2O4 is an elastically anisotropic material,24 with the [110] direction softer than the [111] one. Such a crystallographic irradiation-dependent response was reported previously for yttria-stabilized c-ZrO2, MgO25,26 and Al2O3.27
Earlier studies demonstrated that the damage accumulation in irradiated spinels occurs in two steps. The first transition was attributed to the formation of a metastable disordered rock-salt structure and the second one to amorphization.8 The present work, which investigates a wide range of doses, demonstrates that damage actually accumulates in three steps. This statement holds for both crystalline orientations. The first two stages of the damage build-up, which will be called the low-dose range and intermediate-dose range, are described in detail in the following sections. The third step that occurs in the high-dose range is ascribed to amorphization of the irradiated crystals. A similar three-step process has been shown using channeling measurements in 150 keV Cs-irradiated spinel crystals.28
Damage build-up description
A typical reciprocal space map (RSM) characteristic of crystals in the low-dose range is displayed in Fig. 3a. Such a figure depicts the scattered intensity (in logarithmic scale) in the vicinity of a given Bragg reflection. The intense signal – grey colour on the map – observed at the coordinates of the unstrained material signal corresponds to the undisturbed part of the samples probed by X-rays. Also visible on the map in Fig. 3a is a spreading of the scattered intensity along the KN direction in the region of higher lattice parameter (positive −qN/H(400) values), which is obviously consistent with XRD curves presented in Fig. 1. This signal arises from the scattering of the X-ray beam by the irradiated layer. More interestingly, it should be noted that the scattered intensity is confined to a small K∥ region, even around the reflection corresponding to the damaged layer. This result strongly suggests that defects at the origin of the strain are of small dimensions (point defects or small defect clusters), i.e. no significant defect clustering occurred, which is consistent with previously reported results on e.g. irradiated zirconia.13,15
 | ||
| Fig. 3 Reciprocal space mapping (RSM) on a 〈110〉 crystal irradiated to (a) 0.3 dpa; (b) 5 dpa, symmetric scan; (c) 5 dpa, asymmetric scan. | ||
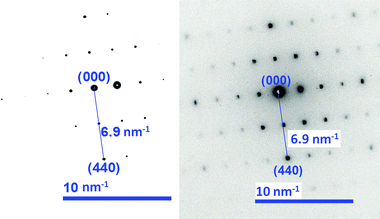
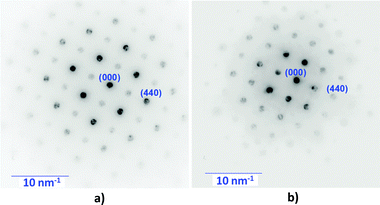
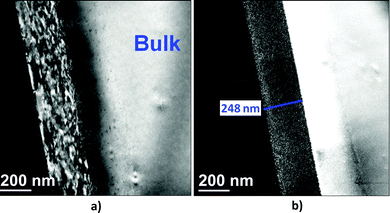
TEM analysis of samples irradiated within the low-dose region revealed that no order–disorder phase transition has taken place (see Fig. 4).
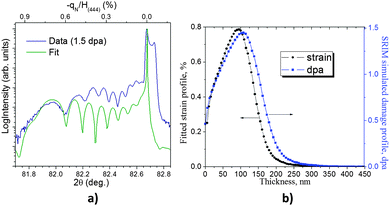
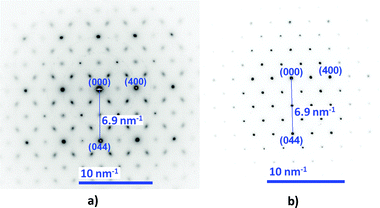
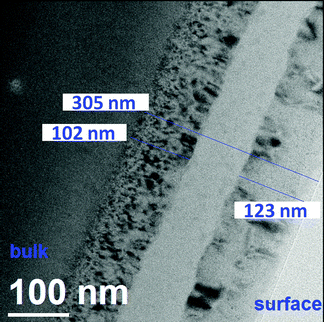
In the intermediate dose range, XRD patterns cannot be fitted with the SRIM-predicted dpa profile (nor with the Xe distribution). This is mainly because the XRD curves corresponding to this dose range are characterized by the appearance of a hump at the left side of the main Bragg peak. It is found that the hump appears near the peaks which are allowed and which are forbidden in the disordered phase (i.e. (222) and (220) spinel reflections). Therefore it does not originate from the new disordered phase, but it has to be related to defective (ordered) spinel. Indeed, the defective spinel phase is still present within the irradiated layer. Electron microdiffraction patterns (Fig. 6) demonstrate that (220) reflections, which should be absent in the disordered phase, did not vanish entirely. This finding is confirmed by TEM dark-field images recorded with (220) reflection, that show presence of spinel phase, especially in the near-surface region (see Fig. 7). The result is in agreement with previous high resolution TEM studies in which domains of untransformed spinel with a size of about 5 nm in diameter30 were seen. This defective spinel phase persists up to very high doses (e.g. 19 and 28 dpa for 〈110〉-oriented crystals). At ≥19 dpa TEM shows that the irradiated layer splits into three parts (see Fig. 8). The near-surface layer and the layer close to the bulk are single crystal and transformed into the disordered phase. However, the near-surface layer still has a residual ordered spinel phase. The embedded layer appears to be amorphous (or a mixture of amorphous zones and polycrystalline disordered-phase regions). A similar microstructure was previously reported in 〈111〉-oriented spinel implanted with 180 keV Xe to the dose of 15 and 30 dpa.30
Damage accumulation interpretation
During the irradiation process atomic displacements are created by nuclear collisions resulting in the formation of point defects or small defect clusters. Accumulation of point defects induces volume expansion and, consequently, in-plane compressive stress in irradiated material.31 As a result, a tensile strain develops along the normal direction of irradiated crystals.18 This strain increases with the fluence in the low-dose range. At higher fluences a disordered (i.e. rock-salt) phase appears. It is known that the disordered phase arises from a randomized cation redistribution on octahedral sites of Mg and Al.30 Irradiation-induced defects are “frozen-in” at cryogenic temperature. Furthermore, it is demonstrated here that the phase transition only occurs after an incubation dose. Therefore, it appears that the phase transformation process takes place by a reorganization of defects formed in the first irradiation stage. This defect rearrangement seems to occur inhomogeneously over the entire irradiated volume, as suggested by the remaining islands of untransformed material. This result is consistent with the phase transition process occurring within collision cascades. It is noteworthy that entropy increase due to disordering cannot be a key factor in the stabilization of the new phase because previous work32 revealed that the rock-salt phase reverts to the ordered spinel structure after annealing for 52 days at 1100 °C.Since the phase transformation appears to be concomitant with the strain (and stress31) relaxation, it indicates that these phenomena are related. The question that arises is whether strain relaxation is a cause or a consequence of the order–disorder phase transition. The fact that no mechanism of typical plastic relaxation (e.g. interface dislocations, amorphization) has been observed suggests that strain relaxation is rather a consequence of phase transformation. The fact that compressive stress is relieved implies that the new (disordered) phase has a smaller volume than that of the ordered (defective) spinel. In other words, transition from strained (defective) spinel to rock-salt phase induces a slight shrinkage of the unit cell. However, one should remember that the rock-salt phase does not appear at the same dose, hence not at the same strain level, for the two studied crystalline orientations. Actually, the phase transition occurs at lower doses when the crystal is oriented along the stronger direction, i.e. along the direction that exhibits smaller maximum deformation, i.e. the [111] direction. The presence of elastic energy accelerates the phase transformation.
Another reason for disordering anisotropy could lie in structure-related effects. In order to form the rock-salt phase in MgAl2O4 the Mg and Al need to be displaced from tetrahedral to octahedral sites via ion collisions. The simplified way to represent this process can be described in Kröger–Vink notations as following:
Therefore two factors can have an impact on the efficiency of the rock-salt phase formation: (i) the availability and configuration of these sites in a chosen crystallographic direction; (ii) the attraction force between two charged species that are created. Intuitively the latter works against stabilization of the rock-salt phase because attraction force favors recombination.
If viewed along the [110] or [111] direction, MgAl2O4 has different arrangements of tetrahedral and octahedral sites. Along [110], both types of crystallographic sites form rows that consist of only one site type (for convenient visualization see ref. 33). In contrast, along the [111] direction there are both types of crystallographic sites. Therefore, the process of cation mixing into octahedral sites along this direction will be more efficient. Once displaced, an atom can migrate within a row of edge-to-edge connected octahedra by one or two bonding units (mobility is limited at low temperature) increasing charge separation and thus contributing to the stabilization of the new phase. The preference of the (111) orientation to disorder could be reflected in different number of defects relative to the (110) orientation. Indeed, previous studies of MgO26 and Al2O3ߙ27 showed that the defect production rate upon irradiation varies significantly between crystallographic orientations. MgAl2O4 would therefore be an obvious candidate material for further evaluation of this effect.
Conclusions
This work demonstrates how order–disorder phase transformation in MgAl2O4 is related to relaxation of irradiation-induced elastic strain. The behavior of 〈111〉 and 〈110〉-oriented MgAl2O4 spinel single crystals under irradiation in the nuclear energy-loss regime has been investigated in a wide dose range by XRD and TEM. Owing to dramatic changes in the XRD patterns with fluence, two steps in the damage build-up are detailed (a third step ascribed to amorphization has been previously evidenced8,30). At the low dose, XRD measurements strongly suggest that small irradiation-induced defect clusters are formed and an in-plane elastic compressive stress is developed as a consequence. Consequently normal tensile strain develops and its level increases with the fluence. At a given transition dose (between 3 and 5 dpa for the 〈110〉 and 1.5 and 3 dpa for the 〈111〉 orientations), the XRD patterns change drastically. This change is a signature of the onset of the order–disorder phase transition, namely from the spinel to rock-salt structure, that is clearly revealed by the TEM analysis. The appearance of the new phase is a cause of the concomitant partial relaxation of normal tensile strain, which implies a volume change. It is demonstrated that the volume of the new phase is slightly smaller than that of irradiated spinel. Finally, the dose at which this transition takes place is found to be dependent on the crystallographic orientation. It is shown that both elastic properties and crystal structure might be at the origin of this dependence.Acknowledgements
The author wants to thank V. Kaganer from the Paul Drude Institute for Solid State Electronics, Germany for helpful comments and suggestions, Y. Wang and I. O. Usov from LANL for their help with RBS measurements, R. Dickerson from LANL for his help with TEM, J. Zhang and E. Fu from LANL for their help with irradiations, Y. Feldman from Weizmann Institute of Science, Israel for his help with preliminary measurements, S. Stepanov from Argonne National Laboratory, USA for his help with X-ray Server. XRD measurements on the Panalytical diffractometer have been performed at the nanocenter CTU-IEF-Minerve that is partially funded by the “Conseil Général de l'Essonne”. The LANL portion of this work was sponsored by the FCR&D, LDRD and Basic Energy Science of the US Department of Energy Office.Notes and references
- K. V. Yumashev, I. A. Denisov, N. N. Posnov, P. V. Prokoshin and V. P. Mikhailov, Appl. Phys. B: Lasers Opt., 2000, 70, 179–184 CrossRef CAS.
- G. Karlsson, V. Pasiskevicius, F. Laurell, J. A. Tellefsen, B. Denker, B. I. Galagan, V. V. Osiko and S. Sverchkov, Appl. Opt., 2000, 39, 6188–6192 CrossRef CAS.
- J. E. Hellstrom, G. Karlsson, V. Pasiskevicius, F. Laurell, B. Denker, S. Sverchkov, B. Galagan and L. Ivleva, Appl. Phys. B: Lasers Opt., 2005, 81, 49–52 CrossRef PubMed.
- M. Shimada, T. Endo, T. Saito and T. Sato, Mater. Lett., 1996, 28, 413–415 CrossRef CAS.
- C. Garapon, H. Manaa and R. Moncorgé, J. Chem. Phys., 1991, 95(8), 5501–5512 CrossRef CAS.
- K. Izumi, S. Miyazaki, S. Yoshida, T. Mizokawa and E. Hanamura, Phys. Rev. B: Condens. Matter Mater. Phys., 2007, 76, 075111 CrossRef.
- K. E. Sickafus, A. C. Larson, N. Yu, M. Nastasi, G. W. Hollenberg, F. A. Garner and R. C. Bradt, J. Nucl. Mater., 1995, 219, 128–134 CrossRef CAS.
- N. Yu, K. E. Sickafus and M. Nastasi, Philos. Mag. Lett., 1994, 70(4), 235–240 CrossRef CAS.
- R. Devanathan, K. E. Sickafus, N. Yu and M. Nastasi, Philos. Mag. Lett., 1995, 72(3), 155–161 CrossRef CAS.
- K. Sickafus, N. Yu, R. Devanathan and M. Nastasi, Nucl. Instrum. Methods Phys. Res., Sect. B, 1995, 106, 573–578 CrossRef CAS.
- Yu. G. Chukalkin, V. V. Petrov, R. Shtirts and B. K. Goshchitskii, Phys. Status Solidi A, 1985, 92, 347–354 CrossRef CAS.
- M. Thackeray, J. Am. Ceram. Soc., 1999, 82(12), 3347–3354 CrossRef CAS.
- S. Moll, L. Thomé, G. Sattonnay, A. Debelle, F. Garrido, L. Vincent and J. Jagielski, J. Appl. Phys., 2009, 106, 073509 CrossRef.
- A. Debelle, A. Declémy, L. Vincent, F. Garrido and L. Thomé, J. Nucl. Mater., 2010, 396, 240–244 CrossRef CAS PubMed.
- A. Debelle, S. Moll, B. Décamps, A. Declémy, L. Thomé, G. Sattonay, F. Garrido, I. Jowik and J. Jagielsky, Scr. Mater., 2010, 63, 665–668 CrossRef CAS PubMed.
- A. Debelle, L. Thomé, D. Dompoint, A. Boulle, F. Garrido, J. Jagielski and D. Chaussende, J. Phys. D: Appl. Phys., 2010, 43, 455408 CrossRef.
- A. Debelle, A. Boulle, F. Garrido and L. Thomé, J. Mater. Sci., 2011, 46, 4683–4689 CrossRef CAS PubMed.
- A. Debelle and A. Declémy, Nucl. Instrum. Methods Phys. Res., Sect. B, 2010, 268, 1460–1465 CrossRef CAS PubMed.
- (a) S. Stepanov and R. Forrest, J. Appl. Crystallogr., 2008, 41, 958–962 CrossRef CAS; (b) http://x-server.gmca.aps.anl.gov/ .
- U. Pietsch, V. Holý and T. Baumbach, High Resolution X-ray Scattering, Springler-Verlag, New York, USA, 2nd edn, 2004 Search PubMed.
- A. Boulle and A. Debelle, J. Appl. Crystallogr., 2010, 43, 1046–1052 CrossRef CAS.
- D. Shilo, E. Lakin and E. Zolotoyabko, Phys. Rev. B: Condens. Matter Mater. Phys., 2001, 63, 205420 CrossRef.
- D. Shilo, E. Lakin and E. Zolotoyabko, Appl. Crystallogr., 2001, 34, 715–721 CrossRef CAS.
- I. Suzuki, I. Ohno and O. L. Anderson, Am. Mineral., 2000, 85, 304–311 CAS.
- I. Usov, P. N. Arendt, J. R. Groves, L. Stan and R. F. DePaula, Nucl. Instrum. Methods Phys. Res., Sect. B, 2005, 240, 661–665 CrossRef CAS PubMed.
- I. Usov, J. A. Valdez and K. E. Sickafus, Nucl. Instrum. Methods Phys. Res., Sect. B, 2011, 268, 288–291 CrossRef PubMed.
- G. B. Krefft and E. P. EerNisse, J. Appl. Phys., 1978, 49(5), 2725–2730 CrossRef CAS.
- J. Jagielski and L. Thomé, Nucl. Instrum. Methods Phys. Res., Sect. B, 2007, 261, 1155–1158 CrossRef CAS PubMed.
- Y. Avrahami and E. Zolotoyabko, Nucl. Instrum. Methods Phys. Res., Sect. B, 1996, 120, 84–87 CrossRef CAS.
- M. Ishimaru, Y. Hirotsu, I. Afanasyev-Charkin and K. E. Sickafus, J. Phys.: Condens. Matter, 2002, 14, 1237–1247 CrossRef CAS.
- J. Jagielsky and L. Thomé, Vacuum, 2007, 81, 1352–1356 CrossRef PubMed.
- I. Afanasyev-Charkin, R. M. Dickerson, D. W. Cooke, B. L. Benett, V. T. Gritsyna and K. E. Sickafus, J. Nucl. Mater., 2001, 289, 110–114 CrossRef CAS.
- http://www.chemtube3d.com/solidstate/_sync(28spinel).htm .
- (a) J. F. Ziegler, J. P. Biersack and U. Littmark, The stopping and range of ions in matter, Pergamon, New York, vol. 2–6, 1985 Search PubMed; (b) http://www.srim.org .
Footnote |
| † Current address: Science Institute-University of Iceland, Dunhaga 3, Reykjavik, Iceland. E-mail: anna.kossoy@gmail.com, annaeden@hi.is; Fax: +354 552 8911; Tel: +354 694 8163 |
| This journal is © the Owner Societies 2014 |

