Synthesis of CdWO4 nanorods and investigation of the photocatalytic activity†
Di
Li
ab,
Xiaojuan
Bai
a,
Jing
Xu
a,
Xinguo
Ma
c and
Yongfa
Zhu
*a
aDepartment of Chemistry, Tsinghua University, Beijing, 100084, China. E-mail: zhuyf@mail.tsinghua.edu.cn
bSchool of Metallurgical Engineering, Xi'an University of Architecture and Technology, Xi'an 710055, People's Republic of China
cDepartment of Physics and Materials Science, City University of Hong Kong, Hong Kong, China
First published on 17th October 2013
Abstract
CdWO4 nanorod photocatalysts were synthesized by a hydrothermal method. CdWO4 nanorod photocatalysts showed highly efficient photocatalytic activity for the degradation of methylene blue under ultraviolet light irradiation. On the basis of the experiment results, the difference in photocatalytic activities of the samples was mainly attributed to surface area, surface hydroxyl groups and defects which can act as inactivation centers. Kinetic studies using radical scavenger technologies suggested that OH˙ radicals were the dominant photooxidants.
1. Introduction
Metal tungstates and molybdates, as a family of multicomponent metal oxide compounds, have been studied extensively due to their interesting structures, intriguing physical–chemical properties, as well as a wide range of applications in photoluminescence,1,2 scintillators,3,4 photochromism,5 humidity sensors,6 multiferroic materials,7 and photocatalysis.8–15 Cadmium tungstate (CdWO4) is considered to be an attractive material because of its optical, chemical and structural properties. It is well known that CdWO4 crystals with monoclinic wolframite structures have high thermal stability, high average refractive index, low radiation damage, low intrinsic background and low afterglow. They could be used in spectrometry and radiometry of radionuclides with extra low activities.16 Specifically, CdWO4 with a monoclinic wolframite structure aroused significant interest in X-ray scintillators with exceptional advantages such as high X-ray absorption coefficient, high chemical stability, high stopping power, and short decay time.17 Moreover, CdWO4 has promising potential in advanced medical X-ray detectors in computerized tomography.18The band-gap for CdWO4 was as broad as 3.8 eV, which was much larger than 3.2 eV for TiO2 and thus seems to indicate that the photo-absorption could only be limited to wavelengths shorter than that of TiO2. Nevertheless, it was well established that the broader band-gap was highly probable to give stronger redox ability that allowed higher photocatalytic performance.19 Recently, Fu et al. investigated the photocatalytic properties of monoclinic CdWO4 by UV light photodegradation of methyl orange and found that CdWO4 exhibited higher photocatalytic activity in comparison to the known semiconductors ZnWO4 and TiO2.10 Therefore, CdWO4 represented an example of a potential highly efficient photocatalytic material.20
In this work, the influence of surface area, defects and surface hydroxyl groups of CdWO4 nanorods on the photocatalytic decomposition of methylene blue have been studied. In addition, the photocatalytic activity and degradation mechanism of CdWO4 nanorods in the degradation of methylene blue under ultraviolet light irradiation were investigated in detail.
2. Experimental section
2.1. Materials
Methylene blue was of analytical reagent grade quality used without further purification. Other chemicals were commercial products of analytical grade or reagent-grade. All the solutions were prepared with distilled water.2.2. Preparation of CdWO4 nanorods
Firstly, Na2WO4·2H2O (2 mmol) was dissolved in deionized water (14 mL) completely. Under vigorous agitation, 14 mL Cd(NO3)2 solution (2 mmol) was added into the Na2WO4 solution at room temperature. The pH value of the solution was adjusted with 1 M NaOH and HNO3 (68%). Secondly, the mixture was transferred into a Teflon-lined steel autoclave of 40 mL and the autoclave was heated under autogenous pressure at a series of temperatures for 24 h. The autoclave was cooled to room temperature gradually. Finally, the white precipitate was washed by distilled water three times and dried at 60 °C in air.2.3. Characterizations
The pH value was measured by Model PHSJ-4A pH meter. Raman spectra were acquired with a Raman microspectrometer (Renishaw 1000 NR) using an Ar ion laser (514 nm). Raman spectra were measured under a microscope using a 20 objective to focus the incident excitation laser radiation into a spot of 1–2 mm or 2–3 mm diameter, respectively, and to collect the scattered light. The laser power was kept low enough to avoid heating of the samples by optical filtering and/or defocusing of the laser beam at the sample surface. Spectra were collected in the range of 1000–100 cm−1 with a resolution of 1 cm−1. X-ray diffraction (XRD) experiments were carried out using a Rigaku DMAX-2400 diffractometer with Cu Kα radiation. The size and morphologies of CdWO4 were characterized by the aid of Hitachi HT-7700 transmission electron microscope (TEM), and selected area electron diffraction (SAED) patterns were performed on a JEOL JEM-2100 electron microscope operated at an accelerating voltage of 100 kV. Fourier transform infrared spectra (FT-IR) were recorded on a Perkin-Elmer 1600 FTIR spectrometer with a KBr disk. The Brunauer–Emmett–Teller (BET) surface area was measured by ASAP 2010V5.02H. EPR measurements of radicals spin-trapped by spin-trap reagent 5,5′-dimethyl-1-pirroline-N-oxide (DMPO) (purchased from Sigma Chemical Co.) were carried out at room temperature with a JEOL ES-ED3X spectrometer equipped with a quanta-Ray Nd:YAG laser system as the irradiation source. To minimize experimental errors, the same type of quartz capillary tube was used for all ESR measurements. The EPR spectrometer was coupled to a computer for data acquisition and instrument control. Magnetic parameters of the radicals detected were obtained from direct measurements of magnetic field and microwave frequency. The room temperature photoluminescence (PL) spectra of the samples were investigated utilizing a PerkinElmer LS55 spectrophotometer. The total organic carbon (TOC) was measured with a multi N/C 2100 TOC/TN analyzer.2.4. Photocatalytic oxidative degradation
The photocatalytic activity of the CdWO4 was evaluated by MB decomposition under ultraviolet irradiation. Ultraviolet light was obtained by a 12 W Hg lamp (λ = 254 nm, the Institute of Electric Light Sources, Beijing) and the average light intensity was 1 mW cm−2. The radiant flux was measured with a power meter (the Institute of Electric Light Sources, Beijing).The photocatalytic degradation of MB in the aqueous solutions was studied by using CdWO4 as the photocatalyst under room temperature and normal atmospheric pressure. CdWO4 (50 mg) and 100 mL MB (1 × 10⁻⁵ M) aqueous solution were added into the reactor, and then stirred with a magnetic stirrer prior to irradiation with the Hg lamp at room temperature. After the reaction, the sample solution was put in a centrifuge to remove CdWO4 particles from solution. The solution obtained in this way was extracted into a quartz cell. The absorbance of the solution was measured with quartz cells every 10 min.
2.5. Terephthalic acid fluorescence probe
Hydroxyl radicals (˙OH) produced during photocatalysis could be detected by the photoluminescence (PL) technique.21,22 It is well known that OH˙ reacts with terephthalic acid (TA) and generates TAOH which emits fluorescence on the excitation of its own 312 nm absorption band.23,24 Measurements of the amount of OH˙ were performed for the CdWO4 photocatalytic reaction by means of the terephthalic acid fluorescence probe method as follows. A 100 mL aqueous solution containing 4 mmol disodium terephthalate was prepared, and then 50 mg CdWO4 was suspended in 100 mL of this solution in the reactor. This solution was stirred with a magnetic stirrer prior to irradiation with a 12 W Hg lamp at room temperature. After the reaction, the sample solution was put in a centrifuge to remove the CdWO4 from solution. The solution obtained in this way was extracted into a quartz cell. The fluorescence of the samples was measured in a quartz cell every 10 min. By comparison of the fluorescence intensity with that of a known concentration of TAOH, the amount of TAOH produced was determined. The amount of OH˙ formed in CdWO4 photocatalysis was estimated from that of TAOH by adopting the trapping factor around 426 nm.3. Results and discussion
3.1. Controlling the synthesis of CdWO4 nanorods
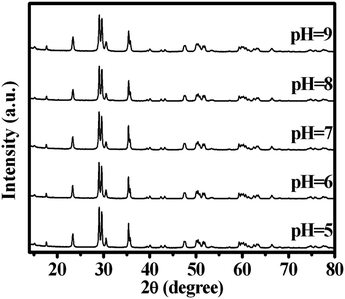
The pH value of the starting precipitate precursors played an important part in the formation of CdWO4. The precursor suspensions were adjusted to the desired pH values by adding NaOH solution and HNO3 solution, and then were treated with a hydrothermal method at 180 °C for 24 h. Fig. 1 shows the XRD patterns of CdWO4 samples prepared by the hydrothermal procedure at different pH values. When the pH value was between 5 and 9, the diffraction peaks of all the samples could be easily indexed as a pure, monoclinic crystalline phase CdWO4, which was in good agreement with the standard card (JCPDS card number: 87-1114). Further increasing the pH value of the starting precipitate precursors to 10 or decreasing the pH value of the starting precipitate precursors to 4 resulted in the product containing the other phase. The pH value of the starting precipitate precursors had a slight effect on the morphology of the CdWO4 nanorods. The microstructures of the as-prepared samples were then investigated by TEM. Fig. 2a shows the TEM micrograph for the sample prepared at pH 5, the sample contained nanorods with diameters of 30–50 nm and lengths of 150–200 nm. As the pH value was adjusted to 6, the diameter and length of the nanorods increased in size to a diameter of 50–100 nm and length of 200–300 nm (Fig. 2b). When the pH value increased to 7, the nanorods became thin. The morphology of CdWO4 nanorods obtained at pH 7 had diameters of 30–75 nm and lengths of 150–300 nm (Fig. 2c). As the pH was adjusted to 8, the CdWO4 nanorods decreased in diameter. The nanorods had diameters of 40–90 nm and lengths of 150–300 nm (Fig. 2d). Further increasing the pH value of the starting precipitate precursors to 9, the diameter and length of the nanorods increased in size. The diameter was between 50 and 110 nm and the length was between 150 and 400 nm (Fig. 2e). By analysis of SAED images (Fig. 2f), CdWO4 was found to show better crystallinity.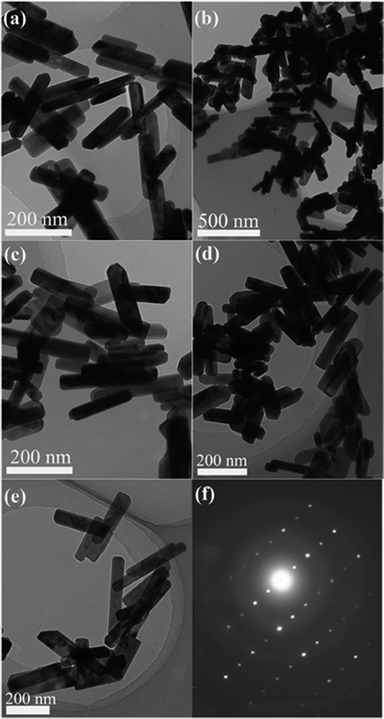 | ||
| Fig. 2 Morphologies of pH value series of CdWO4 nanorods: (a) pH = 5, (b) pH = 6, (c) pH = 7, (d) pH = 8, (e) pH = 9 and (f) its SAED pattern. | ||
3.2. Photocatalytic properties of CdWO4 nanorods
Fig. 3 shows the degradation of MB using CdWO4 nanorods prepared at different pH values. The first-order linear relationship was revealed by the plots of the ln(C/C0) vs. irradiation time (t), where C was the concentration of MB at the irradiation time t and C0 was the concentration in the adsorption equilibrium of the photocatalysts before irradiation. Via the first order linear fit, the determined reaction-rate constants k were 0.01142, 0.01531, 0.02768, 0.01697 and 0.01929 min−1, respectively, for CdWO4 nanorods prepared at pH values 5–9. The CdWO4 nanorods prepared at pH 7 showed the highest photoactivity. MB could be degraded less than 60 min. In contrast, the constant k of the bulk CdWO4 was only 0.0085 min−1. That meant the reaction constant of the highest photoactivity CdWO4 nanorods was about three times that of the bulk CdWO4. In order to further understand the mineralization properties of the photocatalyst, the TOC of MB using CdWO4 nanorods prepared at pH 7 is illustrated in Fig. S1 (ESI†). Obviously, the rate of TOC reduction was slower than that of the degradation of the dye, suggesting that the cleavage breakage of conjugated chromophore ring of MB resulted in the intermediates occurring during the photocatalytic process.25 When 82% of the dye was photodegraded, about 25% mineralization degree was reached for MB.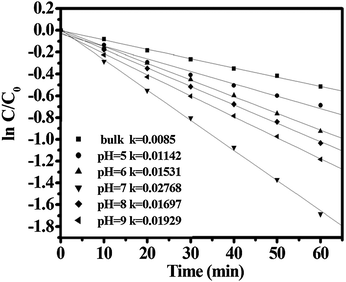 | ||
| Fig. 3 First-order plots for the photocatalytic degradation of MB using various CdWO4 nanorods prepared at different pH values for 24 h. | ||
As the photocatalysis reaction under Hg lamp, photodegradation of MB with CdWO4 occurred only via one process: a photocatalytic process. In order to differentiate direct photooxidation of MB with holes and indirect photooxidation with OH˙ radicals, experiments were carried out by adding tert-butyl alcohol to minimize the formation of OH˙ radicals.26,27 As shown in Fig. 4, the addition of a scavenger of hydroxyl radicals (tert-butanol) caused an obvious change in the degradation rate of MB, indicating that the free hydroxyl radicals were the main active oxygen species in the photochemical process. The hydroxyl radicals' photooxidation mainly governs the photocatalytic process.
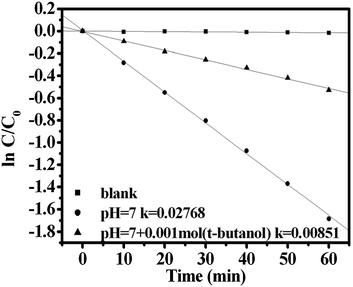 | ||
| Fig. 4 Effects of tert-butyl alcohol addition on photocatalytic degradation of MB in solutions of CdWO4 nanorods prepared at pH 7. | ||
EPR spectroscopy was an especially suitable technique for the detection of photogenerated radicals, which act as intermediates in the photocatalytic processes. Here CdWO4 nanorods in water were used to investigate the EPR signal of OH˙ at room temperature under the irradiation of a high-pressure mercury lamp. Results of the EPR signals from CdWO4 nanorods in water are shown in Fig. 5. The intensity of the EPR signal of CdWO4 nanorods obtained at pH 7 increased considerably compared with CdWO4 nanorods obtained at pH 5. Because the EPR signal can be ascribed to OH˙,28 this means that there was more photogenerated OH˙ on the surface of the CdWO4 nanorods obtained at pH 7.
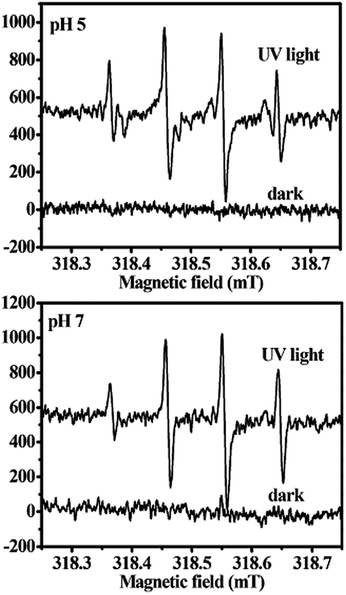 | ||
| Fig. 5 EPR spectra of CdWO4 nanorods prepared at pH 5 and 7 under UV light irradiation (DMPO as the radical trapper). | ||
The formation rate of OH˙ at the photo-illuminated sample–water interface also could be detected by the PL technique using TA as a probe molecule. TA readily reacted with OH˙ to produce the highly fluorescent product, TAOH. Fig. 6 shows the fluorescence spectra observed for a solution of the CdWO4 obtained at pH 7 suspension containing 4 mM disodium terephthalate irradiated for various duration times. Since the observed fluorescence spectra were identical to that of TAOH, it was concluded that the TAOH was from TA by the reaction with OH˙, which formed on the surface of the CdWO4 nanorods.29Fig. 6 represents the fluorescence intensity as a function of the duration of irradiation. The fluorescence intensity increases with irradiation time under UV light irradiation. This suggested that the amount of OH˙ produced in the photoirradiated CdWO4 suspension was estimated by measuring the amount of TAOH, which was generated by the reaction of OH˙ with TA.
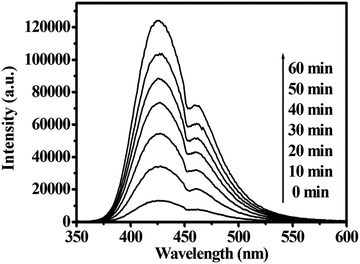 | ||
| Fig. 6 The changes in the fluorescence spectra of the irradiated CdWO4 (0.5 g L−1) suspension containing 4 mM disodium terephthalate after various irradiation periods. | ||
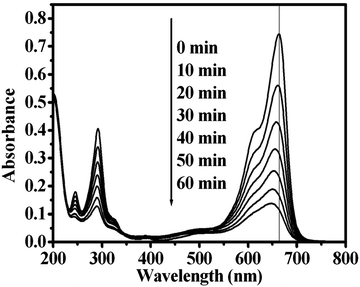
Fig. 7 shows that the spectral band at 664 nm blue-shifts during the course of the photodegradation. As weak electron-donor substituents, methyl groups could facilitate attack on MB by OH˙ in the demethylation process; this is also likely to be a major step in the photocatalytic oxidative degradation of MB.30 Examination of the spectral variations in Fig. 7 suggest that MB was N-demethylated in a stepwise manner (methyl groups are removed one at a time as confirmed by the gradual peak wavelength shifts toward the blue region), with cleavage of the MB chromophore ring structure occurring concomitantly. N-demethylation, deamination and oxidative degradation takes place during the photocatalyzed degradation of MB.30 Mixtures of N-demethylated intermediates yielded spectra with broad absorption bands in the visible range.
3.3. Mechanism of photocatalytic activity
The photocatalytic activity of semiconductor oxides was mainly governed by surface area, defects and surface hydroxyl groups. In this work, the surface area of the CdWO4 nanorods obtained at different pH values is shown in Table 1. Defects in the crystal structure were considered the main factor influencing the photocatalytic activity in the present system. In general, lattice defects might act as recombination centers for photoinduced electrons and holes, reducing the total photocatalytic activity significantly.| pH value | 5 | 6 | 7 | 8 | 9 |
|---|---|---|---|---|---|
| BET surface area (m2 g−1) | 11.38 | 9.73 | 13.33 | 9.36 | 12.66 |
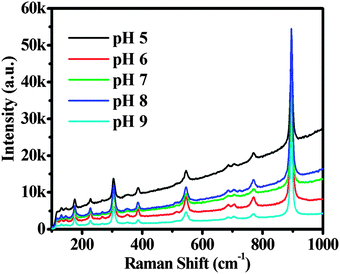
Raman analyses of the samples were performed to examine the defects in the CdWO4 nanorods. Raman spectra of the CdWO4 samples obtained at different temperatures are shown in Fig. 8. As for the monoclinic phase, the corresponding spectrum in Fig. 8 showed only one strong vibration at 896 cm−1 and several weak vibrations at 771, 687, 545, 515, 386, 348, 305, 269, 229 and 176 cm−1. The vibration modes located at 896 and 386 cm−1 correspond to the normal W–O vibrations of the WO6 octahedra, while the modes located at 771 and 687 cm−1 involves motions of the WO6 octahedra against the Cd2+.31,32 Bands in the range of 500–600 cm−1 are characteristic of symmetric W–O–W stretching modes.31 The medium strong peak at 305 cm−1 is derived from the symmetric stretching of CdO6 octahedra, and the other bands in the 300–150 cm−1 region can be assigned to the modes associated with Cd–O stretching.32 The Raman intensities of samples obtained at pH 8 were the highest of all, so there were the fewest defects in the CdWO4 nanorods prepared at pH 8.33 In general, defects might act as recombination centers for photoinduced electrons and holes, reducing the total photocatalytic activity significantly. Hence, defects were considered as an important factor influencing the photocatalytic activity. The decrease in photocatalytic activity influenced by the defects in the lattice was due to the fact that defects appeared to trap carriers so as to assist the recombination of photogenerated e−–h+ pairs.
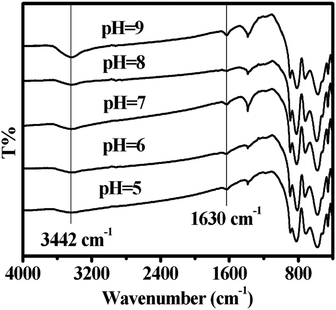
FT-IR analyses of the CdWO4 nanorods were performed to practically examine the surface hydroxyl groups on the CdWO4 nanorods. As shown in Fig. 9, the peaks around 3442 cm−1 and 1630 cm−1 were OH stretching vibrations and bending vibrations. During the hydrothermal synthesis process, a certain amount of surface hydroxyl groups existed on the sample. The surface hydroxyl groups' intensities of the CdWO4 nanorods obtained at pH 9 were the highest of all, indicating the number of surface hydroxyl groups was the greatest at the surface of CdWO4 nanorods obtained at pH 9. On the surface of CdWO4 nanorods, the holes were trapped by surface hydroxyl groups and formed OH˙ radicals.34 The FT-IR analyses were in accord with the EPR results from the CdWO4 nanorods. The higher surface hydroxyl group intensities were, the more photogenerated OH˙ on the surface of the CdWO4 nanorods there was. Large numbers of OH˙ on the surface of the CdWO4 nanorods led to the rapid oxidation of MB. As a result, the surface hydroxyl groups played a very important part in the photocatalytic activity.
Considering the difference of the BET surface area between samples, the difference in the photocatalytic activity may be attributed to surface area, defects and surface hydroxyl groups. The surface hydroxyl groups' intensities of CdWO4 nanorods obtained at pH 9 were higher than the CdWO4 nanorods obtained at pH 7. But the surface area of CdWO4 nanorods obtained at pH 7 was the largest of all. It meant a relatively large reaction area. Additionally, Raman intensities of CdWO4 obtained at pH 7 were higher than for CdWO4 obtained at pH 9. It meant there were fewer defects in the CdWO4 obtained at pH 7 than pH 9. So the photocatalytic activity of CdWO4 nanorods obtained at pH 7 was higher than CdWO4 nanorods obtained at pH 9. The CdWO4 nanorods obtained at pH 9 had much larger surface area and much higher surface hydroxyl group intensities than CdWO4 nanorods obtained at pH 8. So the photocatalytic activity of CdWO4 nanorods obtained at pH 9 was higher than CdWO4 nanorods obtained at pH 8. The surface area and surface hydroxyl groups of CdWO4 nanorods obtained at pH 8 was similar to CdWO4 nanorods obtained at pH 6, but the defects intensity which was confirmed by the Raman results showed CdWO4 nanorods obtained at pH 8 had the fewest defects. So the photocatalytic activity of CdWO4 obtained at pH 8 was higher than CdWO4 obtained at pH 6. The defect intensity of CdWO4 nanorods obtained at pH 5 was the highest of all, and they also had the fewest surface hydroxyl groups. So the photocatalytic activity of CdWO4 nanorods obtained at pH 5 was the lowest of all.
4. Conclusions
In conclusion, the photocatalytic properties of CdWO4 nanorods were investigated under ultraviolet light irradiation in detail. The surface area, surface hydroxyl groups and lattice defects were considered as important factors influencing the photocatalytic activity. Large surface area meant a relatively large reaction area. The surface hydroxyl groups could react with holes and form OH˙ radicals. The defects might act as recombination centers for photoinduced electrons and holes, reducing the total photocatalytic activity.Acknowledgements
This work was partly supported by National Basic Research Program of China (973 Program) (2013CB632403), National High Technology Research and Development Program of China (2012AA062701) and Chinese National Science Foundation (20925725, 21301135 and 51102150).Notes and references
- Y. G. Su, L. P. Li and G. S. Li, Chem. Mater., 2008, 20, 6060 CrossRef CAS.
- G. S. Yi, B. Q. Sun, F. Z. Yang, D. P. Chen, Y. X. Zhou and J. Cheng, Chem. Mater., 2002, 14, 2910 CrossRef CAS.
- V. B. Mikhailik, H. Kraus, G. Miller, M. S. Mykhaylyk and D. Wahl, J. Appl. Phys., 2005, 97, 083523 CrossRef.
- M. Nikl, Meas. Sci. Technol., 2006, 17, R37 CrossRef CAS.
- K. Fukuda, K. Akatsuka, Y. Ebina, R. Ma, K. Takada, I. Nakai and T. Sasaki, ACS Nano, 2008, 2, 1689 CrossRef CAS PubMed.
- W. M. Qu, W. Wlodarski and J. U. Meyer, Sens. Actuators, B, 2000, 64, 76 CrossRef CAS.
- Y. X. Zhou, Q. Zhang, J. Y. Gong and S. H. Yu, J. Phys. Chem. C, 2008, 112, 13383 CAS.
- L. Zhou, W. Z. Wang, H. L. Xu and S. M. Sun, Cryst. Growth Des., 2008, 8, 3595 CAS.
- S. Y. Song, Y. Zhang, Y. Xing, C. Wang, J. Feng, W. D. Shi, G. L. Zheng and H. J. Zhang, Adv. Funct. Mater., 2008, 18, 2328 CrossRef CAS.
- D. Ye, D. Z. Li, W. J. Zhang, M. Sun, Y. Hu, Y. F. Zhang and X. Z. Fu, J. Phys. Chem. C, 2008, 112, 17351 CAS.
- F. Amano, A. Yamakata, K. Nogami, M. Osawa and B. Ohtani, J. Am. Chem. Soc., 2008, 130, 17650 CrossRef CAS PubMed.
- M. Shang, W. Z. Wang and H. L. Xu, Cryst. Growth Des., 2009, 9, 991 CAS.
- L. W. Zhang, Y. J. Wang, H. Y. Cheng, W. Q. Yao and Y. F. Zhu, Adv. Mater., 2009, 21, 1286 CrossRef CAS.
- Y. Zhao, Y. Xie, X. Zhu, S. Yan and S. X. Wang, Chem.–Eur. J., 2008, 14, 1601 CrossRef CAS PubMed.
- Y. Zheng, J. Wu, F. Duan and Y. Xie, Chem. Lett., 2007, 520 CrossRef CAS.
- H. Wang, X. Ma, X. Qian, J. Yin and Z. Zhu, J. Solid State Chem., 2004, 177, 4588 CrossRef CAS PubMed.
- C. D. Greskovich, D. Cusano, D. Hoffman and R. J. Riedner, Am. Ceram. Soc. Bull., 1992, 71, 1120 CAS.
- V. A. Pustovarov, A. L. Krymov, B. V. Shulgin and E. I. Zinin, Rev. Sci. Instrum., 1992, 63, 3521 CrossRef CAS.
- T. Yan, L. Li, W. Tong, J. Zheng, Y. Wang and G. Li, J. Solid State Chem., 2006, 184, 357 CrossRef PubMed.
- W. Tong, L. Li, W. Hu, T. Yan and G. Li, J. Phys. Chem. C, 2010, 114, 1512 CAS.
- Q. Xiang, J. Yu and P. K. Wong, J. Colloid Interface Sci., 2011, 357, 163 CrossRef CAS PubMed.
- K. Ishibashi, A. Fujishima, T. Watanabe and K. Hashimoto, Electrochem. Commun., 2000, 2, 207 CrossRef CAS.
- J. T. Mason, P. J. Lorimer, M. D. Bates and Y. Zhao, Ultrason. Sonochem., 1994, S91, 1 Search PubMed.
- A. W. Armstrong, A. R. Facey, W. D. Grant and G. W. Humphreys, Can. J. Chem., 1963, 41, 1575 CrossRef.
- R. Shi, Y. Wang, D. Li, J. Xu and Y. Zhu, Appl. Catal., B, 2010, 100, 173 CrossRef CAS PubMed.
- L. Zhang, H. Cheng, R. Zong and Y. Zhu, J. Phys. Chem. C, 2009, 113, 2368 Search PubMed.
- R. Shi, G. Huang, J. Lin and Y. Zhu, J. Phys. Chem. C, 2009, 113, 19633 CAS.
- X. Bai, L. Wang and Y. Zhu, ACS Catal., 2012, 2, 2769 CrossRef CAS.
- T. Hirakawa and Y. Nosaka, Langmuir, 2002, 18, 3247 CrossRef CAS.
- T. Zhang, T. Oyama, A. Aoshima, H. Hidaka, J. Zhao and N. Serpone, J. Photochem. Photobiol., A, 2001, 140, 163 CrossRef CAS.
- R. Lacomba-Perales, D. Errandonea, D. Martinez-Garcia, R. Hernández, S. Radescu, A. Mujica, A. Muñoz, J. C. Chervin and A. Polian, Phys. Rev. B: Condens. Matter Mater. Phys., 2009, 79, 094105 CrossRef.
- M. Daturi, G. Busca, M. M. Borel, A. Leclaire and P. Piaggio, J. Phys. Chem. B, 1997, 101, 4358 CrossRef CAS.
- T. Xu, X. Zhao and Y. Zhu, J. Phys. Chem. B, 2006, 110, 25825 CrossRef CAS PubMed.
- Y. Nakaoka and Y. Nosaka, J. Photochem. Photobiol., A, 1997, 110, 299 CrossRef CAS.
Footnote |
| † Electronic supplementary information (ESI) available. See DOI: 10.1039/c3cp53403k |
| This journal is © the Owner Societies 2014 |

