Theoretical simulation of the ion current rectification (ICR) in nano-pores based on the Poisson–Nernst–Planck (PNP) model
Jingtao
Wang
,
Minghui
Zhang
,
Jin
Zhai
* and
Lei
Jiang
Key Laboratory of Bio-Interfacial Science and Technology of Ministry of Education, School of Chemistry and Environment, Beihang University, Beijing 100191, P. R. China. E-mail: zhaijin@buaa.edu.cn
First published on 21st October 2013
Abstract
Ion current rectification is an important phenomenon for diode-like nano-channels, which can give the ion-selectivity of the channel. Using the PNP model for theoretical simulation can help to investigate the ICR properties, as well as to calculate the rectification ratio and profile of ion concentration along the channel. In this review, we will present the main factors that will influence the ICR effect, which are the surface charge density, the electrolyte solution concentration gradient, and the shape or geometry of the nano-pore. The applications of the PNP model used for the theoretical simulation on these factors will also be discussed.
1 Introduction
The issue of ion transport in nanometer-sized channels has been studied by many researchers to understand and mimic the ion-selectivity of the biological membrane.1,2 The most important feature in such special nano-fluidic systems is the Ion Current Rectification (ICR), which is observed to be a non-linear current–voltage response when switching the applied voltage on the nano-channel.3 The high asymmetry of the ion conduction shows clearly a preferential direction for ion flow in the synthetic nano-fluidic channel that was initially discovered in biological membranes, which is usually called the ion-selectivity. In recent years, the prerequisites of ICR have been proven, both experimentally and theoretically, to be the presence of a surface charge on the inner wall of the channel and the fact that the characteristic length scale of the channel is on the order of the Debye screening length.4–6Fortunately, by using finite element analysis, advanced computational algorithms allow theoretical computation to simulate the ICR phenomenon. With the conditions set in the experiments, simulation can give the calculated results, in terms of I–V curves and profiles of ion concentration, which could be in contrast to the experienced results. Furthermore, theoretical computation can achieve the extreme conditions where experiments could not, taking regularly variational surface charge distribution as an example.7 Thus, theoretical calculation can give a guide of experience and verification of the experimental results. To achieve these points, several theoretical models have been established8 to describe and calculate the ICR effect in such diode-liked nano-channels. According to Zuzanna S. Siwy,8,9 the models of ICR are all based on a hypothesis that the diameters of the pores are comparable to the thickness of the electrical double layer (EDL). An electrostatic model based on the concepts of a rocking ratchet and an electrostatic trap was firstly used to describe the rectification observed in asymmetric nano-pores. Considering a cation moving along the pore axis and interacting with negative charges on the pore wall, and the pore being sufficiently narrow (comparable to EDL), the electrical potential of the cation at a given position can be calculated. For conical nano-pores, without any voltage applied from the outside, the profile of the internal potential is like a ratchet potential. Assuming the superposition of the external voltage with the internal electric field, the electrostatic trap of cations is formed with positive voltages, causing an off state of the pore, while negative voltages do not. This will lead to the enrichment of cations and low conductance near the pore tip, then the rectification of the ion current. Another model of ICR has been developed by Dietrich Woermann based on the electrochemical properties of the tip of a conical nano-pore.10,11 The pore has been divided into three regions, and the tip region at the small opening where the influence of the surface charge on the ion concentrations is the strongest has a very high transference number for cations (negatively charged pore). Under the effect of the external voltages, the cations are forced to move from the high transferred region to lower ones, or the opposite case (positive or negative voltage). With a semi-quantitative formula that is given by Woermann, it is possible to predict the I–V curve as well as the ICR. However, the most famous quantitative description of ICR is the Poission and Nernst–Planck model (PNP) developed by Cervera et al.12 Based on the Poisson equation that describes the electrostatics, the Nernst–Planck equation for the ion motion and the continuity equations, one can calculate the average ion concentrations and electrical-potential profiles within the pore, as well as the I–V curve. The inputs of this model for the simulation are not difficult to be determined, which are simply the boundary conditions in the nano-channel. Besides, this model can give the calculation for any shape of nano-channel if one can provide the mathematical description of the channel. Thus, this universal model, which is easily manupulated and has been well developed, is widely used by later researchers to study the main factors that influence the ICR.8,13,14
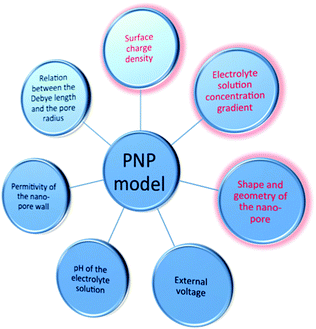
Fig. 1 shows the factors that may influence the ICR and could be studied by applying the PNP simulation, including surface charge density, electrolyte solution concentration gradient, shape or geometry of the nano-pore, external voltage, pH of the electrolyte solution, permittivity of the nano-pore wall, relation between the Debye length and the pore radius. The first three factors mentioned above (written in red in Fig. 1) are more investigated by researchers, and in this review, we present an overview of the applications of the PNP model on these three factors.
2 The quantitative description of ICR: the PNP model
As mentioned above, the model developed by Cervera et al.12 is based on the Poisson and Nernst–Planck equations and allows the calculation of realistic profiles of average concentration and electrical potential along the pore. Fig. 2 shows the sketch of the system under study.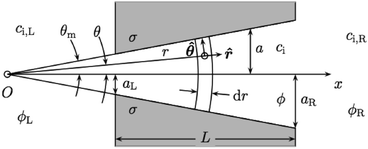 | ||
| Fig. 2 Sketch of the system under study (without scale).12 | ||
This system includes a polymeric membrane and two solutions of the same uni-univalent electrolyte that are separated by this membrane. On this membrane there is a conical nano-pore of thickness L and on the pore wall there are charges homogeneously distributed, with σ being the surface charge density. The parameters that define the system are: aL and aR are the radius at the left and right border between which the radius increases linearly; ci,j is the concentration of species i (i = + for cations and i = − for anions) in the bulk of solution j (j = L for the left solution and j = R for the right solution); ci (i = +, −) and ϕ denote, respectively, the local concentration of species i and the local electrical potential in RT/F units (R is the gas constant, T is the absolute temperature and F is the Faraday constant) within the pore; cj and ϕj (j = L, R) refer to the concentration of the electrolyte and the electric potential in the bulk of solution j, respectively; θm is the pore angle (tanθm = (aR − aL)/L). The hypotheses are below: the external solutions are assumed to be ideal and perfectly stirred; the whole system is considered to be isothermal and at steady state; the electroosmotic and finite size effects are not considered.
The electric potential denoted by the applied voltage satisfies the Poisson eqn (1):
 | (1) |
| Ji = −Di(∇ci + zici∇ϕ), i = +, − | (2) |
| ∇·Ji = 0 | (3) |
However, the pore angle is set to be very small θm ≈ 1.4°, since the nano-pore is 12 μm long and the radius of the openings at the tip and the base side are 5 and 300 nm, respectively. With this, Cervera et al. assume that the ionic fluxes have only the radial components, and the access resistance is neglected since L ≫ aL, aR. Using the finite element method to solve these three equations with the appropriate boundary conditions can give the electric potential and average ion concentration distribution within the pore, as well as the ion fluxes. There may not be the effect of discretization of nano scale because the FEM (Finite Element Method) segments the nano-pore into a large amount of sub-elements that have the scale of 10−12 m. The electric potential and ion concentration of each sub-element are calculated. When doing the integration to obtain the “macroscopic” ion current, the discretization could be ignored. Fig. 3 (left) shows the reproducible I–V curve calculated by Cervera with respect to the experimental data of Siwy,15 while Fig. 3 (right) shows the calculated average ionic concentrations and potential profiles vs. the coordinate x along the pore symmetry axis. The ion profiles indicates that at zero bias (right-a), the concentration of counter-ion, K+, is higher than that of Cl− in the nanopore, especially close to the pore tip, due to strong electrostatic interactions between charged walls and ions. When an external voltage is applied with the direction of electric field being from the pore tip to the base (right-b), both K+ and Cl− ion concentrations increase throughout the nanopore and enrichment occurs at the tip region. These enrichments result in the increase of ion conductance and will cause the ion current rectification. On the contrary, if the electric field is in the opposite direction, both types of ions in the nano-pore are depleted, which results in the decrease of conductance.
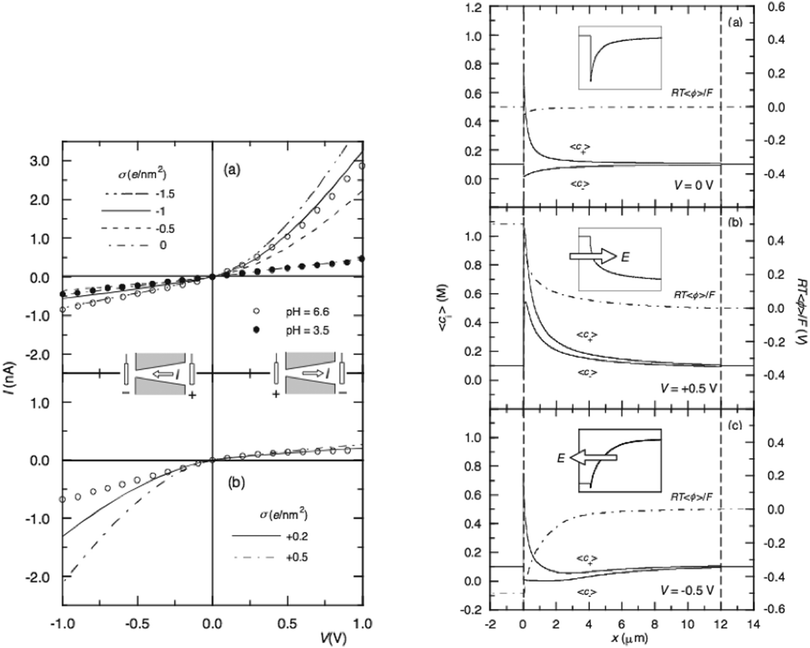 | ||
| Fig. 3 Left: experimental (circles) and theoretical (curves) results for the negatively (a) and positively (b) charged nano-pore. Right: average ion concentrations and electrical potential profiles at V = 0 V (a), V = 0.5 V (b) and V = −0.5 V (c) for the case σ = −1 e nm−2. The insets show the tip region magnified.15 | ||
Thus, by varying the parameters, for instance the surface charge density, that are defined in the PNP equations or the boundary conditions to investigate the influence factors of ICR becomes possible, and profiles of the local electrical potential and ion concentration will be provided to understand the origin of the ion-selectivity.
3 Applications of the PNP model to study the factors of ICR
Being demonstrated by several experiments,16 in PNP equations the parameters such as the surface charge density, the pore angle, the concentration of electrolyte solution, and the shape of the nano-pore, could strongly impact the ICR. By varying one of these parameters as the control to study their influences on the I–V curve or the profiles of ion concentration or electrical potential, many researchers have succeeded in finding out under what conditions a strong ICR and high rectification ratio could be achieved. Vlassiouk et al.17 have analyzed the dependence of the ion current and selectivity in a single nanochannel, defined as the ratio of the difference in currents of majority and minority carriers (I+ − I−) to the total current carried by both cation and anion (I+ + I−), on the channel length and diameter, electrolyte concentration, applied bias as well as the surface charge of the channel walls. They have found out that to achieve the greatest ionic selectivity close to 1, the channels should possess not only a very small diameter (and highly charged walls) but also have to be quite long. Even for nano-channels with a 4 nm radius, the maximum selectivity value is reached only for lengths greater than 1 μm. Also, a large applied voltage can decrease the performance of ionic filters. Nevertheless, even in ultrashort nano-pores (ratio between length and radius close to 1), high selectivity can be observed at low biases.There are similar numerical study results,13,18,19 which concerns the relative permittivity of the dielectric membrane, the ratio of the tip radius to the Debye length, and the surface charge density of the nano-pore on the ICR in a conical nano-pore. It has been found that the ICR is maximized at an intermediate κRt (1 < κRt < 4), defined as the ratio of the tip radius to the Debye length, and an intermediate surface charge density of the nano-pore (−0.1 C m−2 < σ < 0.1 C m−2). The maximum rectification ratio will be achieved at κRt = 3 and σ = −0.091 C m−2. Besides, the polarization effect of a dielectric nano-pore tends to suppress the preferential ionic current, which thus diminishes the ICR. In addition, the polarization effect becomes dominant at a relatively low surface charge density of the nano-pore and relatively thick electrical double layer. Therefore, the ICR in a conical nano-pore could be tuned by controlling the relative permittivity of the dielectric membrane.
Here we will present several specific works among of all the applications of the PNP model on numerical study. Different factors that influence the ICR will be discussed.
3.1 Effect of the surface charge density to the ICR
The surface charge distribution is found to be an indispensable factor of the ICR. In the experiments of gold nanotubes realized by Siwy,15 there will not be ICR without surface charge. Even in conical nano-pores, an inhomogeneous surface charge distribution will cause a high rectification ratio.20In the study of Xinwei Wang et al.,21 they used the PNP model to investigate the ICR behavior of partially charged nanotubes and nano-pores. Fig. 4a shows the nanotube sample used in the calculation and the results in terms of ion concentration profile along the channel (positive and negative voltage applied) and I–V curve. The surface charge is set on the left hand side in the nanotube. It is obvious that the ion concentration is influenced by the surface charge, as in the left half charged region the ion concentrations of cation and anion are different (solid triangle refers to the cation and hollow triangle refers to the anion) while in the right half neutral region they are the same value. Fig. 4b shows the conical nano-pore sample and the calculated rectification ratio as a function of the charge distribution. In the conical nano-pore, the total length of the pore is fixed at 1000 nm. Only the first x nm region (near the tip mouth) is homogeneously negatively charged, and the remaining part is neutral. The rectification ratio remains constant when x is larger than 200 nm, so that it can be seen that it is the surface charge near the tip region that influences the rectification.
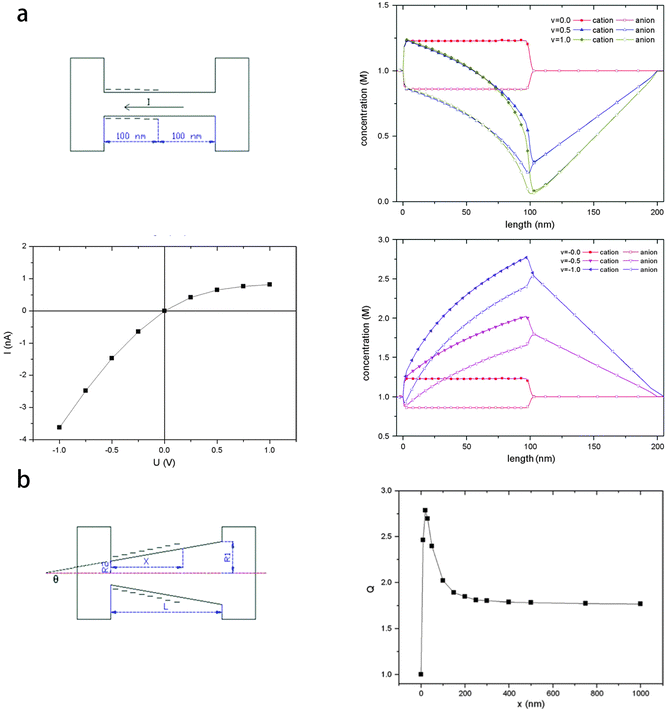 | ||
| Fig. 4 (a) The nanotube sample, ion concentration profile along the pore when positive or negative voltage is applied, I–V curve. (b) The conical nano-pore sample, the rectification ratio as a function of charge distribution.21 | ||
They have also provided an explanation of the mechanism of ICR, which can be concluded that it is the ionic enrichment and depletion under external voltage with different polarities that causes the ICR. In cylindrical nano-channels (Fig. 4a), it is the inhomogeneous surface charge distribution that causes the different ionic conductance in the charged area and non-charged area. With an external voltage, the enrichment and depletion of ions occurs due to the inhomogeneous conductance distribution. For the conical nano-pores (Fig. 4b), the lower radius near the pore tip makes a higher interaction between the surface charge and the ion flow, so that it is the surface charge near the pore tip that is mostly responsible for the ICR.
Dragoş Constantin20 has introduced an experimental method to fabricate a conical nano-pore with a surface charge distribution schematically shown in Fig. 5a. In the nano-pore, the region near the tip is positively charged while the remaining part is negatively charged. The experimental results show that the rectification ratio of this system equals 217 at 5 V.22 The rectification ratio of the devices with uniform surface charge distribution is one order of magnitude smaller than the one obtained from this system. They have build up the PNP model of this system and the surface charge distribution is shown in Fig. 5b. The transition zone is defined as the region between the two distinct regions with positive and negative charges and is determined by its width w, while the zero charge point r0 is the position of zero charge along the nanopore axis. Fig. 5c shows the calculated results of the I–V curve of this system for various values of the r0 parameter when w = 100 nm. The rectification ratio is calculated at 2 V. It is remarkable that a small amount of positive charge in the tip of the pore reverses the direction of rectification and changes the devices from mono-polar to bipolar. Fig. 5d shows the rectification ratio of this system as a function of r0 parameter for various thicknesses of the transition zone w at 2 V. The rectification ratio increases steeply as we move r0 inside the pore along its axis, reaches a maximum, and decreases to a value lower than 10 when r0 is located at the base of the pore. To conclude, the rectification ratio of a conical nano-pore can reach 103 with precise bipolar surface charge control. The width and the position of the transition zone are parameters that influence very strongly the rectification properties of nano-fluidic diodes.
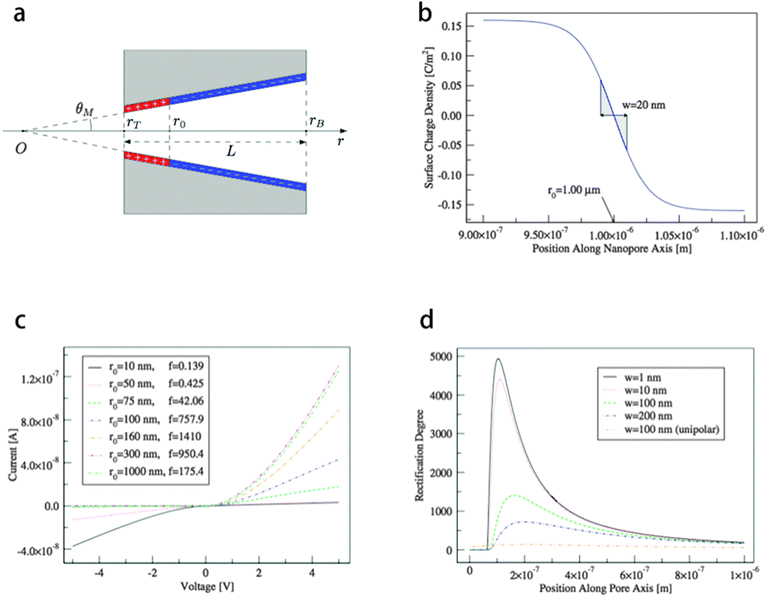 | ||
| Fig. 5 (a) Pore geometry with representation of surface charge distribution. (b) Surface charge distribution used in calculations with w, the width of the transition zone, and r0, the position of the zero charge point. (c) I–V curve for various values of the r0 parameter when w = 100 nm. The rectification ratio is calculated at 2 V. (d) Rectification ratio as a function of r0 parameter for various thicknesses of the transition zone w at 2 V.20 | ||
In the work of Shizhi Qian et al.,23 they have considered nano-pores with surface charge distribution varying linearly in the axial direction, and investigated the influence of these linear non-uniformities on the ionic-current rectification. The linearly varying immobile surface-charge density is assumed as
 | (4) |
 is identical to the charge density at the midpoint between the tip and the base. The magnitude of A is a measure of the surface-charge non-uniformity. It is to be noted that for A > 1 (A < −1) the sense of the surface charge near the tip (base) of the nano-pore is reversed, which is like the bipolar surface charge distribution in the study of Dragoş Constantin.20Fig. 6a shows the I–V curve with such linear surface charge. The surface charge density is uniform when A = 0, and with the negative average value it increase (decreases) linearly from the tip to the base A < 0 (A > 0). Fig. 6b depicts the rectification ratio as function of the applied voltage for the case shown in Fig. 6a. Compared to a nano-pore with a uniform surface charge, the ionic current flowing from the tip toward the base is enhanced when the negative surface charge near the tip is increased, while the magnitude of the current is reduced when the polarity of the applied voltage is reversed, resulting in a higher rectification. On the contrary, the ionic current flowing from the tip toward the base of the nano-pore is smaller than that of the reversed electric field when the surface charge near the tip is lower, especially when the sign of the surface charge near the tip is reversed.
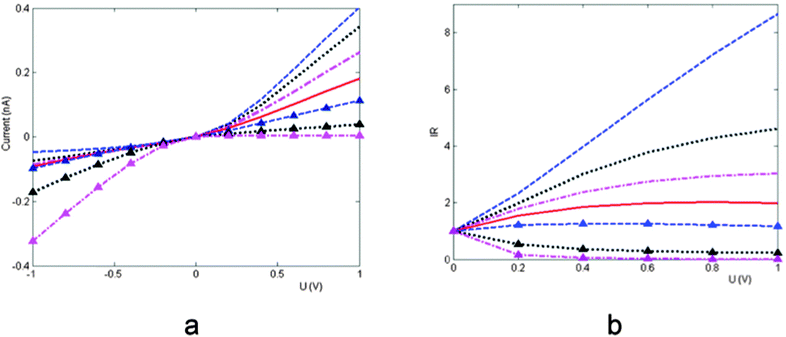 | ||
Fig. 6 (a) I–V curve with a linear surface charge distribution. The dashed line, dotted line, dash-dotted line, solid, dashed line with triangles, dotted line with triangles, and dash-dotted line with triangles represent, respectively, A = −1.5, −1, −0.5, 0, 1, 1.5. ![[small sigma, Greek, macron]](https://www.rsc.org/images/entities/i_char_e0d2.gif) w = −0.01 C m−2. (b) Rectification ratio as a function of the applied potential for the case shown in (a).23 w = −0.01 C m−2. (b) Rectification ratio as a function of the applied potential for the case shown in (a).23 | ||
Lin Wang et al.24 have also reported a method to tune the ICR rectification behavior through a conical nano-pore fabricated with the track-etching technique by changing the surface charge properties of the pore wall. The sign of the surface charge could be inverted near the tip, which would bring significant rectification behavior. Simulation with the PNP model is done just to qualitatively explain the experimental observations. More accurate parameters should be determined to obtain the quantitative predictions of this system. Besides, more specific surface charge distributions are studied by P. Ramirez et al.7 The comprehensive set of one-dimensional distributions including the skin, core, cluster, and asymmetric case are shown in Fig. 7. Thus, with the developing experimental method, the controlling of surface charge could be the most important technique to achieve high ion selectivity. As a result, more detailed simulations should be done to guide the experiences.
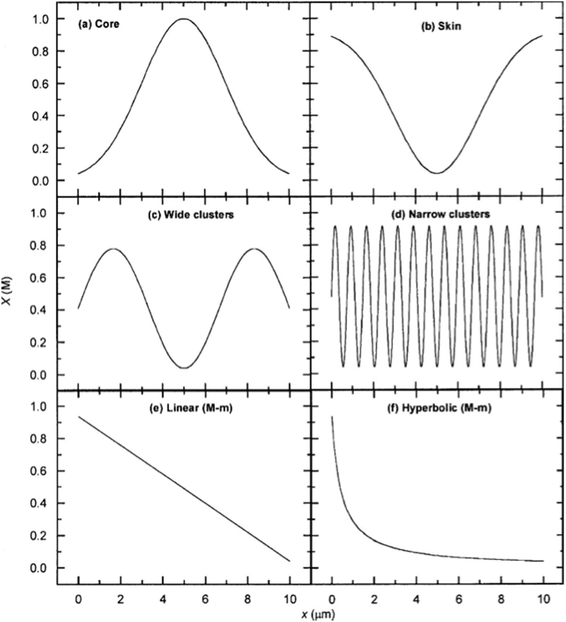 | ||
| Fig. 7 Six surface charge distributions studied by P. Ramirez et al.7 | ||
3.2 Effect of the electrolyte solution concentration gradient on the ICR
Nano-channels serving as chemical delivery devices are usually placed between two ionic solutions of different concentrations.25,26 Asymmetric ionic flux is observed in such circumstances with the surface charge set on the walls of the nano-pore. Studies have been realized by many researchers investigating the effect of the solution concentration on the ionic current rectification behavior. Lijing Cheng et al.27 have experimentally studied the asymmetric ionic flux in cylindrical silica nano-channels with homogeneous surface charge density, but placed between the asymmetric ion concentrations. They have found that the voltage bias of different polarities applied across the nano-channel, along with the concentration gradient in the channel, can extend or shrink the proportion of electrical double layer (EDL) overlap in the nano-channel, which causes asymmetric ionic conductance. A simulation based on the PNP model was executed to give the electrical potential and ion concentration profile, and to qualitatively explain the asymmetric I–V curve. The results indicate that when the bath concentration gradient is set up to induce the EDL overlap at a single side of the nano-channel, the rectifying effect appears. The theory of ion accumulation or depletion, which is well illustrated in the work of Xinwei Wang,21 is applied here to explain the ICR effect. The formation of asymmetric cation/anion ratios or built-in potentials at the two entrances of the nano-channels is the basis of the ionic rectifying effect.More interesting phenomena have been observed by Liuxuan Cao,28 that an inverse rectification can be obtained by applying a reverse concentration gradient. As a result, the ICR in negatively charged conical nano-pores could be controlled by the electrolyte concentration gradient depending on the direction of ion diffusion. Fig. 8a2 shows the case without a concentration gradient and the asymmetrical geometry induces a preferential direction for ion transport from the tip to the base, showing classical ICR behavior; Fig. 8a3 is the case under a forward applied concentration gradient (from tip to base) and the ICR is enhanced; while Fig. 8a1 is the case under a reverse applied concentration gradient (from base to tip) and an unusual rectification inversion occurs. Fig. 8b(b1–b3) shows the total ion concentration profile within the nano-pore for the three cases in Fig. 8a under the external voltage +1 V and −1 V. In the case of Fig. 8b2, without a concentration gradient, the ion depletion at +1 V and ion accumulation at −1 V due to geometrical asymmetry are apparent, resulting in classical ICR. For Fig. 8b3, under a 1000-fold forward concentration gradient, there is only depletion in the nano-pore, which enhances the ICR, and the ion concentration at −1 V is always higher than that at +1 V. As to Fig. 8b1, under a 1000-fold reverse concentration gradient, at +1 V, the diffusive flow facilitates counter-ion migration into the nano-pore, resulting in a high conducting state, while at −1 V, the diffusive flow prohibits the counter-ions from flowing into the nano-pore, leading to a low conducting state, so that a rectification inversion occurs. Simulation based on the PNP model qualitatively predicts the trends in rectification inversion as shown in Fig. 8c. With the increasing reverse concentration gradient, the rectification ratio increases and under the highest concentration gradient of 1000-fold, rectification inversion is observed (Fig. 8c1). The dependence of this trend on the nano-pore tip diameter is shown in Fig. 8c2.
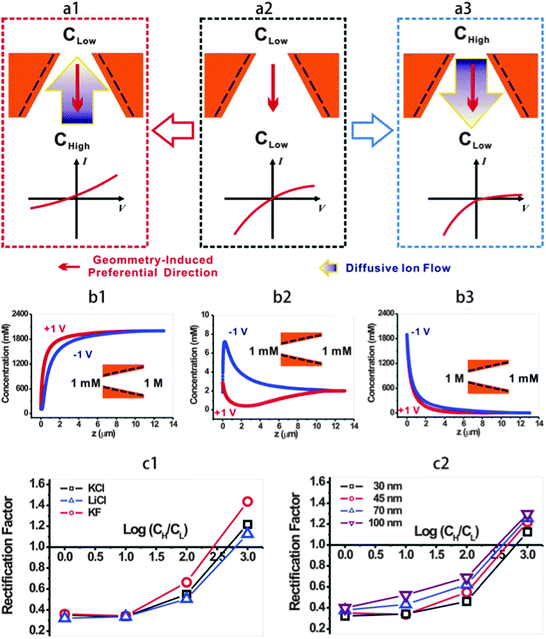 | ||
| Fig. 8 (a) Illustration of the concentration gradient-dependent ion current rectification in negatively charged conical nano-pores. The geometry-induced preferential direction (thin arrow) and the diffusive ion flow driven by the concentration gradient (thick arrow) are marked in each panel. (b) Total ion concentration profile along the pore axis at different electrical potentials and under forward and reverse KCl concentration gradients. (c) Model calculation qualitatively predicts the trends in rectification inversion.28 | ||
Besides, in other works of Liuxuan Cao and Wei Guo,29,30 they have introduced a tiny electrical device named nano-fluidic reverse electrodialysis system (NREDS), which is mimics a biological membrane. This bio-inspired nano-fluidic energy harvesting system converts salinity gradient energy from the ambient environment into sustainable electricity with single ion-selective nano-pores. Simply, this can be seen as a cylindrical nano-channel29 or conical nano-pore30 with homogeneous surface charge set in an electrolyte solution where there is a concentration gradient at the two sides of the pore. Simulations based on the PNP model are produced to calculate the diffusion ion currents as well as the energy-conversion efficiency  . The results show that at a given gradient concentration, different diffusion coefficients of cation/anion and the surface charge density will significantly influence the diffusion ion current, and a high energy conversion efficiency will be obtained with a high surface charge density.
3.3 Effect of the pore shape and structure on the ICR
Apart from the surface charge distribution and the electrolyte solution concentration, the nano-pore shape, especially for the region near the tip, will also have the effect on the ICR that can not be neglected. Since in the work of Xinwei Wang,21 they found that it is the surface charge near the tip region that brings the rectification in a conical nano-pore, the shape of that tip region should be discussed to see its effect on the ICR with surface charge presented.Patricio Ramirez et al.31 have presented a complete theoretical study of the relationship between the pore structure, in terms of tip shape and dimensions, and the pore function, i.e. selectivity and rectification, of asymmetric nano-pores on the basis of the PNP model. The pore shape is defined by the nano-pore radius a(x):
 | (5) |
 , in eqn (5), they have created nano-pores with a bullet-like tip with n= 1 (parametric in
  ), trumpet-like tip with
  (parametric in n) and hybrid tip (parametric in both n and
  ). The calculation results are presented in Fig. 9b. It is obvious that as the conical nano-pore changes into the bullet-like nano-pore by increasing
  , the rectification effect becomes more significant. A rectification of more than 20 can be obtained at the positive bias. The same simulation was done for the case of trumpet-like and hybrid-like nano-pores, and the results indicate that the variation of the tip shape affects strongly the electric field in this region, which determines the transport properties of the nano-pore. Experiments of fabricating the bullet-like nano-pore to investigate its effect on the rectification have been carried out by Pavel Yu Apel.32 Asymmetric pores have been produced by the surfactant-controlled etching of heavy ion tracks in a polymer foil. The results indicate that for the bullet-like tip nano-pores, there is a strong dependence of the ion transport properties on the tip geometry, which agrees with the theoretical discussion.31
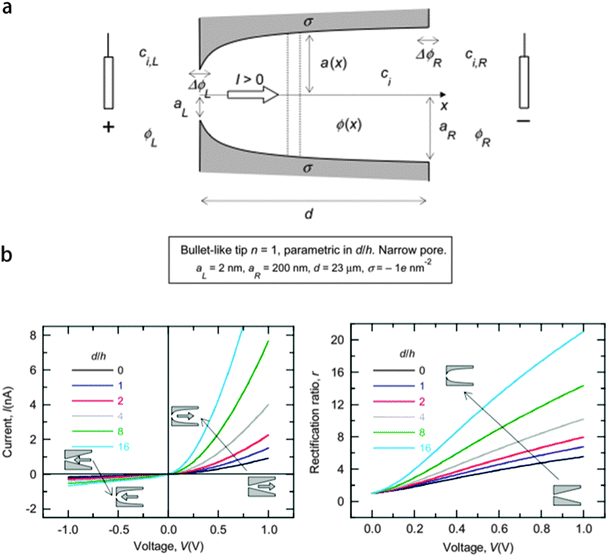 | ||
| Fig. 9 (a) Sketch of the nano-pore, the external solution, and the current electrodes. (b) Curves of current and rectification ratio versus applied voltage for bullet-like tip nano-pores.31 | ||
4 Conclusion
Actually, there are other models, such as the diffusional model based on the Smoluchowski equation33 and the longitudinally oscillating ratchet model,9 that are given to explain the ion current in the nano-pores and the rectification effects with the presence of the surface charge. However the PNP model has the advantages that it can give a quantitative description of the ion current and it is concise enough to carry out the simulation, so that many researchers use this model to give the explanation of their observations.In this review, we have presented the recent studies that concern the ICR effect and the applications of the PNP model to give computational results. The influences of surface charge distribution, electrolyte solution concentration and the pore shape on the ICR are discussed. This will give a guide of experimental and theoretical studies that aim to have a high rectification effect and ion selectivity of a nano-pore.
Acknowledgements
This work was supported by the National Research Fund for Fundamental Key Projects (2011CB935704), National Natural Science Foundation (21271016) and Program for New Century Excellent Talents in University.References
- Z. S. Siwy and S. Howorka, Chem. Soc. Rev., 2010, 39, 1115–1132 RSC.
- X. Hou, W. Guo and L. Jiang, Chem. Soc. Rev., 2011, 40, 2385–2401 RSC.
- P. Apel, Y. Korchev, Z. Siwy, R. Spohr and M. Yoshida, Nucl. Instrum. Methods Phys. Res., Sect. B, 2001, 184, 337–346 CrossRef CAS.
- H. Daiguji, P. Yang and A. Majumdar, Nano Lett., 2004, 4, 137–142 CrossRef CAS.
- J. Cervera, B. Schiedt, R. Neumann, S. Mafe and P. Ramirez, J. Chem. Phys., 2006, 124, 104706 CrossRef PubMed.
- H. Daiguji, Chem. Soc. Rev., 2010, 39, 901–911 RSC.
- P. Ramirez, V. Gomez, J. Cervera, B. Schiedt and S. Mafe, J. Chem. Phys., 2007, 126, 194703 CrossRef PubMed.
- Z. S. Siwy, Adv. Funct. Mater., 2006, 16, 735–746 CrossRef CAS.
- Z. Siwy and A. Fuliński, Phys. Rev. Lett., 2002, 89, 198103 CrossRef CAS.
- D. Woermann, Nucl. Instrum. Methods Phys. Res., Sect. B, 2002, 194, 458–462 CrossRef CAS.
- D. Woermann, Phys. Chem. Chem. Phys., 2003, 5, 1853–1858 RSC.
- J. Cervera, B. Schiedt and P. Ramirez, EPL, 2005, 71, 35 CrossRef CAS.
- Y. Ai, J. Liu, B. Zhang and S. Qian, Sens. Actuators, B, 2011, 157, 742–751 CrossRef CAS PubMed.
- C. Kubeil and A. Bund, J. Phys. Chem. C, 2011, 115, 7866–7873 CAS.
- Z. Siwy, E. Heins, C. C. Harrell, P. Kohli and C. R. Martin, J. Am. Chem. Soc., 2004, 126, 10850–10851 CrossRef CAS PubMed.
- L.-J. Cheng and L. J. Guo, Chem. Soc. Rev., 2010, 39, 923–938 RSC.
- I. Vlassiouk, S. Smirnov and Z. Siwy, Nano Lett., 2008, 8, 1978–1985 CrossRef CAS PubMed.
- Y. Ai, M. Zhang, S. W. Joo, M. A. Cheney and S. Qian, J. Phys. Chem. C, 2010, 114, 3883–3890 CAS.
- B. Zhang, Y. Ai, J. Liu, S. W. Joo and S. Qian, J. Phys. Chem. C, 2011, 115, 24951–24959 CAS.
- D. Constantin and Z. S. Siwy, Phys. Rev. E, 2007, 76, 041202 CrossRef.
- X. Wang, J. Xue, L. Wang, W. Guo, W. Zhang, Y. Wang, Q. Liu, H. Ji and Q. Ouyang, J. Phys. D: Appl. Phys., 2007, 40, 7077 CrossRef CAS.
- I. Vlassiouk and Z. S. Siwy, Nano Lett., 2007, 7, 552–556 CrossRef CAS PubMed.
- S. Qian, S. W. Joo, Y. Ai, M. A. Cheney and W. Hou, J. Colloid Interface Sci., 2009, 329, 376–383 CrossRef CAS PubMed.
- L. Wang, Y. Yan, Y. Xie, L. Chen, J. Xue, S. Yan and Y. Wang, Phys. Chem. Chem. Phys., 2011, 13, 576–581 RSC.
- T.-C. Kuo, D. M. Cannon, Y. Chen, J. J. Tulock, M. A. Shannon, J. V. Sweedler and P. W. Bohn, Anal. Chem., 2003, 75, 1861–1867 CrossRef CAS.
- M. L. Kovarik and S. C. Jacobson, Anal. Chem., 2007, 79, 1655–1660 CrossRef CAS PubMed.
- L.-J. Cheng and L. J. Guo, Nano Lett., 2007, 7, 3165–3171 CrossRef CAS PubMed.
- L. Cao, W. Guo, Y. Wang and L. Jiang, Langmuir, 2012, 28, 2194–2199 CrossRef CAS PubMed.
- W. Guo, L. Cao, J. Xia, F.-Q. Nie, W. Ma, J. Xue, Y. Song, D. Zhu, Y. Wang and L. Jiang, Adv. Funct. Mater., 2010, 20, 1339–1344 CrossRef CAS.
- L. Cao, W. Guo, W. Ma, L. Wang, F. Xia, S. Wang, Y. Wang, L. Jiang and D. Zhu, Energy Environ. Sci., 2011, 4, 2259–2266 CAS.
- P. Ramirez, P. Y. Apel, J. Cervera and S. Maf, Nanotechnology, 2008, 19, 315707 CrossRef PubMed.
- P. Y. Apel, I. V. Blonskaya, O. L. Orelovitch, P. Ramirez and B. A. Sartowska, Nanotechnology, 2011, 22, 175302 CrossRef PubMed.
- A. Fuliski, I. Kosiska and Z. Siwy, New J. Phys., 2005, 7, 132 CrossRef.
| This journal is © the Owner Societies 2014 |

