 Open Access Article
Creative Commons Attribution 3.0 Unported Licence
Effect of high pressure on the crystal structure and charge transport properties of the (2-fluoro-3-pyridyl)(4-iodophenyl)borinic 8-oxyquinolinate complex†
Grzegorz
Wesela-Bauman
*ab,
Simon
Parsons
c,
Janusz
Serwatowski
a and
Krzysztof
Woźniak
b
aPhysical Chemistry Department, Faculty of Chemistry, Warsaw University of Technology, Noakowskiego 3, 00-664 Warszawa, Poland. E-mail: grzegorz.wesela@chem.uw.edu.pl
bDepartment of Chemistry, University of Warsaw, Pasteura 1, 02-093 Warszawa, Poland
cSchool of Chemistry and Centre for Science at Extreme Conditions, The University of Edinburgh, King's Buildings, West Mains Road, Edinburgh EH9 3JJ, Scotland, UK
First published on 2nd October 2014
Abstract
The crystal and molecular structure of (2-fluoro-3-pyridyl)(4-iodophenyl)borinic 8-oxyquinolinate has been determined at room temperature at pressures ranging from ambient to 4.9 GPa in approximately 1 GPa steps. The crystal structure symmetry is conserved during the compression while the a, b and c unit cell dimensions were compressed by 7.5%, 8.0% and 6.9%, respectively. The crystal cell volume decreased by 19.4%. The analysis of the compression of the crystal was supported by computational results obtained with the PASCAL code. They proved that the crystal compression proceeds almost isotropically. A combination of Hirshfeld surface analysis and PIXEL calculations indicated the formation of multiple new contacts involving fluorine⋯fluorine and iodine⋯π-density. Energies of interactions calculated for the observed motifs present in the crystal were rationalized on the basis of contacts observed for these motifs. Further analysis based on the Marcus model was performed to trace the possible changes in the charge transport properties of the crystal. The analysis showed that electron and hole transport properties are not affected in the same way by the compression. However, hydrostatic pressure did not affect which charge transport (electron or hole) is the dominant one for this material.
Introduction
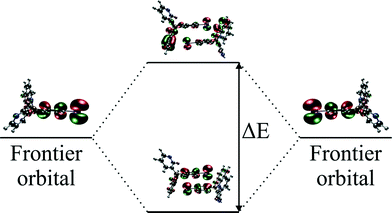
8-Oxyquinolinate complexes, MQn (n = 1, 2, 3) (M is a trivalent metal and Q is 8-oxyquinolinate), are widely used in organic light-emitting diodes (OLEDs) as light emitters and charge carriers.1 Although materials with M = Al were frequently used both as emitting materials2 and as charge transport carriers,3 their good optical properties were counterbalanced by long-term instability leading to degradation of the diode.4,5 Hence, analogues of aluminium were investigated, mainly GaQ3 and InQ3 complexes.6–8 Finally, borinic complexes turned out to be more stable and more efficient emitters than aluminium9,10 and became widely investigated.11–15 For MQn (n = 1, 2, 3) complexes, it is commonly believed that the HOMOs span across the phenolate ring and the LUMOs across the pyridine ring of 8-oxyquinolinate. Those orbitals are involved in processes of electron excitation and relaxation followed by photon emission. The energies of the frontier orbitals can be affected by either chemical functionalisation (by attaching electron donating or withdrawing groups)16–18 or modification of their crystal structure which was proven by high pressure studies on structures of AlQ3, GaQ3 and InQ3.19An important parameter of a particular material, from the standpoint of application in OLEDs, is the charge transfer character and its rate.20,21 In this matter, it is interesting that some authors were able to point out the correlation between the degree of intermolecular π–π interactions and charge transport properties and electroluminescence.22,23 However, in those papers the authors were simultaneously changing the molecular and, as a consequence, supramolecular structure. Studies of the influence of the crystal phase without affecting the molecular structure were done on AlQ3.24 A broader description of the impact of molecular arrangements was done with computational studies.25–33 This approach assumes that carrier mobility (μ) in the hopping process is related to the charge transfer rate (kCT) via the Einstein eqn (1):
 | (1) |
 | (2) |
H AB for hole and electron transport is equal to half of the energy difference between HOMO and HOMO − 1 and LUMO and LUMO + 1 energy levels, respectively.
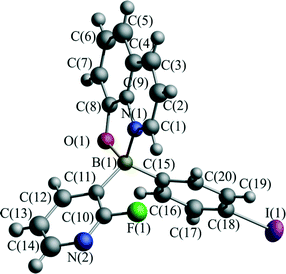
Recently, we have investigated the influence of functionalization on the photophysical properties of (2-fluoro-3-pyridyl)arylborinic 8-oxyquinolinates.37 In this paper, we extend these investigations by determining the effect of pressure on the crystal structure of (2-fluoro-3-pyridyl)(4-iodophenyl)borinic 8-oxyquinolinate (1, Fig. 2) and its charge transfer properties.
In this contribution, the crystal structure of 1 at pressures ranging from ambient to 4.9 GPa is presented. The impact of high pressure on weak interactions is described and discussed. Experimental results are supported by theoretical analysis of the influence of pressure on the charge carrier properties in the framework of the Marcus theory.
Experimental section
Synthesis, crystal growth and high-pressure crystallography
The title compound was synthesized according to our previous report.37 Crystals of 1 were grown by slow evaporation of acetone from a concentrated solution of 1. One block-shaped crystal of dimensions 0.2 mm × 0.2 mm × 0.25 mm was selected and loaded into a Merrill–Bassett diamond anvil cell (DAC).38,39 The cell total opening angle was 80°, and the cell was equipped with 600 μm culets and a tungsten gasket. A 4![[thin space (1/6-em)]](https://www.rsc.org/images/entities/char_2009.gif) :
:![[thin space (1/6-em)]](https://www.rsc.org/images/entities/char_2009.gif) 1 mixture of methanol and ethanol was used as a hydrostatic medium. A small piece of ruby was also put into the cell as the pressure marker by the ruby fluorescence method used to measure the pressure.40
1 mixture of methanol and ethanol was used as a hydrostatic medium. A small piece of ruby was also put into the cell as the pressure marker by the ruby fluorescence method used to measure the pressure.40
Data collection, reduction and refinement
Single-crystal X-ray data collection was conducted at ambient pressure and at 0.17, 1.09, 2.04, 3.02, 3.96 and 4.88 GPa. All high-pressure data were collected at ambient temperature. Diffraction data were collected on a Bruker APEX II diffractometer with graphite-monochromated MoKα radiation (λ = 0.71073 Å).41 The data were integrated using SAINT42 and an absorption correction was performed with the SADABS program.43 Dynamic masking was applied during integration of the high-pressure data sets.44The structure under ambient conditions was solved using the SUPERFLIP45 program implemented in CRYSTALS.46 The independent atom model (IAM) refinement based on F was performed with the CRYSTALS package. Optimised weighting schemes based on Chebychev polynomials were used for all refinements.47 Atomic scattering factors in their analytical form were taken from the International Tables for Crystallography.48 All non-hydrogen atoms (except iodine) were refined isotropically and all of the hydrogen atoms were placed in idealized positions within the riding model for atomic displacement parameters (ADPs) (with UHiso = 1.2·UCeq) in order to retain a data-to-parameter ratio greater than 24. All hydrogen atoms were clearly visible on the difference density maps. Coordinates (and ADPs) of 1 were refined against these ambient pressure X-ray data to yield a conventional R1 factor of 5.1% for 2650 data with I > 2σ (I).
Each data set was restricted to 0.84 Å−1 resolution in order to have a meaningful comparison of the geometries obtained from the experiments. For every collected dataset the Fo2 > 2σ (Fo2) criterion, adopted from SHELX, was used only for calculating R factors and is not relevant to the choice of reflections for the refinement.
Starting models for the high-pressure structures were taken from the coordinates determined in the previous step. Minimization was performed against F using data with I > 2σ (I). The completeness of the data sets ranged from 37% to 46%, and only the iodine was refined with anisotropic displacement parameters, all other atoms being modelled isotropically. It is worth mentioning that the data quality for all of the pressure steps was sufficient enough to perform anisotropic refinement of the ADPs for all of the atoms (not just for the iodine atom).
All hydrogen atoms were clearly visible on the difference density maps. Hydrogen atoms were placed in idealized positions and allowed to ride on their parent atoms with UHiso = 1.2·UCeq. All bond distances and angles were restrained to values observed in the ambient pressure structure. Details of data collection and refinement are provided in Table 1 and, with more details, in the ESI† (Table S1).
| Experimental details | (1) T = 296 K ambient | (2) T = 296 K | (3) T = 296 K | (4) T = 296 K | (5) T = 296 K | (6) T = 296 K | (7) T = 296 K |
|---|---|---|---|---|---|---|---|
| P = 0.17 GPa | P = 1.09 GPa | P = 2.04 GPa | P = 3.02 GPa | P = 3.96 GPa | P = 4.88 GPa | ||
| Chemical formula | C20H13BFIN2O | C20H13BFIN2O | C20H13BFIN2O | C20H13BFIN2O | C20H13BFIN2O | C20H13BFIN2O | C20H13BFIN2O |
| M r | 454.03 | 454.03 | 454.03 | 454.03 | 454.03 | 454.03 | 454.03 |
| Crystal system | Monoclinic | Monoclinic | Monoclinic | Monoclinic | Monoclinic | Monoclinic | Monoclinic |
| Space group | P21/n | P21/n | P21/n | P21/n | P21/n | P21/n | P21/n |
| Cell settings: a, b, c (Å) | 6.8581(2) | 6.8234(4) | 6.6545(2) | 6.5502(4) | 6.4636(2) | 6.4012(4) | 6.3469(5) |
| 14.7849(4) | 14.7074(7) | 14.3261(5) | 14.1051(7) | 13.8775(5) | 13.7152(9) | 13.6039(10) | |
| 17.3015(6) | 17.200(2) | 16.7183(14) | 16.497(3) | 16.3094(16) | 16.187(3) | 16.105(3) | |
| α, β, γ (°) | 90.000 | 90.000 | 90.000 | 90.000 | 90.000 | 90.000 | 90.000 |
| 90.966(2) | 90.814(7) | 90.460(5) | 90.396(8) | 90.317(5) | 90.438(8) | 90.549(10) | |
| 90.000 | 90.000 | 90.000 | 90.000 | 90.000 | 90.000 | 90.000 | |
| V (Å3) | 1754.06(9) | 1725.9(2) | 1593.75(15) | 1524.1(3) | 1462.91(16) | 1421.1(3) | 1390.5(3) |
| Z | 4 | 4 | 4 | 4 | 4 | 4 | 4 |
| d (Mg m−3) | 1.719 | 1.747 | 1.892 | 1.979 | 2.061 | 2.122 | 2.169 |
| Crystal form, colour | Block, green | Block, green | Block, green | Block, green | Block , green | Block , green | Block , green |
| Crystal size (mm) | 0.20 × 0.20 × 0.25 | 0.20 × 0.20 × 0.25 | 0.20 × 0.20 × 0.25 | 0.20 × 0.20 × 0.25 | 0.20 × 0.20 × 0.25 | 0.20 × 0.20 × 0.25 | 0.20 × 0.20 × 0.25 |
| No. of measured, independent and observed [F2 > 2σ (F2)] | 34![[thin space (1/6-em)]](https://www.rsc.org/images/entities/char_2009.gif) 795 795 |
9268 | 8787 | 7648 | 8296 | 6840 | 6772 |
| 5362 | 1184 | 1141 | 1067 | 1138 | 1142 | 1187 | |
| 2650 | 936 | 887 | 871 | 949 | 916 | 910 | |
| Criterion for observed reflection | I > 2.00σ (I) | I > 2.00σ (I) | I > 2.00σ (I) | I > 2.00σ (I) | I > 2.00σ (I) | I > 2.00σ (I) | I > 2.00σ (I) |
| Completeness (%) | 100 | 37 | 39 | 38 | 42 | 44 | 46 |
| R int (%) | 6.5 | 5.6 | 4.3 | 4.0 | 4.3 | 4.4 | 5.7 |
| Θ max | 30.53 | 25.38 | 25.38 | 25.38 | 25.33 | 25.35 | 25.54 |
| Refinement on | F | F | F | F | F | F | F |
| R [F2 > 2σ (F2)] | 0.0510 | 0.0501 | 0.0354 | 0.0326 | 0.0339 | 0.0340 | 0.0392 |
| wR (F2) | 0.0512 | 0.0396 | 0.0385 | 0.0348 | 0.0355 | 0.0367 | 0.0417 |
| GooF | 1.000 | 1.000 | 1.000 | 1.000 | 1.000 | 1.000 | 1.000 |
| No. of reflections | 2650 | 936 | 887 | 871 | 949 | 916 | 910 |
| No. of parameters | 110 | 110 | 110 | 110 | 110 | 110 | 110 |
| Δρmax, Δρmin (e Å−3) | 0.70, −0.78 | 0.40, −0.40 | 0.58, −0.43 | 0.37, −0.30 | 0.46, −0.33 | 0.34, −0.50 | 0.52, −0.66 |
CCDC 993575–993581 contains the supplementary crystallographic data (CIF files) for crystals studied in this work.
Theoretical calculations and visualization
Energies of intermolecular interactions were calculated using the PIXEL method.49–52 For comparison of results obtained with PIXEL and DFT and post-HF methods see ref. 53. All quantum calculations were carried out using the GAUSSIAN09 package.54 Calculation of the frontier orbital energies employed the B3LYP55,56 and B97D57 DFT potentials combined with the 6-31+g(d,p)58 basis set. The LANL2DZ59 basis set with its complete core relativistic effective core potential was used for the iodine atom. Additional d and f functions were added to the LANL2DZ basis set according to the modification proposed by Glukhovtsev et al.60 Benchmark calculations demonstrated that this modification improves obtained bond lengths and bond energies leading to more accurate results.61,62 Our previous work implementing this modification showed good correlation between experimental and theoretically obtained UV-vis spectra.37 Electron density was evaluated with the DGDZVP63,64 basis set. C–H distances were normalized prior to calculations to the standard neutron value of 1.083 Å.65 Visualization of the crystal structures and frontier orbitals was achieved using the DIAMOND66 and the VMD67 programs, respectively. The electrostatic potential was calculated and visualized with AIMALL.68 Hirshfeld surface analysis was performed with CRYSTALEXPLORER.69–72Results and discussion
Molecular shape
The tetrahedral character of the coordination sphere of the boron atom is not affected by pressure. The bond lengths of the dative bonds: B–N, and B–O, and B–C are equal within the error at all pressures studied (Table S2†). Similarly, there are no significant differences in the molecular dimensions involving phenyl and pyridyl groups. High pressure slightly modifies the conformation of the molecule. The most pronounced differences between the ambient and the 4.9 GPa geometry of the moiety can be summarized as a twist of quinoline rings and deviation from planarity in the pyridine ring with interplanar angles of 3.6° and 5.7°, respectively (Fig. S6†). Hence, as expected for this material, the only thing that was affected by the pressure was the intermolecular interactions which can be directly related to the change in the CT properties.The structure of 1 at ambient temperature and pressure
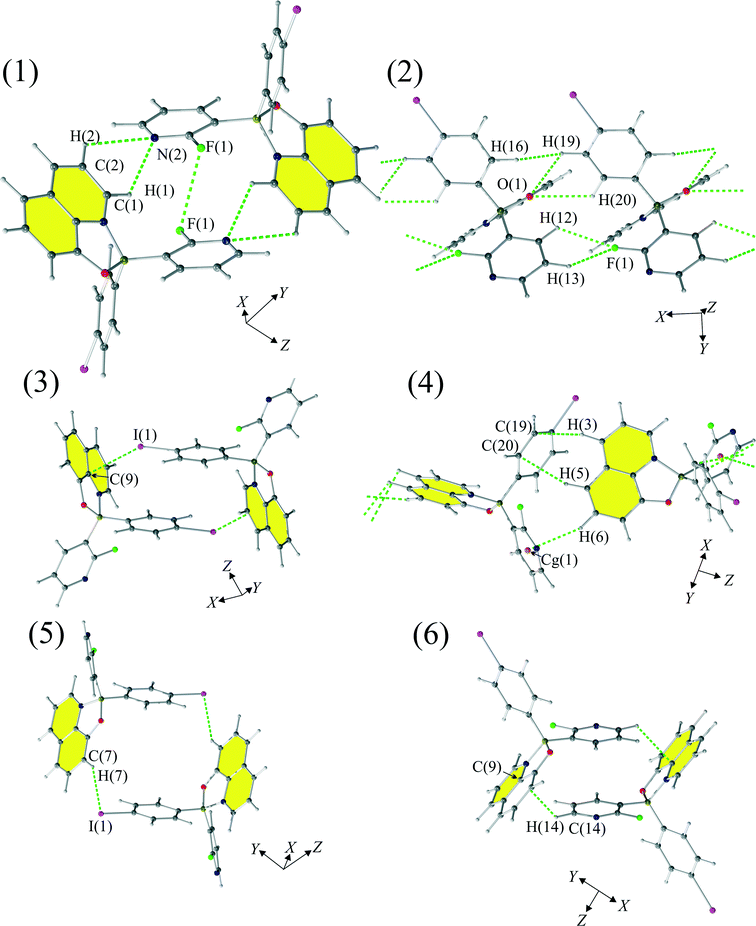
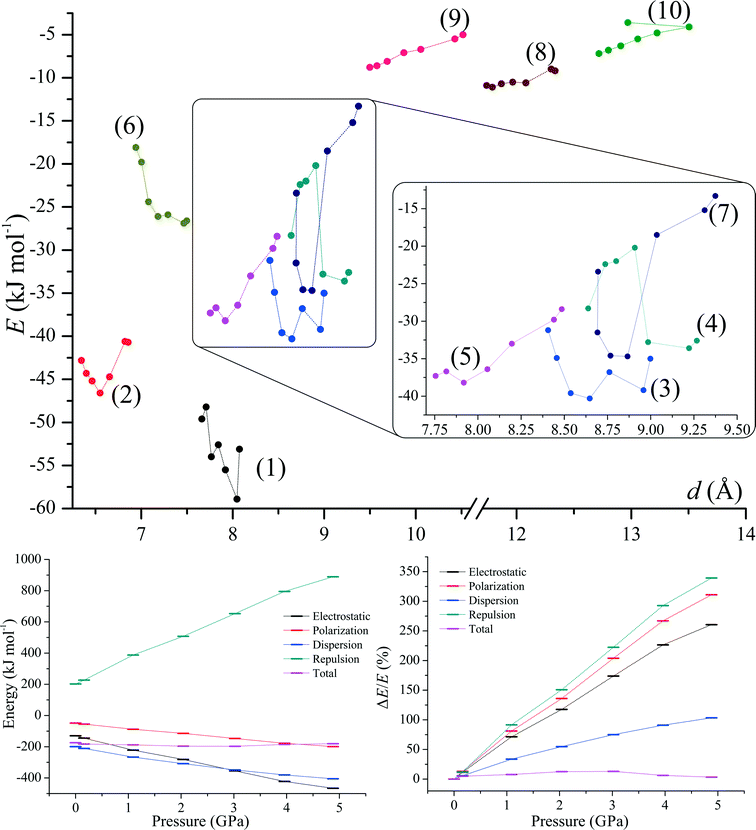
The supramolecular architecture of 1 is based on crystallographic motifs compromising weak interactions (Fig. 3 and 5). The strongest motif [see (1)] involves bifurcated hydrogen bond C(1)–H(1)⋯N(2) (dH⋯N = 2.63 Å) and C(2)–H(2)⋯N(2) (dH⋯N = 2.88 Å). The motif has an energy of −53.1 kJ mol−1 and a significant electrostatic (Fig. 3, Table 2) character. The impact of F(1)⋯F(1) interaction on the stability of this motif is not clear as the halogen–halogen distance is equal to dF⋯F = 3.197(4) Å, which is relatively close to the sum of the van der Waals radii (2.94 Å).73| Energy (kJ mol−1) | |||||||
|---|---|---|---|---|---|---|---|
| d (Å)a | Electrostatic | Polarization | Dispersion | Repulsion | Total | Symmetry | |
| a Parameter d designates the distance between the centre of masses of two interacting molecules. | |||||||
| (1) | 8.074 | −42.7 | −13.7 | −24.9 | 28.2 | −53.1 | 1 − x, 1 − y, 1 − z |
| 7.662 | −85.6 | −29.6 | −40.9 | 106.5 | −49.6 | 1 − x, 2 − y, 1 − z | |
| (2) | 6.858 | −26.2 | −11.1 | −44.5 | 41.0 | −40.7 | x ± 1, y, z |
| 6.347 | −107.4 | −45.6 | −90.8 | 201.1 | −42.8 | x ± 1, y, z | |
| (3) | 8.998 | −48.8 | −20.6 | −67.1 | 101.5 | −35.0 | 1 − x, −y, 1 − z |
| 8.406 | −193.0 | −73.2 | −128.7 | 363.0 | −31.2 | 1 − x, 1 − y, 1 − z | |
| (4) | 9.267 | −26.4 | −10.2 | −38.3 | 42.4 | −32.6 | x ± 0.5, 0.5 − y, z ± 0.5 |
| 8.638 | −98.6 | −46.4 | −80.9 | 197.5 | −28.3 | x ± 0.5, 1.5 − y, z ± 0.5 | |
| (5) | 8.485 | −18.1 | −6.7 | −25.4 | 21.8 | −28.4 | −x, −y, 1 − z |
| 7.755 | −49.0 | −26.1 | −49.9 | 87.6 | −37.3 | −x, 1 − y, 1 − z | |
| (6) | 7.498 | −18.9 | −10.9 | −47.7 | 50.9 | −26.6 | −x, 1 − y, 1 − z |
| 6.942 | −95.8 | −52.9 | −94.2 | 224.8 | −18.1 | −x, 2 − y, 1 − z | |
| (7) | 9.374 | −1.9 | −3.1 | −13.8 | 5.4 | −13.3 | x ± 0.5, 0.5 − y, z ± 0.5 |
| 8.695 | −21.2 | −18.7 | −37.1 | 53.6 | −23.4 | x ± 0.5, 1.5 − y, z ± 0.5 | |
| (8) | 12.336 | −7.7 | −2.7 | −11.2 | 12.4 | −9.2 | 0.5 − x, y ± 0.5, 1.5 − z |
| 11.738 | −25.4 | −9.5 | −21.7 | 45.7 | −10.9 | 0.5 − x, y ± 0.5, 1.5 − z | |
| (9) | 10.516 | −2.7 | −0.5 | −1.9 | 0.0 | −5.0 | 0.5 − x, y ± 0.5, 0.5 − z |
| 9.498 | −4.5 | −0.8 | −3.7 | 0.1 | −8.8 | 0.5 − x, y ± 0.5, 0.5 − z | |
| (10) | 12.970 | −3.3 | −0.1 | −0.3 | 0.0 | −3.6 | 2 − x, 1 − y, 1 − z |
| 12.718 | −2.8 | −0.5 | −4.5 | 0.6 | −7.2 | 2 − x, 1 − y, 1 − z | |
The second most energetic (2) motif comprises a bifurcated hydrogen bond: C(19)–H(19)⋯O(1) (dH⋯O = 2.54 Å) and C(20)–H(20)⋯O(1) (dH⋯O = 2.76 Å), with the energy of interactions equal to −40.7 kJ mol−1. This is a dispersion-dominated motif which features interaction between 8-quinolinates. Repulsion, on the other hand, cannot be as easily rationalized by structural interactions as the mutual proximity of hydrogen–fluorine atoms, mainly C(12)–H(12)⋯F(1) and C(13)–H(13)⋯F(1) interactions (with interatomic distances equal to 2.67 Å and 2.81 Å, respectively) has larger distances than the distances observed in similar structures (2.43–2.73 Å).37 For this motif we observed a mutual proximity of H(16) and H(19) atoms, but the distance between those hydrogens (dH⋯H = 2.23 Å) is much greater than the approximate limit (1.7 Å) for such contacts established by Wood et al.74
The energy of interaction (3) in this case is dominated by repulsive interactions (101.5 kJ mol−1), which is balanced by electrostatic (−48.8 kJ mol−1) and dispersion terms (−67.1 kJ mol−1). Those stabilizing contributions to the energy of (3) can be rationalized by the existence of a short intermolecular contact between C(9) and I(1) measuring 3.591(4) Å, and the interplanar contact between the 4-iodophenyl moieties with an interplanar distance of 4.024 Å.
The charge distribution of halogen moieties is not isotropic (Fig. 4), and the short distance is indicative of an interaction involving the σ-hole of the iodine and the π-electrons of the 8-oxyquinolinate rings. The repulsion between the π-electrons of 4-iodophenyl moieties and the negatively charged part of the iodine atom may be counterbalancing the attractive force between σ-hole and 8-oxyquinolinate rings.
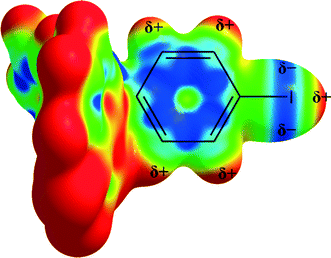 | ||
| Fig. 4 Anisotropic charge distribution around the iodine atom in 1. Electrostatic potential calculated at the B3LYP/DGDZVP level of theory. | ||
The fourth motif (4) builds chains of molecules disposed about the 21 screw axis. Stabilization of this motif results from joint effects of dispersion (−38.3 kJ mol−1) and the electrostatic interactions (−26.4 kJ mol−1). This is achieved with a significant contribution of the C–H⋯π type interactions, mainly, C(6)–H(6)⋯Cg(1) (dH⋯Cg = 2.88 Å, C(6)–H(6)–Cg(1) = 152), where Cg(1) is the centroid calculated for the 2-fluoro-3-pyridyl moiety. The largest contribution to the energy of interactions for this motif, according to the PIXEL calculations, is, as in the third motif, dominated by the repulsion term (42.4 kJ mol−1).
The fifth motif (5) is also based on the anisotropy of the charge distribution of the iodine atom. It is stabilized by C(7)–H(7)⋯I(1) interactions in which a positively charged proton is pointing towards the negatively charged side of the iodine atom.
The sixth motif (6) is based upon two sets of interactions. The first set of interactions is based on C–H⋯π interactions, with the distance between C(9) and H(14) atoms from 2-fluoro-3-pyridyl moiety equaling to 2.86 Å. The other set of interactions is constructed from the π⋯π stacking interactions between 2-fluoro-3-pyridyl moieties with the interplanar distance equal to 3.780 Å. We believe that this interaction is strong, according to the calculations done by Sherrill et al.,75 as such a distance is quite favourable for π⋯π interactions.
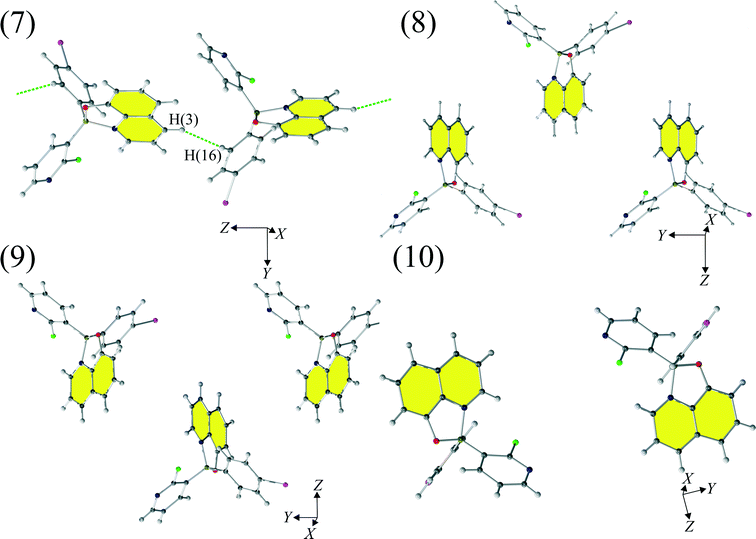
Motifs (7)–(10) (Fig. 5) compromise very weak interactions and are stabilized by either dispersion (motifs 7 and 8) and/or electrostatic contributions (motifs 8, 9 and 10). The seventh motif (7) has a short H(3)⋯H(16) contact (2.58 Å) and molecules in this motif are arranged in such a way that they create a chain of molecules. Similar chains are created by motifs (8) and (9 and stabilized by Q⋯Q interactions. Motif (10) compromises interacting molecules for which the mutual distance permits only electrostatic interactions.
Impact of pressure on the crystal structure of compound 1
The changes in the variable-pressure parameters of the unit cell for this low-symmetry system are not strictly related to compressibility, which was presented by Cliffe et al.81 Hence, we have implemented the PASCAL code for these calculations (for the output of the PASCAL program, see the ESI†).81 Since the β angle is close to 90°, the PASCAL analysis gave similar results to the analysis for nonorthogonal a, b and c cell parameters. The direction of the greatest strain is close to the X axis (see orthonormalization matrix in the ESI†) and can be rationalized as a consequence of the lack of interactions parallel to that direction.
Analysis based on Birch–Murnaghan coefficients (B and B′) may indicate a rapid stiffening of the described material (B′ > 4) with pressure (for more details and comparison with other materials see the ESI†).
The effect of high pressure on the intermolecular interaction can be visualised using Hirshfeld (dnorm) surface analysis (Fig. S2–S4†). Red areas on the surface which represent contacts existing at ambient pressure become more pronounced after compression. New contacts appeared, especially H⋯H and C⋯H, but also F⋯F and N⋯H type contacts. Interactions between the iodine atom with both phenyl and Q rings become prominent at elevated pressure.
Compression has affected both lattice energies and contributions to the lattice energies (Fig. 6, lower graphs). As the compression progresses the total lattice energies decrease to reach a minimum at ca. 2.5 GPa and then their values start to increase. It seems that such behaviour is a consequence of the interplay between the polarization and the repulsion terms, which become more prominent with pressure (more than 3× stronger than those at ambient pressure, Tables S2–S3†).
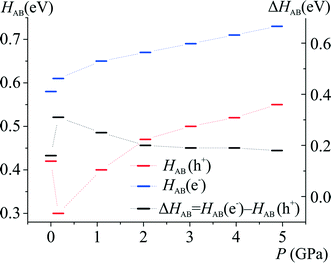 | ||
| Fig. 7 Sum of charge transfer integrals as a function of hydrostatic pressure calculated at the B97D/6-31+g(d,p) level of theory. | ||
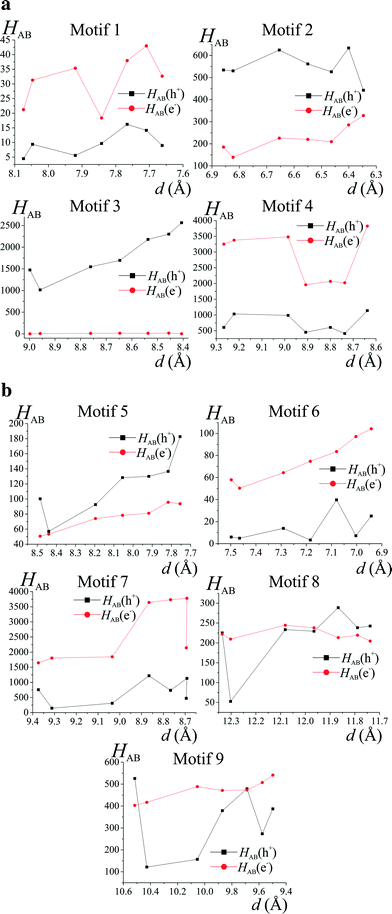
It seems that crystallographic motifs are not participating in the CT properties equally, or that their character is not fixed during compression (Fig. 8a and b). The biggest contributions to the CT are from motifs (3), (4) and (7). Motif (3) with iodine⋯π-density interaction is almost solely a hole transporting contact whose CT properties are being increased with compression. It seems that this motif is being destabilized by pressure. On the other hand, motifs (4) and (7) have both dominating electron transporting properties. They also present the same pattern of CH⋯π interactions between Q and 2-fluoro-3-pyridyl and 4-iodophenyl rings. It seems that the mutual proximity between electron-rich phenolate ring and electron-deficient 2-fluoro-3-pyridyl ring favours transport of electrons. As the compression proceeds for (4) the electron CT properties are being hampered by increasing interactions between two electron-deficient rings, mainly pyridine and 2-fluoro-3-pyridyl. At 4.9 GPa the mutual orientation of molecules is similar to the orientation observed for normal pressure. Therefore, reinforcement of electron CT properties is observed. A similar situation is observed for motif (7). For pressure steps with close proximity of the phenolate ring and 2-fluoro-pyridyl the electron transporting properties were reinforced, whereas for the pressure steps which favour pyridine and 2-fluoro-pyridyl the CT properties were hampered. Observed trends in CT properties seem to be correlated with the stabilization energies (Fig. 6). For those two motifs, the stronger they are, the better CT properties they are presenting.
At this point it should be stressed that the PIXEL method was checked against various methods (DFT, post-HF).53 The correlation was established against stabilization energies derived with PIXEL and ab initio methods leading to a conclusion that the method worked fine. However, in this contribution we are seeing that orbital overlapping (important from the standpoint of charge hopping) obtained with ab initio methods in some cases is correlated with motif energies obtained with PIXEL.
Apart from (3), motifs (2) and (5) also have their hole transporting properties dominating over electrons. This is due to the proximity of 4-iodophenyl rings which are occupied by HOMO orbitals. The CT character of motifs (8) and (9) was changed by the compression. It seems that the mutual orientation of molecules in those two motifs promotes better charge hopping than that present in motif (1).
Conclusions
The crystal of 1 was compressed almost isotropically which was confirmed by the analysis of the crystal lattice parameters supporting the analysis using PASCAL and STRAIN programs. While the molecular geometry remains virtually unchanged, the intermolecular interactions were affected greatly by the pressure. This was revealed qualitatively by Hirshfeld surface analysis and quantitatively by PIXEL calculations. Having a detailed description of a crystal system and changes triggered by the pressure, we could estimate how the structure affects the charge transport properties. It turns out that an increase in pressure improved charge transport properties estimated by the Marcus theory. It seems that motifs based on interactions between electron-rich and electron-poor ligands have strong electron transporting properties. On the other hand, interactions between two electron-deficient counterparts may hamper electron transporting properties.Acknowledgements
The MPD/2010/4 project is realized within the MPD programme of the Foundation for Polish Science, cofinanced by the European Regional Development Fund. This work was supported by Warsaw University of Technology and by the Polish Ministry of Science and Higher Education (grant no. DEC-2011/03/B/ST5/02755). The support by Aldrich Chemical Co., Milwaukee, WI, USA, through continuous donation of chemicals and equipment is gratefully acknowledged. G.W.B. thanks the Foundation for Polish Science for financial support within the International PhD Program. Authors gratefully acknowledge the Interdisciplinary Centre for Mathematical and Computational Modelling in Warsaw (grant no. G33-14) for providing computer facilities on which most of the calculations were done. G.W.B. would like to thank Dr. Stephen Moggach, Mr. Andrew Maloney and Mr. Chris Cameron from the Chemical Crystallography Research Group at The University of Edinburgh.References
- C. H. Chen and J. Shi, Coord. Chem. Rev., 1998, 171, 161–174 CrossRef CAS.
- S. A. VanSlyke and C. W. Tang, Appl. Phys. Lett., 1987, 51, 913–915 CrossRef.
- B. C. Lin, C. P. Cheng, Z.-Q. You and C.-P. Hsu, J. Am. Chem. Soc., 2005, 127, 66–67 CrossRef CAS PubMed.
- Z. D. Popovic, H. Aziz, A. Ioannidis, N.-X. Hu and P. N. M. dos Anjos, Synth. Met., 2001, 123, 179–181 CrossRef CAS.
- J. E. Knox, M. D. Halls, H. P. Hratchian and H. Bernhard Schlegel, Phys. Chem. Chem. Phys., 2006, 8, 1371–1377 RSC.
- P. E. Burrows, L. S. Sapochak, D. M. McCarty, S. R. Forrest and M. E. Thompson, Appl. Phys. Lett., 1994, 64, 2718–2720 CrossRef CAS.
- P. Shakya, P. Desai, M. Somerton, G. Gannaway, T. Kreouzis and W. P. Gillin, J. Appl. Phys., 2008, 103 Search PubMed.
- V. K. Shukla and S. Kumar, Opt. Mater., 2007, 29, 1809–1816 CrossRef CAS.
- S. Anderson, M. S. Weaver and A. J. Hudson, Synth. Met., 2000, 111–112, 459–463 CrossRef CAS.
- X.-Y. Wang and M. Weck, Macromolecules, 2005, 38, 7219–7224 CrossRef CAS.
- K. Tanaka and Y. Chujo, Macromol. Rapid Commun., 2012, 33, 1235–1255 CrossRef CAS PubMed.
- F. Jäkle, Chem. Rev., 2010, 110, 3985–4022 CrossRef PubMed.
- Y.-L. Rao and S. Wang, Inorg. Chem., 2011, 50, 12263–12274 CrossRef CAS PubMed.
- A. Nagai and Y. Chujo, Chem. Lett., 2010, 39, 430–435 CrossRef CAS.
- F. Jäkle, Coord. Chem. Rev., 2006, 250, 1107–1121 CrossRef.
- Y. Qin, I. Kiburu, S. Shah and F. Jäkle, Org. Lett., 2006, 8, 5227–5230 CrossRef CAS PubMed.
- Y. Nagata and Y. Chujo, Macromolecules, 2008, 41, 2809–2813 CrossRef CAS.
- Y. Tokoro, A. Nagai, K. Kokado and Y. Chujo, Macromolecules, 2009, 42, 2988–2993 CrossRef CAS.
- I. Hernández and W. P. Gillin, J. Phys. Chem. B, 2009, 113, 14079–14086 CrossRef PubMed.
- U. Mitschke and P. Bauerle, J. Mater. Chem., 2000, 10, 1471–1507 RSC.
- Y. Shirota and H. Kageyama, Chem. Rev., 2007, 107, 953–1010 CrossRef CAS PubMed.
- S. L. Hellstrom, J. Ugolotti, G. J. P. Britovsek, T. S. Jones and A. J. P. White, New J. Chem., 2008, 32, 1379–1387 RSC.
- L. S. Sapochak, A. Padmaperuma, N. Washton, F. Endrino, G. T. Schmett, J. Marshall, D. Fogarty, P. E. Burrows and S. R. Forrest, J. Am. Chem. Soc., 2001, 123, 6300–6307 CrossRef CAS PubMed.
- M. Brinkmann, G. Gadret, M. Muccini, C. Taliani, N. Masciocchi and A. Sironi, J. Am. Chem. Soc., 2000, 122, 5147–5157 CrossRef CAS.
- Y.-K. Lan and C.-I. Huang, J. Phys. Chem. B, 2008, 112, 14857–14862 CrossRef CAS PubMed.
- J.-L. Brédas, D. Beljonne, V. Coropceanu and J. Cornil, Chem. Rev., 2004, 104, 4971–5004 CrossRef PubMed.
- G. R. Hutchison, M. A. Ratner and T. J. Marks, J. Am. Chem. Soc., 2005, 127, 16866–16881 CrossRef CAS PubMed.
- W.-Q. Deng and W. A. Goddard, J. Phys. Chem. B, 2004, 108, 8614–8621 CrossRef CAS.
- V. Stehr, R. F. Fink, B. Engels, J. Pflaum and C. Deibel, J. Chem. Theory Comput., 2014, 10, 1242–1255 CrossRef CAS.
- M. Mamada, H. Katagiri, M. Mizukami, K. Honda, T. Minamiki, R. Teraoka, T. Uemura and S. Tokito, ACS Appl. Mater. Interfaces, 2013, 5, 9670–9677 CAS.
- H. Mori, X. Chen, N. Chang, S. Hamao, Y. Kubozono, K. Nakajima and Y. Nishihara, J. Org. Chem., 2014, 79, 4973–4983 CrossRef CAS PubMed.
- B. C. Lin, C. P. Cheng, Z.-Q. You and C.-P. Hsu, J. Am. Chem. Soc., 2005, 127, 66–67 CrossRef CAS PubMed.
- C. Liang and M. D. Newton, J. Phys. Chem., 1992, 96, 2855–2866 CrossRef CAS.
- R. A. Marcus and N. Sutin, Biochim. Biophys. Acta, Rev. Bioenerg., 1985, 811, 265–322 CrossRef CAS.
- P. F. Barbara, T. J. Meyer and M. A. Ratner, J. Phys. Chem., 1996, 100, 13148–13168 CrossRef CAS.
- E. Laborda, M. C. Henstridge, C. Batchelor-McAuley and R. G. Compton, Chem. Soc. Rev., 2013, 42, 4894–4905 RSC.
- G. Wesela-Bauman, P. Ciećwierz, K. Durka, S. Luliński, J. Serwatowski and K. Woźniak, Inorg. Chem., 2013, 52, 10846–10859 CrossRef CAS PubMed.
- L. Merrill and W. A. Bassett, Rev. Sci. Instrum., 1974, 45, 290–294 CrossRef.
- S. A. Moggach, D. R. Allan, S. Parsons and J. E. Warren, J. Appl. Crystallogr., 2008, 41, 249–251 CrossRef CAS.
- G. J. Piermarini, S. Block, J. D. Barnett and R. A. Forman, J. Appl. Phys., 1975, 46, 2774–2780 CrossRef CAS.
- Bruker AXS Inc., SMART, Bruker-Nonius, Madison, Wisconsin, USA, 2002 Search PubMed.
- Bruker AXS Inc., SAINT, Bruker-Nonius, Madison, Wisconsin, USA, 2004 Search PubMed.
- Bruker AXS Inc., SADABS, Madison, Wisconsin, USA, 2004 Search PubMed.
- A. Dawson, D. R. Allan, S. Parsons and M. Ruf, J. Appl. Crystallogr., 2004, 37, 410–416 CAS.
- L. Palatinus and G. Chapuis, J. Appl. Crystallogr., 2007, 40, 786–790 CrossRef CAS.
- P. W. Betteridge, J. R. Carruthers, R. I. Cooper, K. Prout and D. J. Watkin, J. Appl. Crystallogr., 2003, 36, 1487 CrossRef CAS.
- J. R. Carruthers and D. J. Watkin, Acta Crystallogr., Sect. A: Cryst. Phys., Diffr., Theor. Gen. Crystallogr., 1979, 35, 698–699 CrossRef.
- International Tables for Crystallography: Mathematical, Physical and Chemical Tables, ed. H. Fuess, Chester, 2006, vol. C Search PubMed.
- A. Gavezzotti, J. Phys. Chem. B, 2003, 107, 2344–2353 CrossRef CAS.
- A. Gavezzotti, J. Phys. Chem. B, 2002, 106, 4145–4154 CrossRef CAS.
- A. Gavezzotti, J. Chem. Theory Comput., 2005, 1, 834–840 CrossRef CAS.
- A. Gavezzotti, CrystEngComm, 2003, 5, 429–438 RSC.
- L. Maschio, B. Civalleri, P. Ugliengo and A. Gavezzotti, J. Phys. Chem. A, 2011, 115, 11179–11186 CrossRef CAS PubMed.
- M. J. Frisch, G. W. Trucks, H. B. Schlegel, G. E. Scuseria, M. A. Robb, J. R. Cheeseman, G. Scalmani, V. Barone, B. Mennucci, G. A. Petersson, H. Nakatsuji, M. Caricato, X. Li, H. P. Hratchian, A. F. Izmaylov, J. Bloino, G. Zheng, J. L. Sonnenberg, M. Hada, M. Ehara, K. Toyota, R. Fukuda, J. Hasegawa, M. Ishida, T. Nakajima, Y. Honda, O. Kitao, H. Nakai, T. Vreven, J. A. Montgomery Jr., J. E. Peralta, F. Ogliaro, M. Bearpark, J. J. Heyd, E. Brothers, K. N. Kudin, V. N. Staroverov, T. Keith, R. Kobayashi, J. Normand, K. Raghavachari, A. Rendell, J. C. Burant, S. S. Iyengar, J. Tomasi, M. Cossi, N. Rega, J. M. Millam, M. Klene, J. E. Knox, J. B. Cross, V. Bakken, C. Adamo, J. Jaramillo, R. Gomperts, R. E. Stratmann, O. Yazyev, A. J. Austin, R. Cammi, C. Pomelli, J. W. Ochterski, R. L. Martin, K. Morokuma, V. G. Zakrzewski, G. A. Voth, P. Salvador, J. J. Dannenberg, S. Dapprich, A. D. Daniels, O. Farkas, J. B. Foresman, J. V. Ortiz, J. Cioslowski and D. J. Fox, Gaussian 09, Gaussian, Inc, Wallingford CT, 2010 Search PubMed.
- A. D. Becke, Phys. Rev. A: At., Mol., Opt. Phys., 1988, 38, 3098–3100 CrossRef CAS.
- C. Lee, W. Yang and R. G. Parr, Phys. Rev. B: Condens. Matter Mater. Phys., 1988, 37, 785–789 CrossRef CAS.
- S. Grimme, J. Comput. Chem., 2006, 27, 1787–1799 CrossRef CAS PubMed.
- R. Krishnan, J. S. Binkley, R. Seeger and J. A. Pople, J. Chem. Phys., 1980, 72, 650–654 CrossRef CAS.
- P. J. Hay and W. R. Wadt, J. Chem. Phys., 1985, 82, 270–283 CrossRef CAS.
- M. N. Glukhovtsev, A. Pross, M. P. McGrath and L. Radom, J. Chem. Phys., 1995, 103, 1878–1885 CrossRef CAS.
- A. L. L. East, G. M. Berner, A. D. Morcom and L. Mihichuk, J. Chem. Theory Comput., 2008, 4, 1274–1282 CrossRef CAS.
- S. S. Hepperle, Q. Li and A. L. L. East, J. Phys. Chem. A, 2005, 109, 10975–10981 CrossRef CAS PubMed.
- C. Sosa, J. Andzelm, B. C. Elkin, E. Wimmer, K. D. Dobbs and D. A. Dixon, J. Phys. Chem., 1992, 96, 6630–6636 CrossRef CAS.
- N. Godbout, D. R. Salahub, J. Andzelm and E. Wimmer, Can. J. Chem., 1992, 70, 560–571 CrossRef CAS.
- F. H. Allen and I. J. Bruno, Acta Crystallogr., Sect. B: Struct. Sci., 2010, 66, 380–386 CrossRef CAS PubMed.
- H. Putz and K. Brandenburg, Diamond - Crystal and Molecular Structure Visualization, Germany, 2012 Search PubMed.
- W. Humphrey, A. Dalke and K. Schulten, J. Mol. Graphics, 1996, 14, 33–38 CrossRef CAS PubMed.
- T. A. Keith, AIMAll, TK Gristmill Software, Overland Park KS, USA, 2012 Search PubMed.
- M. A. Spackman and J. J. McKinnon, CrystEngComm, 2002, 4, 378–392 RSC.
- M. A. Spackman and D. Jayatilaka, CrystEngComm, 2009, 11, 19–32 RSC.
- J. J. McKinnon, M. A. Spackman and A. S. Mitchell, Acta Crystallogr., Sect. B: Struct. Sci., 2004, 60, 627–668 CrossRef PubMed.
- J. J. McKinnon, D. Jayatilaka and M. A. Spackman, Chem. Commun., 2007, 3814–3816 RSC.
- R. Berger, G. Resnati, P. Metrangolo, E. Weber and J. Hulliger, Chem. Soc. Rev., 2011, 40, 3496–3508 RSC.
- P. A. Wood, J. J. McKinnon, S. Parsons, E. Pidcock and M. A. Spackman, CrystEngComm, 2008, 10, 368–376 CAS.
- M. O. Sinnokrot and C. D. Sherrill, J. Phys. Chem. A, 2006, 110, 10656–10668 CrossRef CAS PubMed.
- M. I. Aroyo, A. Kirov, C. Capillas, J. M. Perez-Mato and H. Wondratschek, Acta Crystallogr., Sect. A: Found. Crystallogr., 2006, 62, 115–128 CrossRef PubMed.
- A. M. Ilia, P.-M. Juan Manuel, C. Cesar, K. Eli, I. Svetoslav, M. Gotzon, K. Asen and W. Hans, Z. Kristallogr., 2009, 221, 15 Search PubMed.
- M. I. Aroyo, J. M. Perez-Mato, D. Orobengoa, E. Tasci, G. De La Flor and A. Kirov, Bulg. Chem. Commun., 2011, 43, 183–197 CAS.
- C. Slebodnick, J. Zhao, R. Angel, B. E. Hanson, Y. Song, Z. Liu and R. J. Hemley, Inorg. Chem., 2004, 43, 5245–5252 CrossRef CAS PubMed.
- N. P. Funnell, A. Dawson, D. Francis, A. R. Lennie, W. G. Marshall, S. A. Moggach, J. E. Warren and S. Parsons, CrystEngComm, 2010, 12, 2573–2583 RSC.
- M. J. Cliffe and A. L. Goodwin, J. Appl. Crystallogr., 2012, 45, 1321–1329 CrossRef CAS.
Footnote |
| † Electronic supplementary information (ESI) available. CCDC 993575–993581. For ESI and crystallographic data in CIF or other electronic format see DOI: 10.1039/c4ce01730g |
| This journal is © The Royal Society of Chemistry 2014 |

