 Open Access Article
Creative Commons Attribution 3.0 Unported Licence
Nature of conductivity in SrSiO3-based fast ion conductors†
C.
Tealdi
*,
L.
Malavasi
,
I.
Uda
,
C.
Ferrara
,
V.
Berbenni
and
P.
Mustarelli
Department of Chemistry and INSTM, University of Pavia, Viale Taramelli 16, 27100 Pavia, Italy. E-mail: cristina.tealdi@unipv.it
First published on 15th October 2014
Abstract
In this paper we report the preparation and characterization of Sr1−xNaxSiO3−0.5x samples, recently proposed as oxide ion conductors. We show that Na-doping unlikely takes place in the silicate phase, and that a secondary glassy phase is at the origin of the transport properties, thereby suggesting that the conductivity is due only to a limited extent to oxide ion migration in the crystalline system.
Research efforts devoted to the improvement of material properties in the field of solid oxide fuel cells (SOFCs) are extremely active: new compositions as well as ways of improving the performances of existing materials are constantly explored.1 One of the major challenges in this area is lowering the operating temperature to the intermediate temperature regime (<700 °C) while maintaining good electrochemical performances. In this picture, the solid electrolyte plays a central role since its ionic conductivity determines the best operating temperature range. Novel compounds include oxygen-deficient materials possessing the perovskite crystal structure,2 and interstitial-oxygen materials belonging to the families of apatite, melilite1 and scheelite3 crystal structures.
Recently, the Sr1−xKxMO3−0.5x (with M = Si, Ge) family was proposed as a highly promising novel class of electrolyte materials showing good conductivity values (σ ≥ 10−2 S cm−1) at intermediate temperatures.4 K-doped samples in this system were subsequently shown to be highly hygroscopic at room temperature, while Na-doping was proved to be highly effective in introducing purely oxide ion conduction in the system, thanks also to the large range of solubility of Na ions on the Sr site.5,6 Such a solubility, extending up to the composition Sr0.55Na0.45SiO2.775, gives origin to a remarkable oxide ion conductivity (σ ≥ 10−2 S cm−1 at T < 500 °C) and is associated with a very low activation energy for oxide ion migration of about 0.3 eV; the stability range of the ionic conductivity as a function of the oxygen partial pressure was shown to extend down to 10−30 atm.6 Based on such values, the Sr0.55Na0.45SiO2.775 composition represents the best performing electrolyte material for SOFC currently known for temperatures lower than 650 °C.6
The parent SrSiO3 compound is constituted by layers of Sr2+ ions spaced by Si3O9 clusters, where each SiO4 unit is linked through two corner oxygen ions to adjacent tetrahedra forming isolated three-fold rings. Na substitution on the Sr site will originate, for charge compensation, oxygen vacancies responsible for the oxide ion conductivity in the system, according to a mechanism still not completely clear at the moment, as both vacancy and interstitial-mediated mechanisms were discussed.4,5 A neutron powder diffraction study on Na and K-doped samples excluded the presence of interstitial oxygen ions in both the systems and suggested that oxide ion vacancies, consistent with the nominal compositions, are present at r.t. and 400 °C for Sr0.6Na0.4SiO2.8, while a larger oxygen under-stoichiometry is expected at 800 °C.7
In this work we present a detailed study of the structural and transport properties of the Sr1−xNaxSiO3−0.5x series (x = 0.05, 0.25, 0.45). We propose that the complexity of the SiO2–Na2O–SrO phase diagram must be taken into consideration, as the actual solubility degree of Na in the SrSiO3 phase may be significantly lower than expected due to the possibility of formation of secondary, spurious and metastable glassy phases. We show that such secondary phases may be at the origin of the promising transport properties for this class of materials, therefore suggesting the possibility that the high conductivity values previously reported were not significantly due to oxide ion migration in the crystalline system.
Powder samples of nominal composition Sr1−xNaxSiO3−0.5x (x = 0.05, 0.25, 0.45) were prepared by the solid state reaction according to the procedure described by P. Singh et al., at a maximum synthesis temperature of 1050 °C.7 Samples were slowly cooled down to room temperature (1 °C min−1). These samples will be named Na0.05, Na0.25 and Na0.45, respectively. One sample of nominal composition Sr0.55Na0.45SiO2.275 was subsequently retreated at 650 °C for 12 hours and slowly cooled down to room temperature (named Na0.45-RC in the following).
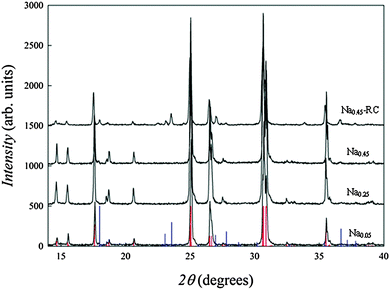
Room temperature X-ray powder diffraction (XRPD) patterns of all the prepared samples were acquired on a Bruker D8-Advance diffractometer with Cu Kα radiation in the 2θ range 10–100 degrees, with fixed steps of 0.02 degrees and counting time per steps of 10 s. Fig. 1 shows the XRPD patterns of the Sr1−xNaxSiO3−0.5x (x = 0.05, 0.25, 0.45) series prepared at 1050 °C. All the patterns can be indexed in the monoclinic C12/c1 space group (no. 15). No spurious reflections can be identified for Na0.05, Na0.25 and Na0.45, and the patterns are consistent with the structure of the parent SrSiO3 compound.8 Sample Na0.45-RC clearly presents additional peaks, mainly compatible with the α polymorph of Na2Si2O5 (see below).
 | ||
| Fig. 1 XRD patterns of the Sr1−xNaxSiO3−0.5x series. Vertical red lines refer to the theoretical Bragg peaks for SrSiO3; vertical blue lines refer to the theoretical Bragg peaks for α-Na2Si2O5. | ||
Rietveld refinement9 was performed using the FullProf software.10Table 1 shows the Rietveld refined cell parameters and unit cell volume obtained from the XRPD measurements for the Sr1−xNaxSiO3−0.5x series prepared at 1050 °C. No clear trend is observed for the evolution of the unit cell volume along with doping. This result suggests that the substitution of Na ions for Sr might not be complete and the actual stoichiometry of the crystalline phase could therefore be different from the nominal one.
| x | a (Å) | b (Å) | c (Å) | β (°) | V (Å3) |
|---|---|---|---|---|---|
| 0.05 | 12.3530(4) | 7.1558(2) | 10.9009(3) | 111.617(1) | 895.82(5) |
| 0.25 | 12.3418(3) | 7.1513(2) | 10.8914(2) | 111.581(2) | 893.89(4) |
| 0.45 | 12.3536(6) | 7.1527(3) | 10.9046(5) | 111.710(3) | 895.21(8) |
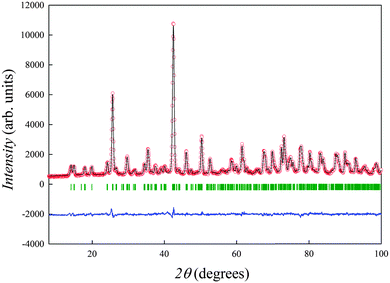
In order to assess this aspect, room temperature neutron powder diffraction (NPD) measurements were acquired on the HRPT instrument at the Paul Scherrer Institute (PSI, Villigen) in the 2θ range 10–100 degrees. Rietveld refinement allowed in this case to extract the occupancies of Na ions on the Sr site, as well as to estimate the degree of possible oxygen under-stoichiometry. Fig. 2 shows the Rietveld refined pattern for the sample of nominal composition Sr0.75Na0.25SiO2.875. Rietveld refinements and the structural parameters for all the samples are reported as Fig. S1 and Table S1, respectively (ESI†). Analysis of the refined parameters (Table S1, ESI†) confirms that this series does not obey the Vegard's law for solid solutions. If allowed to change in the refinement, the Na occupancy on the Sr sites tends to zero (and the Sr site keeps the full occupancy), while the oxygen sites tend to full occupancy, so that the composition derived from the analysis of the neutron diffraction data is in agreement, within the experimental errors, with nominal SrSiO3 composition for all the three samples.
Differential Scanning Calorimetry (DSC) measurements were performed from room temperature up to 600 °C with a scan rate of 20 °C min−1 in N2 flux on the Na0.45 sample, and showed a sigmoidal feature suggestive of a glass transition just below 500 °C (Fig. S2, ESI†). Following such an indication, the sample Na0.45 was subsequently retreated at 650 °C for 12 hours and slowly cooled down to room temperature (sample Na045-RC). The XRD pattern of this sample in Fig. 1 clearly shows the appearance of additional peaks compared to those ascribed to the crystalline SrSiO3 phase. The most intense peaks among such reflections can be attributed to α-Na2Si2O5. Fig. S3 (ESI†) shows the two-phase Rietveld refined NPD pattern of this sample considering SrSiO3 and α-Na2Si2O5. A good agreement between the calculated and the experimental pattern is found by considering these two phases, with minor contributions possibly related to different Na2Si2O5 polymorphs or other secondary phases still unexplained.
Solid-state MAS NMR measurements were acquired on a 9.4 T magnet using a 7.0 mm probe. 29Si spectra were recorded at a spinning rate of 5 kHz, at ambient temperature with a single pulse experiment (3.00 μs pulse), a delay of 300 seconds and 4k scans. The spectra were referred to TMS.
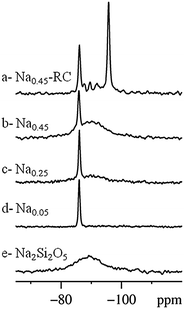
In Fig. 3 the 29Si spectra of samples Na0.05 (d), Na0.25 (c) and Na0.45 (b) are shown, together with the 29Si spectra of the samples Na0.45-RC (a) and of a properly prepared Na2Si2O5 glassy sample (e). The spectrum of the Na0.05 sample presents a single sharp peak centered at −86 ppm. With the introduction of higher Na content in the structure, a new broad peak centered at ∼ −89 ppm appears; the relative intensity of the broad peak with respect to that of the signal at −86 ppm grows along with the increase of the Na content. Fig. 3a reports the spectrum of the sample Sr0.55Na0.45SiO3 recrystallized at 650 °C (Na0.45-RC). For this sample, the broad signal disappears while a new sharp resonance at −95.7 ppm is observed. Other weak signals appear at −87.7, −89.6 and −91.9 ppm. We recall that for this sample, recrystallized at 650 °C, also the XRD data show additional peaks (Fig. 1) compared to the starting sample Na0.45.
The peak at −86 ppm observed in each sample is related to the crystalline SrSiO3-based phase.11,12 The position and the broadening of this signal do not seem to be affected by the nominal composition of the samples, suggesting the formation of pure SrSiO3, independently of the increasing amount of Na present in the starting reagent mixture. The solubility of Na in the SrSiO3 phase thus seems to be extremely low, in agreement with the NPD analysis. This hypothesis is also supported by the appearance of the broad peak at ∼ −89 ppm with the introduction of Na in the system, indicative of the formation of a new disordered phase (see below and Fig. 3e) whose content increases as the nominal Na content in the sample does. This second phase has been identified with glassy Na2O·2SiO2. In fact, it can be formed with respect to the nominal stoichiometry of the initial mixtures for the different compositions, if we assume limited solubility of Na on the Sr site of SrSiO3. This is confirmed by the spectrum of Na0.45-RC (Fig. 3a). The peak at −95.7 ppm has been attributed to silicon in the crystalline α-Na2Si2O5 phase.13 The small peaks between −87 and −92 ppm can be attributed to minor contributions from other unidentified recrystallized species, as also observed in the XRD patterns.
In order to support the identification of the glassy phase, a sample of nominal composition Na2Si2O5 was prepared from the solid state reaction under the same synthetic conditions used for the Sr1−xNaxSiO3−0.5x series. Its NMR spectrum (Fig. 3e) clearly resembles the broad peak of the Na-containing samples. The broadening of the signal clearly evidences the amorphous nature of this product, as also confirmed by the XRD pattern (see Fig. S4, ESI†).
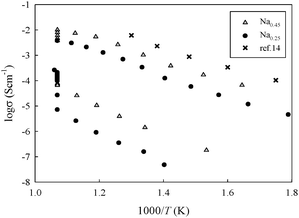
In order to investigate the effects of the glassy phase on the transport properties, impedance spectroscopy measurements were performed. The powders were isostatically pressed to form 1 cm diameter thin cylindrical pellets and then sintered at 1000 °C as described elsewhere.5 Platinum-sputtered electrodes were placed on both sides of each sintered pellet. Two-probes AC impedance spectroscopy measurements were carried out under static air in the temperature range 300–680 °C, using a Solartron 1286 equipped with a Frequency Response Analyzer 1287 in the frequency range 1 Hz–10 MHz. Isothermal acquisitions as a function of time were performed at approximately 650 °C in order to follow the evolution of the conductivity during the possible recrystallization of the sample. Fig. 4 shows the Arrhenius plots of conductivity for the Na0.25 and Na0.45 samples, together with data of glassy-Na2Si2O5.14 This graph shows that a considerable drop in conductivity is achieved when the sample is maintained at a specific temperature for a certain time (overnight). The drop in conductivity is associated with the partial recrystallization of the sample, as followed ex situ with both XRD and NMR.
 | ||
| Fig. 4 Arrhenius plot of the Na0.45 and Na0.25 sample indicating the drop in conductivity during the isothermal treatment. Comparison with data derived from Na diffusion coefficient values in glassy-Na2Si2O5 reported in ref. 14. | ||
The similarity in the slope of the Arrhenius plot for glassy Na2Si2O5 and our samples before recrystallization is remarkable. The absolute values of conductivity of the pure glassy phase are higher than our data for the sample of nominal composition Sr0.55Na0.45SiO2.775. This is likely due to a dilution effect, since our samples are two-phases in nature (glassy Na2Si2O5 dispersed in the insulating SrSiO3 crystalline phase). The conductivity data reported in Fig. 4 are lower than those reported for the same nominal compositions5 but in agreement with the data reported for Sr0.8K0.2Si0.5Ge0.5O2.9.15
This study reported a powerful combination of X-ray and neutron diffraction, solid-state 29Si NMR, differential scanning calorimetry and impedance spectroscopy measurements used to investigate the structural and transport properties of the Sr1−xNaxSiO3−0.5x series, recently indicated as a novel family of oxide ion conductors with potential high impact for SOFCs.
The results presented here clearly evidenced that the actual solubility degree of Na in the SrSiO3 phase is significantly lower than expected due to the formation of a secondary and metastable glassy phase, thus leading to a very low amount of oxygen vacancies with respect to the nominal stoichiometry. We showed that such a secondary phase may be at the origin of the promising transport properties of these materials. Most probably, the high conductivity values previously reported are due only to a limited extent to oxide ion migration in the crystalline system, in addition to transport of Na ions in the glassy phase, in agreement with a very recent work.16 This suggestion could also be consistent with the very low activation energy reported for this family of oxides compared to conventional oxide ion conductors.6 We recognize that the degree of crystallization–amorphization of the system may be strongly dependent on the synthesis conditions and therefore different results, especially for what concern the conductivity data, may be obtained. However, this study suggests that attention should be paid in the interpretation of data related to compositions that may easily give origin to glassy phases, such as alkaline-doped silicates, as suggested also in our previous work.17
We are grateful to CARIPLO Foundation (project 2009-2623) and to Dr Vladimir Pomjakushin for the NPD measurements.
Notes and references
- L. Malavasi, C. A. J. Fisher and S. M. Islam, Chem. Soc. Rev., 2010, 39, 4370 RSC.
- M. Li, M. J. Pietrovski, R. A. De Souza, H. Zhang, I. M. Reaney, S. N. Cool, J. A. Kilner and D. C. Sinclair, Nat. Mater., 2014, 13, 31 CrossRef CAS PubMed.
- C. Li, R. D. Bayliss and S. J. Skinner, Solid State Ionics, 2014, 262, 530 CrossRef CAS PubMed.
- P. Singh and J. B. Goodenough, Energy Environ. Sci., 2012, 5, 9626 CAS.
- P. Singh and J. B. Goodenough, J. Am. Chem. Soc., 2013, 135, 10149 CrossRef CAS PubMed.
- T. Wei, P. Singh, Y. Gong, J. B. Goodenough, Y. Huang and K. Huang, Energy Environ. Sci., 2014, 7, 1680 CAS.
- R. Martinez-Coronado, P. Singh, J. Alonso-Alonso and J. B. Goodenough, J. Mater. Chem. A, 2014, 2, 4355 CAS.
- F. Nishi, Acta Crystallogr., Sect. C: Cryst. Struct. Commun., 1997, 53, 534 Search PubMed.
- H. M. Rietveld, J. Appl. Crystallogr., 1969, 2, 65 CrossRef CAS.
- J. Rodriguez-Carvajal, Physica B, 1993, 192, 55 CrossRef CAS.
- K. A. Smith, R. J. Kirpatrick, E. Oldfield and D. M. Henderson, Am. Mineral., 1983, 68, 1206 CAS.
- J. Xu, X. Wang, H. Fu, C. M. Brown, X. Jing, F. Liao, F. Lu, X. Li, X. Kuang and M. Wu, Inorg. Chem., 2014, 53, 6962 CrossRef CAS PubMed.
- L. Marte, S. Cadars, E. Véron, D. Massiot and M. Deschamps, Solid State Nucl. Magn. Reson., 2012, 45–46, 1 CrossRef PubMed.
- C. Kaps, J. Non-Cryst. Solids, 1984, 65, 189 CrossRef CAS.
- R. D. Byliss, S. N. Cook, S. Fearn, J. A. Kilner, C. Graves and S. Skinner, Energy Environ. Sci., 2014, 7, 2999 Search PubMed.
- I. R. Evans, J. S. O. Evans, H. G. Davies, A. R. Haworth and M. L. Tate, Chem. Mater., 2014, 26, 5187 CrossRef CAS.
- C. Tealdi, G. Chiodelli, S. Pin, L. Malavasi and G. Flor, J. Mater. Chem. A, 2014, 2, 907 CAS.
Footnote |
| † Electronic supplementary information (ESI) available: Rietveld refined NPD patterns and structural parameters; DCS measurement; XRDP of Na2Si2O5. See DOI: 10.1039/c4cc07025a |
| This journal is © The Royal Society of Chemistry 2014 |


