 Open Access Article
Creative Commons Attribution 3.0 Unported Licence
Uniaxial negative thermal expansion facilitated by weak host–guest interactions†
Emile R.
Engel
,
Vincent J.
Smith
,
Charl X.
Bezuidenhout
and
Leonard J.
Barbour
*
Department of Chemistry and Polymer Science, University of Stellenbosch, Private Bag X1, Matieland, 7602, South Africa. E-mail: ljb@sun.ac.za
First published on 5th March 2014
Abstract
A nitromethane solvate of 18-crown-6 was investigated by means of variable-temperature single-crystal X-ray diffraction in response to a report of abnormal unit cell contraction. Exceptionally large positive thermal expansion in two axial directions and negative thermal expansion along the third was confirmed. The underlying mechanism relies exclusively on weak electrostatic interactions to yield a linear thermal expansion coefficient of −129 × 10−6 K−1, the largest negative value yet observed for an organic inclusion compound.
A computational tool developed by van de Streek and Motherwell was used to search the Cambridge Structural Database for previously unidentified polymorphs. Two structures of the nitromethane solvate of 18-crown-6 (18C6N) were flagged (both in the space group P21/n with a host–guest ratio of 1
![[thin space (1/6-em)]](https://www.rsc.org/images/entities/char_2009.gif) :
:![[thin space (1/6-em)]](https://www.rsc.org/images/entities/char_2009.gif) 2). The authors described the pair not as polymorphs but as an example of “extremely anisotropic unit cell contraction”.1
2). The authors described the pair not as polymorphs but as an example of “extremely anisotropic unit cell contraction”.1
Unit cell dimensions for 18C6N were first reported by McLachlan2 and the single-crystal X-ray structure determined by De Boer and co-workers.3 The structure was later redetermined at 22 °C to greater precision by Rogers et al., who also investigated the crystal structure at −150 °C and concluded that at low and high temperature, the crystal has “essentially the same structure except for the obvious exception of weak CH⋯O bonds”.4 Indeed, the two structures reported by Rogers were those identified in the van de Streek and Motherwell polymorph search.
For the present study, crystals of 18C6N were prepared by dissolving 18-crown-6 in hot nitromethane, followed by filtering and allowing for slow evaporation of the solvent. A crystal was selected while under mother liquor, removed and its surface immediately coated with epoxy to prevent desolvation. The crystal was then glued to the end of a glass fibre and mounted on a goniometer under a liquid nitrogen stream at 90 K. Full intensity datasets were collected and the single-crystal X-ray structures were determined at regular temperature intervals in the range 90–273 K; unit cell dimensions were determined to high precision with e.s.d. values in the range 0.0010–0.0023 Å for axis lengths. The b and c unit cell lengths increased steadily and dramatically with temperature while the a axis contracted from 9.31 to 9.12 Å. No abrupt changes were observed that might indicate a phase transformation (Fig. S1, ESI†).
Reports of anomalous thermal expansion have become more frequent in recent years but are dominated by inorganic negative linear and volumetric thermal expansion. Typical examples include silicates and zirconium tungstenates that incorporate strong covalent bonds as well as MOF-5 and related IRMOFs constructed with metal–ligand coordination bonds.5,6 In comparison, organic compounds displaying these properties are still relatively rare, though remarkable examples exist.7
The degree of linear thermal expansion has been quantified using a coefficient defined as αl = (lT − l0)/(l0(T − T0)) where lT is the axis length at the final temperature T and l0 the axis length at the initial temperature T0. Similarly, the coefficient of volumetric thermal expansion is αv = (VT − V0)/(V0(T − T0)) where VT is the unit cell volume at temperature T and V0 the volume at T0. An important adjustment is needed for crystal systems where the unit cell axes are not mutually orthogonal.6 It is necessary to determine an orthogonal set of axes and to calculate coefficients of linear thermal expansion along these principal axes instead of the crystallographic axes (i.e. a strain calculation). The principal axes are labelled X1, X2 and X3 and are assigned in order of increasing magnitude.
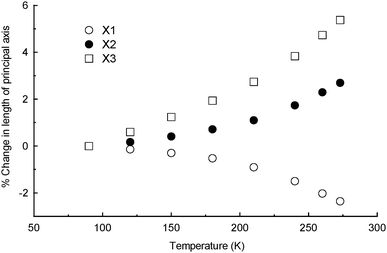
For 18C6N in the 90–273 K temperature range, principal axes and linear expansion coefficients were calculated using the programme PASCal.8 The X1, X2 and X3 axes are approximately along [−60−1], [−101] and [0−10], respectively. Fig. 1 shows how the principal axis lengths change with increasing temperature. The contraction of X1 is overwhelmingly influenced by changes along the crystallographic a axis and, similarly, the expansion of X2 is dominated by changes in the c direction. Fig. S2 (ESI†) illustrates the orientation of X1 and X2 with respect to the crystallographic unit cell. The coefficients of linear thermal expansion are −129(15), 144(14) and 282(16) × 10−6 K−1 for X1, X2 and X3, respectively. The coefficient of volumetric thermal expansion is 311(17) × 10−6 K−1. The negative component of thermal expansion is at least four times greater than that reported recently for another multi-component organic crystal (a complex containing 1,3,5-benzenetricarboxylic acid, 2,6-dimethylaniline and water) and calculated over a similar temperature range (120–300 K).9
A temperature-resolved powder X-ray diffraction experiment (Fig. S3, ESI†) was carried out by cooling a sample of 18C6N from 293 K to 123 K and then heating to 273 K while collecting data at 30 K intervals. The results show a gradual, smooth transition between the high and low temperature PXRD patterns as is typical of thermal expansion phenomena that do not involve phase transitions. The absence of 18C6N phase transformations was confirmed by a DSC experiment (Fig. S4, ESI†). Only minor thermal events were identified where residual nitromethane freezes and melts.
Two analogues of 18C6N were examined for similar behaviour given that they crystallise with similar structures. The acetonitrile solvate of 18-crown-6 had already been reported with structures determined at 123 K and room temperature; the room temperature structure crystallises in the space group P21/n (i.e. as does 18C6N) but the low temperature structure is triclinic, suggesting that a temperature-induced phase transformation may occur.10 We prepared the iodomethane solvate for the first time and structural data in the temperature range 90–273 K indicate different degrees of positive thermal expansion along all axes, with the largest coefficient of linear thermal expansion being 129(5) × 10−6 K−1 for X3. However, neither analogue appears to emulate the large negative linear thermal expansion observed over a broad temperature range for 18C6N. It is therefore clear that the thermal expansion properties of this organic inclusion compound system may be dramatically influenced by changing the guest even if the overall packing arrangement is preserved. Indeed, the expansion along one axis switches from negative to positive by replacing nitromethane with iodomethane. This phenomenon has been alluded to but not previously observed.11
Several mechanisms resulting in negative thermal expansion have been described. Arguably the most important of these have involved bridging atoms and rigid unit vibrational modes; magnetostriction; and electronic effects.6,12 Das et al. reported extremely large positive and negative thermal expansion for a dumbbell-shaped organic molecule. The mechanism was shown to depend on a helical pattern of strong O–H⋯O hydrogen bonds.13 The 1,3,5-benzenetricarboxylic acid-based compound mentioned earlier is a salt hydrate with an extensive network of ionic and hydrogen bonds. In contrast, an organic polymorph with no ionic interactions or hydrogen bonds was reported recently as undergoing remarkable anisotropic thermal expansion. The mechanism in that case is said to depend on steric effects.14 In 18C6N there is a similar absence of strong directional intermolecular interactions.
A variety of interactions were investigated computationally for 18C6N (details provided in the ESI†). The most dominant of these appears to be the host–guest interaction where the guest methyl group is inserted into the crown cavity (−7.16 kcal mol−1) (Fig. S5a, ESI†). These interactions facilitate the formation of 1![[thin space (1/6-em)]](https://www.rsc.org/images/entities/char_2009.gif) :
:![[thin space (1/6-em)]](https://www.rsc.org/images/entities/char_2009.gif) 2 host–guest adducts that can be considered as supramolecular building blocks (Fig. S5c, ESI†). Although their cumulative effect is strongly stabilising, it is mainly weak C–H⋯O hydrogen bonds that contribute to this interaction. Generally, C–H⋯O bonds are in the range 3–4 Å for the donor–acceptor atom distance and 110° is accepted as a lower limit for the hydrogen bond angle.15 The most linear of the hydrogen bonds in 18C6N is C7–H⋯O1 with an angle of 175.4° and a C–O distance of 3.305(1) Å while the shortest C–O contact is 3.132(1) Å in length with a C–H⋯O angle of 106° (close to the accepted lower limit).
2 host–guest adducts that can be considered as supramolecular building blocks (Fig. S5c, ESI†). Although their cumulative effect is strongly stabilising, it is mainly weak C–H⋯O hydrogen bonds that contribute to this interaction. Generally, C–H⋯O bonds are in the range 3–4 Å for the donor–acceptor atom distance and 110° is accepted as a lower limit for the hydrogen bond angle.15 The most linear of the hydrogen bonds in 18C6N is C7–H⋯O1 with an angle of 175.4° and a C–O distance of 3.305(1) Å while the shortest C–O contact is 3.132(1) Å in length with a C–H⋯O angle of 106° (close to the accepted lower limit).
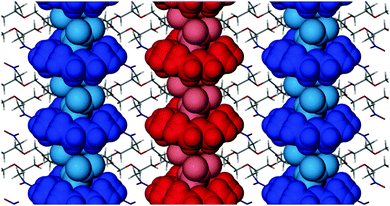
The next strongest interaction occurs between two guest molecules (of adjacent hosts) which have their dipoles orientated in opposite directions along the b axis (Fig. S5b, ESI†). The stabilisation energy of this interaction is −2.22 kcal mol−1. These interactions link adjacent host–guest adducts together in columns parallel to the b axis. Thus a combination of weak host–guest C–H⋯O hydrogen bonds and long-range dipole–dipole stabilisation promotes the formation of columns that dominate the crystal packing (Fig. 2).
 | ||
| Fig. 2 Packing diagram of 18C6N viewed along [100]. Host–guest columns that extend along the crystallographic b axis are shown in blue and red. | ||
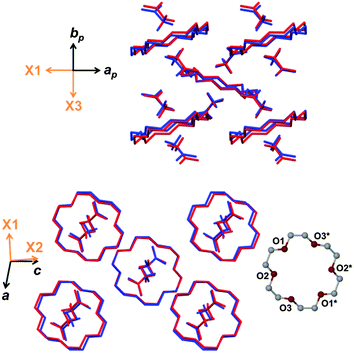
Several features contribute to the complex mechanism of negative linear thermal expansion and it is useful to separate these components by considering molecular movement in each of the crystallographic axial planes. First consider the ab plane shown in Fig. 3 (top). The distance between adjacent guest molecules along the b axis increases as expected with increasing temperature. Similarly the distance between the host and guest centroids increases steadily. In general intermolecular interactions lengthen with increasing temperature because atomic vibrations become larger and because the vibrations are anharmonic.6 While the adjacent guests move apart with increasing temperature the host–guest adducts tilt (i.e. the plane of the non-hydrogen atoms of the host crown ether becomes less perpendicular to the b axis). The combined effect of increasing intermolecular distances and tilting of the host–guest adducts accounts for the large expansion of X3.
 | ||
| Fig. 3 Projections of the ab (top) and ac (bottom) planes with overlaid structures at 90 K (blue) and 273 K (red). Hydrogen atoms have been omitted for clarity. | ||
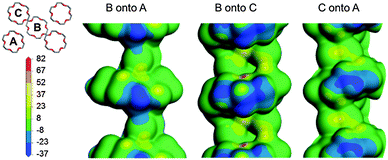
In the ac plane (Fig. 3, bottom) conformational adjustment of the crown ether molecule is concomitant with the host–guest columns shifting apart along [001] and closer together along [100]. The molecular electrostatic potential maps in Fig. 4 shed light on why the three unique pairs of adjacent columns shift as they do relative to one another. The three maps provide an indication of the relative strength of electrostatic attraction between the columns of each pair. The map of B onto C shows the greatest negative electrostatic potential and the only region of high positive potential, indicating that the B–C interaction is the strongest of the three. Since the B–A and C–A interactions are weaker they are more easily overcome when the crystal is heated. While the B–C spacing is preserved, the B–A and C–A distances shrink in response to an increase in temperature and this manifests as a contraction of X1.
 | ||
| Fig. 4 The molecular electrostatic potential of each column is mapped onto the electron density contour of an adjacent column. The scale bar values are given in kcal mol−1. | ||
Across the centre of the crown ether molecule the O1–O1* and O3–O3* (* denotes a relationship about a site of −1 symmetry) distances shrink by 0.038 Å and 0.060 Å, respectively. These contractions are consistent with the contraction of X1. The O2–O2* distance increases by 0.093 Å and contributes to the expansion of X2. Interestingly, two C–H⋯O contact distances become shorter as the temperature increases. One of these is the convincing hydrogen bond C7–H⋯O1 with a high degree of linearity that is mostly preserved with increasing temperature.
In the bc plane it is clear that the guest methyl rotates as the temperature changes (Fig. S5, ESI†). The potential for rotation about the N1–C7 bond is the reason the C7–H⋯O1 hydrogen bond remains intact and indeed shortens despite an increase in temperature and changes in the host conformation.
Variable temperature structure determination has confirmed that 18C6N undergoes large anisotropic thermal expansion in the temperature range 90–273 K without any phase transformation. Weak C–H⋯O hydrogen bonds facilitate the formation of 1![[thin space (1/6-em)]](https://www.rsc.org/images/entities/char_2009.gif) :
:![[thin space (1/6-em)]](https://www.rsc.org/images/entities/char_2009.gif) 2 host–guest adducts and dipole–dipole stabilisation allows these adducts to stack as columns. The mechanism giving rise to the negative component of thermal expansion involves anisotropic shifting of host–guest columns relative to one another with simultaneous adjustments in molecular conformation. Negative uniaxial thermal expansion in the absence of strong directional interactions is extremely rare and the case presented here confirms that weak interactions may give rise to this phenomenon. Furthermore, this study raises the exciting prospect that extreme thermal expansion anisotropy in isoskeletal organic inclusion compounds might be controlled by simple variation of the guest, even to the extent of complete reversal.16
2 host–guest adducts and dipole–dipole stabilisation allows these adducts to stack as columns. The mechanism giving rise to the negative component of thermal expansion involves anisotropic shifting of host–guest columns relative to one another with simultaneous adjustments in molecular conformation. Negative uniaxial thermal expansion in the absence of strong directional interactions is extremely rare and the case presented here confirms that weak interactions may give rise to this phenomenon. Furthermore, this study raises the exciting prospect that extreme thermal expansion anisotropy in isoskeletal organic inclusion compounds might be controlled by simple variation of the guest, even to the extent of complete reversal.16
We are grateful to the SARChI Programme of the Department of Science and Technology and the National Research Foundation (South Africa) for financial support.
Notes and references
- J. van de Streek and S. Motherwell, Acta Crystallogr., Sect. B: Struct. Sci., 2005, 61, 504 Search PubMed.
- R. D. McLachlan, Spectrochim. Acta, Part A, 1974, 30, 2153 CrossRef.
- J. de Boer, D. Reinhoudt, S. Harkema, G. J. van Hummel and F. de Jong, J. Am. Chem. Soc., 1982, 104, 4073 CrossRef CAS.
- (a) R. D. Rogers and L. M. Green, J. Inclusion Phenom., 1986, 4, 77 CrossRef CAS; (b) R. D. Rogers and P. D. Richards, J. Inclusion Phenom., 1987, 5, 631 CrossRef CAS.
- T. A. Mary, J. S. O. Evans, T. Vog and A. W. Sleight, Science, 1996, 272, 90 CAS.
- G. D. Barrera, J. A. O. Bruno, T. H. K. Barron and N. L. Allan, J. Phys.: Condens. Matter, 2005, 17, R217 CrossRef CAS.
- (a) M. Zakrzewski and M. A White, J. Phys. Chem., 1990, 94, 2203 CrossRef CAS; (b) H. Birkedal, D. Schwarzenbach and P. Pattison, Angew. Chem., Int. Ed., 2002, 41, 754 CrossRef CAS; (c) R. H. Jones, K. S. Knight, W. G. Marshall, J. Clews, R. J. Darton, D. Pyatt, S. J. Coles and P. N. Horton, CrystEngComm, 2014, 16, 237 RSC.
- J. Cliffe and A. L. Goodwin, J. Appl. Crystallogr., 2012, 45, 1321 CrossRef.
- S. Bhattacharya and B. K. Saha, Cryst. Growth Des., 2012, 12, 4716 CAS.
- (a) R. D. Rogers, P. D. Richards and E. J. Voss, J. Inclusion Phenom. Mol. Recognit. Chem., 1988, 6, 65 CrossRef CAS; (b) R. L. Garrell, J. C. Smyth, F. R. Fronczek and R. D. Gandour, J. Inclusion Phenom. Mol. Recognit. Chem., 1988, 6, 73 CrossRef CAS.
- I. E. Collings, M. G. Tucker, D. A. Keen and A. L. Goodwin, CrystEngComm, 2014 10.1039/C3CE42165A.
- W. Zhou, H. Wu, T. Yildirim, J. R. Simpson and A. R. Hight Walker, Phys. Rev. B: Condens. Matter Mater. Phys., 2008, 78, 054114 CrossRef.
- D. Das, T. Jacobs and L. Barbour, Nat. Mater., 2010, 9, 36 CrossRef CAS PubMed.
- S. Bhattacharya and B. K. Saha, CrystEngComm, 2014, 16, 2340 RSC.
- G. Desiraju, Acc. Chem. Res., 1996, 29, 441 CrossRef CAS PubMed.
- (a) G. O. Lloyd, J. Alen, M. W. Bredenkamp, E. J. C. de Vries, C. Esterhuysen and L. J. Barbour, Angew. Chem., Int. Ed., 2006, 45, 5354 CrossRef CAS PubMed; (b) L. J. Barbour, D. Das, T. Jacobs, G. O. Lloyd and V. J. Smith, Supramolecular Chemistry: From Molecules to Nanomaterials, John Wiley & Sons, 2012 Search PubMed.
Footnote |
| † Electronic supplementary information (ESI) available: Synthesis, experimental methods, summaries of crystallographic data, PXRD diffractograms, computational parameters and thermal analysis. CCDC 984223–984232. For ESI and crystallographic data in CIF or other electronic format see DOI: 10.1039/c4cc00849a |
| This journal is © The Royal Society of Chemistry 2014 |

