 Open Access Article
Creative Commons Attribution 3.0 Unported Licence
Surface-confined core–shell structures based on gold nanoparticles and metal–organic networks†
Revital
Kaminker
a,
Michal
Lahav
a,
Marc
Altman
a,
Guennadi
Evmenenko
b,
Pulak
Dutta
b,
Antonino
Gulino
c and
Milko E.
van der Boom
*a
aDepartment of Organic Chemistry, Weizmann Institute of Science, 76100, Rehovot, Israel. E-mail: milko.vanderboom@weizmann.ac.il
bDepartment of Physics and Astronomy and Department of Materials Science and Engineering, Northwestern University, Evanston, IL 60208, USA
cDipartimento di Scienze Chimiche, Università di Catania, Catania 95125, Italy
First published on 27th February 2014
Abstract
Here we show a step-wise approach for the formation of continuous shell-structures on surface-confined gold nanoparticles. The nanoparticle-cores induce order in the shell-structure, which consists of metal–organic networks. Communication between the organic and inorganic parts is reflected in their optical properties.
The formation of molecular thin films has been the focus of extensive research efforts directed towards the design of organic-based devices.1 The combination of organic films and inorganic materials such as metallic nanoparticles (NPs) can result in synergistic effects and new materials that possess functions that are not attainable with single-component systems.2–4 The a priori design of organic–inorganic materials with control over their composition, structure, and function is challenging because many factors are involved, for example, weak intermolecular forces, substrate morphology, and dielectric media.5 Combining metallic NPs with organics has led to hybrid materials with interesting and useful properties.6a For example, surface plasmonic effects of metallic nanoparticles on the performance of polymer-based solar cells have been reported.2a,6b Moreover, the localized surface plasmon resonance (LSPR) of metallic nanostructures is known to be highly sensitive to its environment and has been used for detecting various analytes including explosives.7 Rubinstein et al. showed that the LSPR of Au-nanostructures provides structural information about its molecular-based coating.8
We demonstrate here that the combination of an AuNP sub-monolayer with a metal–organic network (MON)9 results in surface-confined core–shell nanostructures10 (AuNP-MONs) with enhanced optical absorption of both components (Scheme 1). Our MON assembly strategy is compatible with the different surfaces in a single setup. The metallic nanoparticles' and the organic monolayer surface were simultaneously functionalized with the MON. The use of the AuNPs resulted in an ordered MON, which is essentially a continuous shell embedding numerous cores.
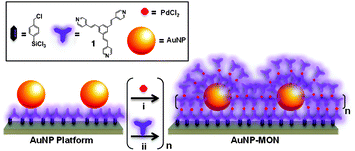 | ||
| Scheme 1 Schematic illustration of the stepwise formation of the surface-confined core–shell nanostructures (AuNP-MON) on a pyridyl-terminated monolayer (Scheme S1, ESI†)9 covalently bound to glass or silicon substrates. | ||
Citrate-capped AuNPs (11.8 ± 1.3 nm, measured by transmission electron microscopy; TEM) were attached to glass and silicon substrates functionalized with a pyridyl-terminated monolayer (Scheme 1 and Scheme S1, ESI†). These surface-confined AuNPs were characterized using UV/vis spectroscopy, ellipsometry, scanning electron microscopy (SEM), and atomic force microscopy (AFM). A LSPR band at λmax = 516 nm was observed by UV/vis spectroscopy, indicating that the citrate-capped AuNPs have a diameter of ∼12 nm (Fig. S1 and S2, ESI†).11 Ellipsometry measurements showed significantly different ψ and Δ parameters for the pyridyl-terminated monolayer before and after decoration with AuNPs (Fig. S3, ESI†). These changes are expected for a large increase in the film thickness.12,13 Both SEM and AFM analyses indicated a surface coverage with mainly individual and spherical AuNPs having an average interparticle distance of ∼27 nm (Fig. 1). The SEM-derived AuNP surface coverage is ∼16%. The UV/vis spectroscopy, AFM, and SEM measurements indicate that there is no evident change in the AuNPs' dimensions, shape, and singularity when going from a solution to surface-bound AuNPs. The AuNPs bind to the pyridyl-terminated surface and do not aggregate due to the interparticle electrostatic repulsion of the negatively charged citrate capping layer.14 The low AuNP coverage indicates that both the pyridyl-terminated monolayer and the surface of the AuNPs are available for forming the MON. Ligands such as 115 can bind to citrate-capped AuNPs in solution, resulting in the formation of aggregates.16
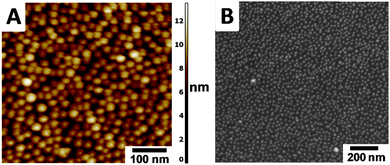 | ||
| Fig. 1 AuNPs on silicon functionalized with a pyridyl-terminated monolayer (Scheme S1, ESI†).9 (A) AFM image; the convolution limitation of the tip resulted in an overestimation of the AuNP diameter (Fig. S4, ESI†).17 (B) SEM image showing an average AuNP distance of ∼27 nm. | ||
The AuNP-MONs were obtained by an iterative deposition process of PdCl2 and 1 on the AuNP platform (Scheme 1). No stabilization treatments were needed and the AuNP-functionalized substrates were used as is for the MON formation. The substrates were immersed in a THF solution of 1 (1.0 mM) for 15 min. Next, the samples were sonicated repeatedly in common organic solvents and dried under a stream of N2. Subsequently, the samples were immersed in a THF solution of PdCl2(PhCN)2 (1.0 mM; 15 min), and then sonicated in the same manner as was the 1-terminated layer. These two depositions were repeated 8 times to create the shell structure. Previously we formed MONs directly on pyridyl-terminated monolayers in the absence of AuNPs (Fig. 2 inset, Fig. S1, ESI†).9
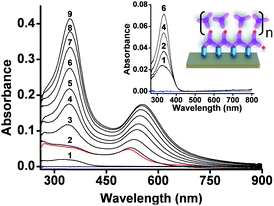 | ||
| Fig. 2 UV/vis spectra showing the stepwise formation of AuNP-MON on a glass substrate. The first absorption spectrum (1) corresponds to the pyridyl-terminated monolayer (Fig. S2, ESI†). The red spectrum corresponds to the AuNP sub-monolayer (Scheme 1). Spectra 2–9 were recorded after each deposition of 1. Inset: UV/vis absorption spectra taken from ref. 9 with λmax ≈ 335 nm and a schematic illustration of the MON in the absence of the AuNPs. Data are shown for chromophore deposition steps 1, 2, 4, and 6. The baselines (blue) were recorded using bare slides. | ||
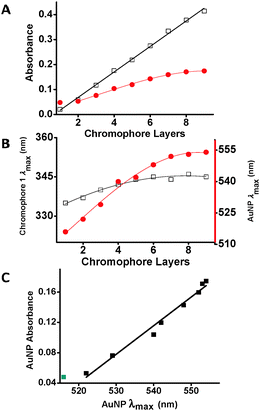
The UV/vis spectra of the AuNP-MONs were recorded after each chromophore (1) deposition step (Fig. 2). Each step resulted in increased absorption intensities for both the LSPR band (λmax = 516–554 nm) and the chromophore band (λmax ≈ 335 nm). This latter absorption band is ∼3× higher (after subtracting the AuNP absorption) than the band of the MON grown directly on the pyridyl-terminated monolayer.9 This significant difference most likely results from the large surface area generated by the AuNPs. Taking into consideration the surface area of the AuNPs (450 nm2 per AuNP) and their coverage (16%), the total surface area is enhanced by ∼1.5×. Part of the AuNP surface is bound to the pyridyl-terminated monolayer and is not available for MON binding. Another factor contributing to the absorption intensity increase might involve energy transfer between the AuNP plasmon and molecular excitons.18 Intermolecular interactions are not apparent but cannot be excluded for this type of chromophores.9 The maximum position of the chromophore band is red shifted by only 9 nm for AuNP-MON having 9 layers of 1. The deposition of the PdCl2 salt has less effect on the optical signature of the AuNP-MON (Fig. S2, ESI†).
The MON formation on the AuNPs platform changes its effective dielectric media.13 This change is shown by a red shift of the AuNP absorption band (Δλmax = 38 nm) and an intensity increase (3.3×) of the characteristic LSPR band after the deposition of 8 chromophore layers. However, the changes in these optical properties level-off after 6 chromophore depositions (Fig. 3A and B), demonstrating that the influence of the MON thickness on the AuNP optical properties is significant up to ∼4 nm. A linear correlation was observed between the absorbance of the LSPR band and its wavelength (λmax) (Fig. 3C).
X-ray photoelectron spectroscopy (XPS) is an established method to derive detailed information of metal–organic assemblies.8,9,19a–c,24 Our angle-resolved XPS measurements revealed an elemental Pd/N ratio of ∼0.53 for takeoff angles in the range 5–80° for AuNP-MON (after 6 chromophore depositions; Table S1, ESI†). A similar Pd/N ratio (0.54) was observed for the MON formed without the AuNPs.9 These observations are in agreement with the formation of homogeneous structures with quantitative pyridine–palladium–pyridine coordination. The expected Pd/N ratio for a fully formed coordination network is 0.5. Ligands such as 1 form square-planar complexes by coordination of the pyridine moieties to PdCl2 in a trans-configuration.9 Interestingly, the XPS spectra showed the Au 4f7/2 and 4f5/2 signals at 83.2 and 86.9 eV, respectively. These binding energy values are relatively low,19d,e which is in good agreement with coordination of chromophore 1. The C 1s spectrum does not show the presence of the citrate ligand (∼289 eV) indicating an efficient capping layer exchange process. Deconvolution of the N 1s signal showed a main peak at 400.1 eV (N–Pd, N) and smaller peaks at 401.9 eV (N+) and at 398.9 eV (N–Au). The ratio between these three peaks is 12![[thin space (1/6-em)]](https://www.rsc.org/images/entities/char_2009.gif) :
:![[thin space (1/6-em)]](https://www.rsc.org/images/entities/char_2009.gif) 2
2![[thin space (1/6-em)]](https://www.rsc.org/images/entities/char_2009.gif) :
:![[thin space (1/6-em)]](https://www.rsc.org/images/entities/char_2009.gif) 1 and the ratio N+
1 and the ratio N+![[thin space (1/6-em)]](https://www.rsc.org/images/entities/char_2009.gif) :
:![[thin space (1/6-em)]](https://www.rsc.org/images/entities/char_2009.gif) N–Au of 2
N–Au of 2![[thin space (1/6-em)]](https://www.rsc.org/images/entities/char_2009.gif) :
:![[thin space (1/6-em)]](https://www.rsc.org/images/entities/char_2009.gif) 1 reflects the contribution of the AuNPs to the overall surface area. These data correlate well with the AFM and SEM results. The presence of the pyridyl moieties was also indicated by Raman spectroscopy. Two peaks were observed at 1605 cm−1 and 1637 cm−1 corresponding to the C
1 reflects the contribution of the AuNPs to the overall surface area. These data correlate well with the AFM and SEM results. The presence of the pyridyl moieties was also indicated by Raman spectroscopy. Two peaks were observed at 1605 cm−1 and 1637 cm−1 corresponding to the C![[double bond, length as m-dash]](https://www.rsc.org/images/entities/char_e001.gif) C and pyridine groups.
C and pyridine groups.
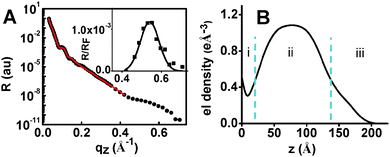
In order to obtain additional structural information, specular X-ray reflectivity (XRR) measurements were performed for AuNP-MON after 6 chromophore depositions. The experimental data were fitted by applying the recursive Parratt algorithm (Fig. 4A).20 The electron density profile obtained by this fit (Fig. 4B) indicates a 3-component system with a total thickness of 17 nm: (i) the pyridyl-terminated monolayer of ∼2 nm thickness, (ii) the AuNPs with a diameter of ∼12 nm, and (iii) the MON-shell with a thickness of ∼3 nm. The observed electron density for the AuNP platform is 1.08 e Å−3 (Fig. 4B), while the electron density for AuNPs is 4.66 e Å−3. Hence, the estimated electron density of the MON between the AuNPs is ∼0.30 e Å−3 (using the AuNPs coverage of 16%; see ESI†). This estimate is in agreement with the results shown in Fig. 4B (section i). A Bragg peak was indicated at qz ∼ 0.54 Å−1, with repeating distances of 1.2 nm and a correlation length of ∼5.5 nm. These observations may imply that the 1/PdCl2 layers of the MON are organized with a certain periodicity.21 We reported ordered molecular-based multilayers by combining coordination chemistry with π–π interactions.22 Tao showed that Au nano-islands coated with a monolayer induced the formation of organized films.4 Here the molecular order is induced by the AuNPs. Without AuNPs, no Bragg peak was indicated.9
The ellipsometry-derived AuNP-MON thickness increased linearly with the number of deposition steps of 1 (Fig. S6, ESI†).12,13 The final thickness (16 nm) is in agreement with the XRR data (Fig. S7, ESI†). SEM and AFM analyses indicated that the AuNPs are structurally not affected by the MON (Fig. 1, Fig. S8 and S9, ESI†).
To conclude, we have demonstrated the formation of a surface-confined core–shell nanostructure based on AuNPs and a MON. The AuNP cores have two major effects on the continuous shell: (i) the optical absorption intensity of the chromophores is positively affected by the larger surface area. The enhancement is higher than what one can expect based on only surface roughness considerations. Effects such as core–shell energy transfer18 might also play a role. The AuNP plasmon band is affected by the thickness of the MON since it is sensitive to changes in the surrounding media. (ii) The use of the AuNP platform results in an ordered MON. Our findings demonstrate the long-range structural effects induced by nanostructures.3,23 The large number of known coordination-based films24 and the availability of surface-confined nanoparticles may make our approach a new entry for developing a wide range of composite interfaces.
This research was supported by the Helen and Martin Kimmel Center for Molecular Design and Minerva. GE and PD were supported by a booster award from the Initiative for Sustainability and Energy at Northwestern and by the NSF (DMR-1309589). MB is the incumbent of the Bruce A. Pearlman Professorial Chair in Synthetic Organic Chemistry.
Notes and references
- B. Liu, O. Shekhah, H. K. Arslan, J. Liu, C. Wöll and R. A. Fischer, Angew. Chem., Int. Ed., 2012, 51, 807 CrossRef CAS PubMed.
- (a) Q. Gan, F. J. Bartoli and Z. H. Kafafi, Adv. Mater., 2013, 25, 2385 CrossRef CAS PubMed; (b) Y. Xiao, F. Patolsky, E. Katz, J. F. Hainfeld and I. Willner, Science, 2003, 299, 1877 CrossRef CAS PubMed.
- R. J. Macfarlane, B. Lee, M. R. Jones, N. Harris, G. C. Schatz and C. A. Mirkin, Science, 2011, 334, 204 CrossRef CAS PubMed.
- C. W. Tseng and Y. T. Tao, J. Am. Chem. Soc., 2009, 131, 12441 CrossRef CAS PubMed.
- K. Ariga, Q. Ji, J. P. Hill, Y. Bando and M. Aono, NPG Asia Mater., 2012, 4, e17 CrossRef CAS; O. Crespo-Biel, B. J. Ravoo, D. N. Reinhoudt and J. Huskens, J. Mater. Chem., 2006, 16, 3997 RSC.
- (a) Y. Jin and N. Friedman, J. Am. Chem. Soc., 2005, 127, 11902 CrossRef CAS PubMed; (b) J.-L. Wu, F.-C. Chen, Y.-S. Hsia, F.-C. Chien, P. Chen, C.-H. Kuo, M. H. Huang and C.-S. Hsu, ACS Nano, 2011, 5, 959 CrossRef CAS PubMed.
- M. R. Jones, K. D. Osberg, R. J. Macfarlane, M. R. Langille and C. A. Mirkin, Chem. Rev., 2011, 111, 3736 CrossRef CAS PubMed.
- I. Doron-Mor, H. Cohen, Z. Barkay, A. Shanzer, A. Vaskevich and I. Rubinstein, Chem.–Eur. J., 2005, 11, 5555 CrossRef CAS PubMed.
- R. Kaminker, L. Motiei, A. Gulino, I. Fragalà, L. J. W. Shimon, G. Evmenenko, P. Dutta, M. A. Iron and M. E. van der Boom, J. Am. Chem. Soc., 2010, 132, 14554 CrossRef CAS PubMed.
- Y. Wei, S. Han, D. A. Walker, P. E. Fuller and B. A. Grzybowski, Angew. Chem., Int. Ed., 2012, 51, 7435 CrossRef CAS PubMed.
- S. Link and M. A. El-Sayed, J. Phys. Chem. B, 1999, 103, 4212 CrossRef CAS.
- H. L. Zhang, S. D. Evans and J. R. Henderson, Adv. Mater., 2003, 15, 531 CrossRef CAS.
- S. Kubo, A. Diaz, Y. Tang, T. S. Mayer, I. C. Khoo and T. E. Mallouk, Nano Lett., 2007, 7, 3418 CrossRef CAS PubMed.
- D. A. Walker, B. Kowalczyk, M. O. de la Cruz and B. A. Grzybowski, Nanoscale, 2011, 3, 1316 RSC.
- A. J. Amoroso, A. M. W. C. Thompson, J. P. Maher, J. A. Mccleverty and M. D. Ward, Inorg. Chem., 1995, 34, 4828 CrossRef CAS.
- R. Kaminker, M. Lahav, L. Motiei, M. Vartanian, R. Popovitz-Biro, M. A. Iron and M. E. van der Boom, Angew. Chem., Int. Ed., 2010, 49, 1218 CrossRef CAS PubMed; L. Beverina, ChemPhysChem, 2010, 11, 2075 CrossRef PubMed.
- A. Doron, E. Joselevich, A. Schlittner and I. Willner, Thin Solid Films, 1999, 340, 183 CrossRef CAS.
- K. O. Aruda, M. Tagliazucchi, C. M. Sweeney, D. C. Hannah and E. A. Weiss, Phys. Chem. Chem. Phys., 2013, 15, 7441 RSC.
- (a) A. Gulino, Anal. Bioanal. Chem., 2013, 405, 1479 CrossRef CAS PubMed; (b) S. L. Tait, Y. Wang, G. Costantini, N. Lin, A. Baraldi, F. Esch, L. Petaccia, S. Lizzit and K. Kern, J. Am. Chem. Soc., 2008, 130, 2108 CrossRef CAS PubMed; (c) I. Doron-Mor, A. Hatzor, A. Vaskevich, T. van der Boom-Moav, A. Shanzer, I. Rubinstein and H. Cohen, Nature, 2000, 406, 382 CrossRef CAS PubMed; (d) M. P. Seah, L. S. Gilmore and G. Beamson, Surf. Interface Anal., 1998, 26, 642 CrossRef CAS; (e) N. H. Turner and A. M. Single, Surf. Interface Anal., 1990, 15, 215 CrossRef CAS.
- (a) C. Braun, Parratt32 Software for Reflectivity, HMI, Berlin, 1999 Search PubMed; (b) L. G. Parratt, Phys. Rev., 1954, 95, 359 CrossRef.
- B. Wedl, R. Resel, G. Leising, B. Kunert, I. Salzmann, M. Oehzelt, N. Koch, A. Vollmer, S. Duhm, O. Werzer, G. Gbabode, M. Sferrazza and Y. Geerts, RSC Adv., 2012, 2, 4404 RSC.
- M. Altman, O. Zenkina, G. Evmenenko, P. Dutta and M. E. van der Boom, J. Am. Chem. Soc., 2008, 130, 5040 CrossRef CAS PubMed.
- S. J. Tan, M. J. Campolongo, D. Luo and W. Cheng, Nat. Nanotechnol., 2011, 6, 268 CrossRef CAS PubMed.
- I. Rubinstein and A. Vaskevich, Isr. J. Chem., 2010, 50, 333 CrossRef CAS.
Footnote |
| † Electronic supplementary information (ESI) available: Experimental procedures and characterization data. See DOI: 10.1039/c3cc47865c |
| This journal is © The Royal Society of Chemistry 2014 |

