Stabilization of a hyaluronate-associated gene delivery system using calcium ions†
Min
Feng‡
a,
Basma M.
Ibrahim‡
b,
Erin M.
Wilson
b,
Kyung-Oh
Doh
bc,
Brandon K.
Bergman
b,
Christopher
Park
b and
Yoon
Yeo
*bde
aDepartment of Pharmacy, School of Pharmaceutical Sciences, Sun Yat-sen University, University Town, Guangzhou 510006, P. R. China
bDepartment of Industrial and Physical Pharmacy, Purdue University, 575 Stadium Mall Drive, West Lafayette, IN 47907, USA. E-mail: yyeo@purdue.edu
cDepartment of Physiology, College of Medicine, Yeungnam University, 317-1 Daemyung-dong, Daegu, Korea
dWeldon School of Biomedical Engineering, Purdue University, West Lafayette, IN 47907, USA
eBiomedical Research Institute, Korea Institute of Science and Technology, Hwarangno 14-gil 5, Seongbuk-gu, Seoul 136-791, Republic of Korea
First published on 19th February 2014
Abstract
A “DPH” ternary complex consisting of plasmid DNA (pDNA), intracellularly degradable polyethyleneimine, and hyaluronic acid (HA) is a promising non-viral gene carrier with low toxicity and good gene transfection efficiency. HA plays a key role in providing an optimal balance between DNA protection and release, but it causes aggregation due to the entanglement of HA chains of neighbouring DPH particles. Here we report that the addition of an optimal level of Ca2+ successfully prevents particle aggregation and maintains a relatively small size. The Ca-stabilized DPH is comparable to DPH in cytotoxicity and gene transfection efficiency. MW monitoring and conductometric titration suggest that such size stabilization effect is partly mediated by the complexation between HA and Ca2+, which enables intra- and intermolecular interactions of HAs.
Introduction
Non-viral gene vectors are promising alternatives to viral gene vectors with the potential to reduce the risks of pathogenic and immunological complications associated with the viral vectors. Cationic polymers such as polyethyleneimine (PEI) or polylysine and cationic lipids have been widely investigated as non-viral gene vectors.1 However, often the dilemma of non-viral gene delivery is the “malignant correlation” between transfection efficiency and cytotoxicity, where high transfection efficiency is associated with high cytotoxicity, or lack of toxicity means low transfection efficiency.2 One way to address this challenge is to use disulfide-crosslinked low molecular weight (MW) PEI (CLPEI), which behaves like a high MW PEI in the extracellular environment but readily degrades to low MW PEI inside the cells due to the relatively high intracellular reductive potential.2,3 CLPEI provides high transfection efficiency and low intracellular toxicity, advantages of both high MW PEI and low MW PEI, respectively. Additionally, reductive degradation of CLPEI enhances the decomplexation of nucleic acids in the cells, facilitating their intracellular functions.3In our previous study, we have further improved the gene transfection efficiency of the DNA-CLPEI complex (“DP”) using hyaluronic acid (HA) as an additional component.4 A ternary complex based on DP and HA (“DPH”) achieves a significantly higher transfection efficiency than other polymer systems including branched PEI.4 The high transfection efficiency is attributable to a unique interplay between CLPEI and HA, which enables the protection of DNA during the early stages of intracellular trafficking and a timely release of DNA from the complex.4 Similarly, HA has been used in other non-viral gene delivery systems for reducing cytotoxicity,5,6 enhancing cellular interactions via HA-specific CD44 receptors,6–8 or improving serum compatibility.9,10
On the other hand, the DPH ternary complex tends to aggregate, likely due to entanglement of HA layers among the complexes in proximity, often resulting in particles with a size greater than 1 μm in diameter. Since particles of this size are easily subject to clearance by the mononuclear phagocyte system, it is necessary to prevent particle size increase before testing the DPH complexes in vivo. Therefore, we aim in this study to prevent the aggregation of DPH complex while maintaining the benefits of HA. Since divalent cations bind to charged ligands (typically carboxyl-terminated molecules)11,12 and macromolecules with such ligands can interact via the divalent cations, we hypothesize that Ca2+ will stabilize the HA layer and prevent aggregation of DPH complexes. Here we report that complexation of DPH with Ca2+ (DPH-Ca) helps maintain relatively small particle size without compromising transfection efficiency of DPH. A potential mechanism of the Ca2+-induced stabilization of DPH complexes is also discussed.
Experimental
Materials
Linear PEIs (MW: 2.5 kDa) were purchased from Polysciences, Inc. (Warrington, PA). Branched PEI (MW: 25 kDa), dithiobis(succinimidyl propionate) (DSP), Sephadex G25, and calcium chloride were purchased from Sigma-Aldrich (St. Louis, MO, USA). Dulbecco's modified Eagle's medium (DMEM) and calf serum (CS) were purchased from Invitrogen (Carlsbad, CA, USA). Sodium hyaluronate was obtained from Lifecore Biomedical (Chaska, MN, USA).Synthesis of disulfide-crosslinked low MW linear polyethyleneimine (CLPEI)
CLPEI was synthesized by crosslinking low MW linear PEI (LPEI, 2.5 kDa) via DSP, as previously described.2,4 Four hundred milligrams of LPEI was dissolved in phosphate-buffered saline (PBS, pH 7.2) at 50 °C, to which 57.6 mg of DSP dissolved in 320 μL dimethyl sulfoxide was slowly added under stirring. The reaction mixture was kept at 50 °C for 24 h. CLPEI was purified using Sephadex G25 column, dialyzed against deionized water, and lyophilized. The resulting light yellow solid was dissolved in 1 N HCl, which was further purified by precipitation in acetone. The final product was lyophilized and stored at −20 °C.Preparation of pEGFP-C1 and pGL3 plasmids
pEGFP-C1 (4.7 kb) plasmid and pGL3 (5.1 kb) plasmid were replicated in a competent high-copy DH5-α Escherichia coli strain grown in Luria-Bertani medium containing kanamycin (50 μg mL−1) and ampicillin (100 μg mL−1), respectively. Plasmids were purified using the HiSpeed Plasmid maxi kit (Qiagen Inc., Valencia, CA) according to the manufacturer's protocol. Plasmid concentration was determined by measuring UV absorbance at 260 nm. pDNA aliquots were stored at −20 °C. The pEGFP-C1 plasmid was used for microscopic observation, and pGL3, encoding firefly luciferase, was used in all other experiments.Preparation of DPH and DPH-Ca complexes
The DPH ternary complex was prepared with pDNA, CLPEI, and HA (35 kDa) at the weight ratio of 1/9.8/1 (N/P ratio: 40), which was found to be the optimal ratio in the previous study.4 Briefly, DP binary complex was first prepared by mixing 8 μg of pDNA and 78.4 μg of CLPEI in HEPES buffer (HEPES 10 mM, pH 7.2) and incubating the mixture at room temperature for 30 min. Subsequently, the DP complex was added to an HA solution in HEPES buffer at the pDNA/HA weight ratio of 1/1 (i.e., HA 8 μg for pDNA 8 μg) and incubated at room temperature for 1 h to form a DPH complex.To prepare the Ca2+-stabilized DPH complex (DPH-Ca), the DPH complex was incubated with CaCl2 at room temperature for 10 min. The amount of CaCl2 added to a DPH complex equivalent to 1 μg pDNA (i.e., 1 μg HA) was varied from 9 μmol to 24 μmol. Specifically, CaCl2 was prepared as 1.5 M solution and added in varying volumes (6–16 μL) to 50 μL of DPH solution (equivalent to 1 μg of pDNA). The final volumes of all complexes were adjusted to the same level using saline or 10 mM HEPES buffer. The amount of added CaCl2 is indicated as a subscript following DPH-Ca. For example, DPH-Ca24 indicates a DPH-Ca formed by addition of 24 μmol of CaCl2 to a DPH complex equivalent to 1 μg pDNA.
Measurements of particle size and zeta potential
Particle sizes and surface charges of DP, DPH, and DPH-Ca complexes were measured by dynamic light scattering (DLS) using a Nano-ZS90 Zetasizer (Malvern Instruments Ltd, Worcestershire, UK), equipped with a 4 mW helium neon laser (633 nm). The complexes were dispersed in HEPES-buffered saline (pH 7.2, 10 mM), and their sizes were measured at 25 °C with a fixed scattering angle of 90° through a 400 μm pinhole. Surface charges of the complexes were determined using a Universal dip cell kit. The complexes were diluted to a final volume of 0.7 mL with HEPES buffer (pH 7.2) prior to the measurement. At least three independently prepared samples were analyzed, and the results were displayed as averages ± standard deviations of the measurements.Atomic force microscopy
pEGFP-C1 plasmid, DPH, and DPH-Ca24 complex were observed by atomic force microscopy (AFM). A drop of freshly prepared sample solutions in PBS was placed on a mica disc. The sample was allowed to dry at room temperature for 24 h. Subsequently, the mica disc was washed twice with deionized water and dried at room temperature for another 24 h. Images were obtained by scanning the prepared mica disc in a tapping mode at a scan speed of ∼3 Hz with 512 × 512 pixel resolution.Complex stability in presence of heparin and DNase
DP, DPH, DPH-Ca12, and DPH-Ca24 complexes were challenged by incubation with heparin and deoxyribonuclease (DNase) as previously reported.4 Briefly, each complex was incubated with 1 unit DNase per 0.5 μg pDNA at 37 °C for 30 min. The complexes were optionally incubated with 4 mg mL−1 heparin for additional 1 h. The treated sample, each equivalent to 0.5 μg pDNA was loaded to agarose gel (1% unless specified otherwise) for electrophoresis.Cytotoxicity assay
Cytotoxicity of the carrier portion of a complex, i.e., a mixture of CLPEI and HA (9.8 μg CLPEI and 1 μg HA) and a mixture of CLPEI, HA and CaCl2 (9.8 μg CLPEI, 1 μg HA, and 24 μmol CaCl2), was evaluated with the MTT assay. NIH/3T3 fibroblasts were seeded in a 96-well plate at an initial density of 8000 cells per well in 200 μL of DMEM medium containing 10% calf serum. After overnight incubation, the medium was replaced with 200 μL of the fresh complete medium, and samples were added in varying amounts to make the final concentration in medium from 1 to 50 μg mL−1 CLPEI equivalent. After overnight incubation with the polymers with or without CaCl2, 3-(4,5-dimethylthiazol-2-yl)-2,5-diphenyl-tetrazolium bromide (MTT) reagent and the stop solution were sequentially added with a 4 h interval. The cell viability was quantified by measuring UV absorbance of the solubilized formazan at 560 nm with a Tecan Spectrafluor Plus microplate reader (Research Triangle Park, NC). The measured absorbance was normalized to that of non-treated control cells.In vitro transfection study
DP, DPH, and DPH-Ca complexes were prepared using pGL3 as a reporter gene. DPH complex was prepared as described in the previous section. For DPH-Ca complex, 6–21 μmol of CaCl2 was added per 1 μg pDNA. NIH/3T3 fibroblasts were seeded at a density of 20![[thin space (1/6-em)]](https://www.rsc.org/images/entities/char_2009.gif) 000 cells per well in 24-well plates and grown to 70% confluence. The culture medium in each well was replaced with 300 μL serum-free DMEM containing DP, DPH, or DPH-Ca complexes equivalent to 0.2 μg pDNA. After 7 h incubation at 37 °C with the complexes, the medium was replaced with fresh complete medium, and the cells were allowed to grow for additional 41 h. Finally, cells in each well were washed with 1 mL PBS twice and lysed with one cycle of freezing and thawing. Luciferase activity was measured using the Promega luciferase assay kit according to the manufacturer's protocol. The gene transfection efficiency was expressed as relative luminescence unit (RLU). Each signal was normalized to the total protein concentration of the cell lysate, which was measured with the BCA protein assay (Thermo Scientific, Rockford, IL).
000 cells per well in 24-well plates and grown to 70% confluence. The culture medium in each well was replaced with 300 μL serum-free DMEM containing DP, DPH, or DPH-Ca complexes equivalent to 0.2 μg pDNA. After 7 h incubation at 37 °C with the complexes, the medium was replaced with fresh complete medium, and the cells were allowed to grow for additional 41 h. Finally, cells in each well were washed with 1 mL PBS twice and lysed with one cycle of freezing and thawing. Luciferase activity was measured using the Promega luciferase assay kit according to the manufacturer's protocol. The gene transfection efficiency was expressed as relative luminescence unit (RLU). Each signal was normalized to the total protein concentration of the cell lysate, which was measured with the BCA protein assay (Thermo Scientific, Rockford, IL).
MW measurements
MWs of HA–calcium (HA–Ca) and alginate–calcium (alginate–Ca) complexes were measured using a Zetasizer NS90 by static light scattering and the classical Debye plot. First, CaCl2 was added in varying amounts to 1 mg mL−1 HA or alginate solution in HEPES buffer. The HA–Ca or alginate–Ca solutions were diluted 2, 4, and 10 times with deionized water. Each diluted sample was analyzed at 25 °C in the automatic duration mode, with helium neon laser (633 nm) detected at an angle of 90°, according to the Malvern-supplied ‘Molecular Weight’ operating procedure. Data collection and calculation were performed using the Molecular Weight function in the DTS software for the Zetasizer Nano system. This software compiles the static intensity measurements, generates a standard Debye plot from the average intensity and concentration of the solution, and calculates the MW from the y-intercept. The measured MWs of HA–Ca and alginate–Ca were normalized to those of HA and alginate, respectively, and plotted with respect to the molar ratio of Ca2+ to disaccharide repeating unit of each polysaccharide. MWs of disaccharide repeating units of HA and alginate are 379 Da (C14H21NO11) and 354 Da (C12H18O12), respectively.Conductometric titration
Electric conductivity of the HA solution was measured increasing the amount of Ca2+ added to the solution using a conductivity meter (Mettler Toledo, Columbus, OH). Briefly, 50 mL of HA (0.5 mg mL−1) was added to a temperature-controlled beaker and titrated with a 50 mM of CaCl2 in steps of 25 μL under constant stirring. Following each step, the electric conductivity was determined at equilibrium. The time needed to reach the equilibrium varied from several seconds to 5 min. As a reference, deionized water was also tested in the same manner.Statistical analysis
All data were expressed as averages with standard deviations. One-way ANOVA test was used to determine statistical difference among the groups, and multiple contrasts were performed with the Tukey test. A p-value of <0.05 was considered statistically significant.Results
Characterization of DPH complexes
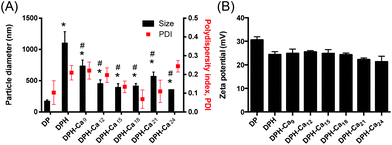
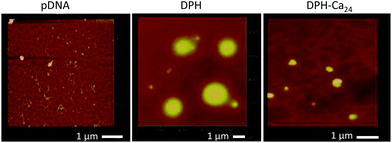
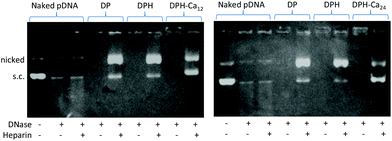
The particle sizes of DP and DPH were 167.6 ± 25.1 nm and 1096.3 ± 188.2 nm, respectively (Fig. 1A). The DPH particle size became as small as ∼400 nm with the addition of CaCl2 to 12 μmol or higher per DPH equivalent to 1 μg pDNA. Polydispersity index (PDI) of particles ranged from 0.1 to 0.25, indicating mid-range polydispersity. The cationic charge of DP (+30.6 ± 1.3 mV) was slightly reduced to +24.4 ± 1.3 mV when HA was added (DPH) but did not further change with the addition of CaCl2 (p > 0.05 among DPH vs. DPH-Ca's by one-way ANOVA) (Fig. 1B). pDNA, DPH, and DPH-Ca24 particles were visualized by AFM (Fig. 2). pDNA showed a typical uncondensed fiber shape. DPH complex were spherical particles with various sizes, measuring <1 to 2 μm in diameter. On the other hand, most DPH-Ca24 complex particles were 200–500 nm in agreement with the DLS measurement.pDNA, DP, DPH, and DPH-Ca were challenged with DNase and heparin to evaluate the stability. pDNA showed two typical bands corresponding to supercoiled (s.c.) and nicked plasmids, whereas those treated with DNase had weak bands and smears, which indicated digestion of pDNA (Fig. 3). All complexes (DP, DPH, and DPH-Ca) were resistant to DNase treatment and mostly remained in wells. When the complexes were additionally treated with heparin, which promoted pDNA release by interfering with pDNA–polycation interactions, DP and DPH showed a relatively thick band of nicked plasmid, indicating partial sensitivity to DNase. Compared to DP or DPH complexes, DPH-Ca showed relatively less intense bands, a sign of resistance to the heparin treatment, and a stronger signal for supercoiled pDNA which indicated resistance to the DNase treatment. This trend was more evident with the higher Ca level (ESI Fig. 1†). These results suggest that the stability of pDNA increased in the presence of Ca2+ ions in DPH-Ca.
Cytotoxicity
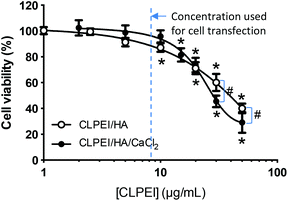
The effect of additional CaCl2 on cell viability was investigated using the MTT assay with NIH/3T3 fibroblasts. The carrier part of DPH complex (CLPEI–HA: a mixture of CLPEI 9.8 μg and HA 1 μg) showed some toxicity at a concentration corresponding to >10 μg mL−1 CLPEI. Similarly, the carrier part of DPH-Ca24 (CLPEI–HA–CaCl2: a mixture of CLPEI 9.8 μg, HA 1 μg, and CaCl2 24 μmol) was non-toxic up to a concentration corresponding to 10 μg mL−1 CLPEI and 24.5 mM CaCl2 (Fig. 4). This result is consistent with the fact that CaCl2 alone had no cytotoxicity up to 20 mM (data not shown). On the other hand, relatively high toxicity of CLPEI–HA–CaCl2 was observed at higher concentrations (equivalent to 30 μg mL−1 CLPEI and 73.5 mM CaCl2 or higher), attributable to toxicity of CaCl2. However, neither CLPEI–HA nor CLPEI–HA–CaCl2 was toxic at the concentration typically used for cell transfection (equivalent to 8.2 μg mL−1 CLPEI).Transfection efficiency
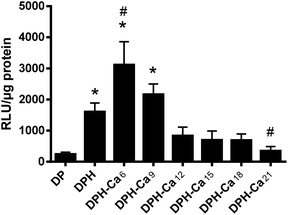
DPH was superior to DP in transfection efficiency (Fig. 5), consistent with our previous report.4 DPH-Ca was comparable to DPH, with an exception of DPH-Ca6 and DPH-Ca21, which were significantly higher and lower, respectively, than DPH.Interaction between HA and calcium
We hypothesized that CaCl2 helped maintain relatively small particle size of DPH by forming an ionic complex with HA in DPH. To confirm this hypothesis, we evaluated the MW of HA in the presence of CaCl2 using static light scattering. Two different MW HAs (35 kDa and 350 kDa) were incubated with varying amounts of CaCl2 in HEPES buffer. In parallel, alginate (128 kDa) an anionic polysaccharide with the well-known ability to crosslink via Ca2+![[thin space (1/6-em)]](https://www.rsc.org/images/entities/char_2009.gif) 13,14 was incubated with CaCl2 in the same manner. Maximum MWs of HA35 kDa–Ca and HA350 kDa–Ca were 2 and 4 times higher than those of HA35 kDa and HA350 kDa, respectively (Fig. 6). These results suggest that two or more HAs were bound via Ca2+. The MW of HA–Ca first increased and then slightly decreased to reach a plateau as the amount of added CaCl2 further increased. In contrast, alginate showed steep increase in MW with increasing CaCl2.
13,14 was incubated with CaCl2 in the same manner. Maximum MWs of HA35 kDa–Ca and HA350 kDa–Ca were 2 and 4 times higher than those of HA35 kDa and HA350 kDa, respectively (Fig. 6). These results suggest that two or more HAs were bound via Ca2+. The MW of HA–Ca first increased and then slightly decreased to reach a plateau as the amount of added CaCl2 further increased. In contrast, alginate showed steep increase in MW with increasing CaCl2.
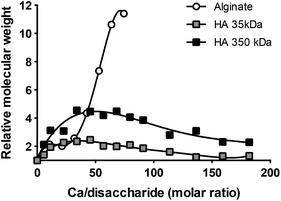 | ||
| Fig. 6 Molecular weight increase of HA and alginate in the presence of Ca2+, measured by static light scattering. | ||
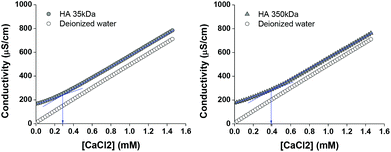
To determine the amount of CaCl2 forming a complex with HA, conductometric titration was performed. Fig. 7 shows typical results of HA (35 kDa and 350 kDa) and deionized water titrated with CaCl2. HA solution showed higher conductivity than deionized water due to the presence of additional ions (hyaluronates and sodium counter ions). With the addition of CaCl2, conductivity of water increased linearly in proportion to the amount of CaCl2. On the other hand, HA35 kDa and HA350 kDa solutions titrated with CaCl2 showed inflection points at the CaCl2 concentration of 0.29 mM and 0.39 mM, respectively. Until these points, the conductivity of HA solutions increased more gently than that of water, indicating that Ca2+ was consumed by HA forming HA–Ca complexes. The inflection points corresponded to the Ca/disaccharide molar ratio of 0.22 (HA35 kDa) and 0.30 (HA350 kDa), which suggests that one Ca2+ was shared by 3–5 disaccharide units.
Discussion
Ca2+ has been widely used in non-viral gene delivery as a gene vector15–18 or a stabilizer of DNA-carrier complexes.19,20 When used as a standalone gene vector, DNA is co-precipitated with calcium phosphate to form condensed particles amenable to cellular uptake.15,21 Alternatively, Ca2+ improves transfection efficiency of other vectors by mediating the interactions between DNA and vectors.18,22 Ca2+ is also used to form complexes of polysaccharides. Polysaccharides such as alginate, pectin, or carrageenans, which have anionic functional groups, can be bound together via Ca2+, often producing hydrogels useful for entrapment of cells or macromolecules. X-ray fiber diffraction finds that Ca2+ interacts with carboxyl groups of HA and ties adjacent antiparallel chains together with the help of water molecules.23,24We intended to take advantage of this ability of Ca2+ to mediate intermolecular interactions of HA in stabilizing the HA surface of a DPH complex and preventing aggregation of the complexes. We found that DPH-Ca complexes were smaller than DPH with an average diameter less than 500 nm (Fig. 1A). The relatively small size of DPH-Ca24 was also confirmed by AFM (Fig. 2). The surface stabilization effect was consistent with the relatively high resistance of DPH-Ca complex to the treatment with DNase and heparin (Fig. 3).
Interestingly, this effect was not evident when CaCl2 was added prior to HA. When CaCl2 was directly added to DP complexes, the particles underwent significant aggregation at all levels of CaCl2 (ESI Fig. 2A†). The DP-Ca aggregation may be attributable to the interference of Ca2+ with the pDNA-CLPEI (DP) complexation. Electrophoresis of DP complexes incubated with CaCl2 shows that the complex became increasingly loose with the increase of CaCl2 (ESI Fig. 3†). Baoum et al. also reported that Ca2+ interacted with both DNA and PEI and that the DNA-PEI incubated with CaCl2 were similarly aggregated.20 The CaCl2-induced DP aggregation was not reversed by the subsequent addition of HA (ESI Fig. 2B†), which suggests that the reduced size of DPH-Ca was due to the interaction with HA part of DPH rather than DP complexes. Moreover, that the DPH-Ca complexes did not undergo further aggregation with increasing Ca2+ indicates that DP was sequestered in HA and protected from the CaCl2-induced aggregation.
MW measurement and conductometric titration of HA solution were performed to understand the nature of Ca2+ to HA interactions. The “MW” of HA–Ca initially increased, indicating that 2–4 HA molecules interacted via Ca2+. HAs did not show steep increase in MW with the increase of Ca2+ unlike alginate. This difference may be explained by the way Ca2+ interacts with each polysaccharide. Intermolecular interaction of alginate is known to be facilitated by the cooperative coordination of Ca2+ in continuous glucuronate residues.13,25,26 On the other hand, HA interactions via Ca2+ are intramolecular and involve carboxyl and N-acetyl groups of two disaccharide units in a single, folded HA chain.27 Given the initial MW increase, we consider the HA–Ca interaction to be both intra- and intermolecular (involving 2–4 HA molecules) rather than strictly intramolecular. Further increase of Ca2+ resulted in “MW” decrease of HA–Ca, which suggested increasing intramolecular interactions of HA (Fig. 6). Similar to this result, a previous study found that increasing Ca2+ concentration decreased the viscosity of HA solution.27 The inflection points of conductometric titration curves (Fig. 7) are interpreted as 3–5 disaccharide repeating units of HA sharing one Ca2+ (Ca/disaccharide molar ratio: 0.22 for HA35 kDa and 0.30 for HA350 kDa), consistent with the previous report.27 On the other hand, the fact that HA continued to undergo intramolecular interactions at Ca/disaccharide ratios significantly greater than 100 (Fig. 6) suggests that more Ca2+ might be involved in stabilizing the HA layer. Moreover, given that the stabilization of DPH-Ca size (Fig. 1A) was achieved at even higher Ca/disaccharide ratios (4775–9096), Ca2+ appears to play additional roles than the HA layer stabilization.
Surface charges of the DPH-Ca complexes were consistently positive but did not correlate with the amount of Ca2+ added (Fig. 1C). Therefore, we speculated that only a small part of Ca2+ remained on the surface, and the remainder might have diffused into and complexed with the DP core. A piece of supporting evidence is that the gene transfection reached the highest value at a certain level of Ca2+ (6 μmol μg−1 pDNA) and subsided with further increase of Ca2+, a trend shown in other gene complexes associated with Ca2+.20,28,29 The high transfection efficiency of DPH-Ca6 may be attributable to the ability of Ca2+ to destabilize the endosomal membrane and promote escape of the complexes from the endosomes.28,29 On the other hand, higher levels of Ca2+ (DPH-Ca12 or higher) did not enhance gene transfection of DPH, probably due to the excessive destabilization of DP core by extra Ca2+.
These results establish that Ca2+ could stabilize HA layer on the DPH ternary complex preventing their aggregation. It remains to be seen whether the observed size stability translates to the stability in blood, which presents more complex challenges including competing ions and serum proteins. We note that the DPH-Ca complex for AFM was prepared in PBS, which contained 138 mM NaCl and 2.7 mM KCl, yet showed substantial difference in morphology from the non-stabilized DPH (Fig. 2). This observation suggests that the DPH-Ca complex remains stable in the presence of competing ions, most likely due to the synergism between HA–Ca complexation and condensation of HA layers via the electrostatic interactions with the DP core. The relative resistance of DPH-Ca to DNase/heparin treatment also suggests the stabilized HA layer can protect DP from direct interactions with serum proteins. Nevertheless, systematic studies need to be performed with respect to protein binding and the stability of DPH-Ca complexes in blood.
The intracellular fate of DPH-Ca complexes were not investigated in this study. However, we speculate that they will face a similar intracellular fate as other nanocarriers involving Ca2+, which are dissociated in the cells due to the difference in intra- (∼100 nM) and extracellular (2 mM) Ca2+ concentrations.30,31 The dissociated complexes will increase the intracellular Ca2+ level. Given various roles of Ca2+ in intracellular signal transduction,32 there is a valid concern regarding the potential toxicities due to the increased intracellular Ca2+. With the same concern, a recent study investigated the effect of cytosolic Ca2+ elevated by the introduction of nanocarriers.33 This study reported that Ca2+ pumps on the plasma membrane and the mitochondrial membrane rapidly responded to the elevated cytosolic Ca2+ concentration and prevented the Ca-induced apoptosis or necrosis.33 From this observation, we expect that Ca2+ introduced by DPH-Ca will not be toxic to cells as long as their Ca2+-pumps are functional and find that it is the case at least at the level used in this study (Fig. 4).
Conclusions
We report that Ca2+ is useful for reducing the particle size of DPH non-viral gene delivery system, a ternary complex of pDNA, intracellularly degradable PEI, and HA. DPH was previously found to be a promising gene carrier for its low toxicity and gene transfection efficiency, but its systemic application is limited due to particle aggregation. The addition of Ca2+ successfully prevented the aggregation of DPH, resulting in complexes that were well tolerated by fibroblasts and able to effectively deliver pDNA to the cells. MW monitoring and conductometric titration suggest that such stabilization effect is partly mediated by complexation between HA and Ca2+, which enables intra- and intermolecular interactions of HAs.Acknowledgements
The authors thank Dr Albena Ivanisevic and Hamsa Jaganathan for the help with AFM. This research was supported by the NSF CAREER Award DMR-1056997 and Intramural Research Program (Global RNAi Carrier Initiative) of Korea Institute of Science and Technology. This work was also partially supported by a grant from the Lilly Endowment, Inc., to the College of Pharmacy, Purdue University, NIH/NCRR-Indiana Clinical and Translational Sciences Institute pre-doctoral fellowship (TL1 RR025759, PI: A. Shekhar) to BI, and the China Scholarship Council (MF).Notes and references
- M. E. Davis, Curr. Opin. Biotechnol., 2002, 13, 128–131 CrossRef CAS.
- M. Breunig, U. Lungwitz, R. Liebl and A. Goepferich, Proc. Natl. Acad. Sci. U. S. A., 2007, 14454–14459 CrossRef CAS PubMed.
- M. Breunig, C. Hozsa, U. Lungwitz, K. Watanabe, I. Umeda, H. Kato and A. Goepferich, J. Controlled Release, 2008, 130, 57–63 CrossRef CAS PubMed.
- P. Xu, G. Quick and Y. Yeo, Biomaterials, 2009, 30, 5834–5843 CrossRef CAS PubMed.
- Y. Wang, Z. Xu, R. Zhang, W. Li, L. Yang and Q. Hu, Colloids Surf., B: Biointerfaces, 2011, 84, 259–266 CrossRef CAS PubMed.
- Y. Fan, J. Yao, R. Du, L. Hou, J. Zhou, Y. Lu, Q. Meng and Q. Zhang, Pharm. Res., 2013, 30, 1215–1227 CrossRef CAS PubMed.
- X. Sun, P. Ma, X. Cao, L. Ning, Y. Tian and C. Ren, Drug Delivery, 2009, 16, 357–362 CrossRef CAS PubMed.
- Y. He, G. Cheng, L. Xie, Y. Nie, B. He and Z. Gu, Biomaterials, 2013, 34, 1235–1245 CrossRef CAS PubMed.
- K. C. R. Bahadur, B. Thapa and P. Xu, Macromol. Biosci., 2012, 12, 637–646 CrossRef PubMed.
- C. J. Chen, Z. X. Zhao, J. C. Wang, E. Y. Zhao, L. Y. Gao, S. F. Zhou, X. Y. Liu, W. L. Lu and Q. Zhang, Int. J. Nanomedicine, 2012, 7, 3837–3849 CAS.
- F. P. Zamborini, J. F. Hicks and R. W. Murray, J. Am. Chem. Soc., 2000, 122, 4514–4515 CrossRef CAS.
- R. S. Crowther and C. Marriott, J. Pharm. Pharmacol., 1984, 36, 21–26 CrossRef CAS.
- E. R. Morris, D. A. Rees, D. Thom and J. Boyd, Carbohydr. Res., 1978, 66, 145–154 CrossRef CAS.
- G. T. Grant, E. R. Morris, D. A. Rees, P. J. C. Smith and D. Thom, FEBS Lett., 1973, 32, 195–198 CrossRef CAS.
- P. Batard, M. Jordan and F. Wurm, Gene, 2001, 270, 61–68 CrossRef CAS.
- H. Shen, J. Tan and W. M. Saltzman, Nat. Mater., 2004, 3, 569–574 CrossRef CAS PubMed.
- J. Li, Y.-C. Chen, Y.-C. Tseng, S. Mozumdar and L. Huang, J. Controlled Release, 2010, 142, 416–421 CrossRef CAS PubMed.
- V. I. Kulkarni, V. S. Shenoy, S. S. Dodiya, T. H. Rajyaguru and R. R. Murthy, Expert Opin. Drug Deliv., 2006, 3, 235–245 CrossRef CAS PubMed.
- A. A. Baoum and C. Berkland, J. Pharm. Sci., 2011, 100, 1637–1642 CrossRef CAS PubMed.
- A. Baoum, S.-X. Xie, A. Fakhari and C. Berkland, Pharm. Res., 2009, 26, 2619–2629 CrossRef CAS PubMed.
- C. Chen and H. Okayama, Mol. Cell. Biol., 1987, 7, 2745–2752 CAS.
- M. R. Mozafari and A. Omri, J. Pharm. Sci., 2007, 96, 1955–1966 CrossRef CAS PubMed.
- W. T. Winter and S. Arnott, J. Mol. Biol., 1977, 117, 761–784 CrossRef CAS.
- J. K. Sheehan and E. D. T. Atkins, Int. J. Biol. Macromol., 1983, 5, 215–221 CrossRef CAS.
- W. Mackie, S. Perez, R. Rizzo, F. Taravel and M. Vignon, Int. J. Biol. Macromol., 1983, 5, 329–341 CrossRef CAS.
- I. Braccini and S. Perez, Biomacromolecules, 2001, 2, 1089–1096 CrossRef CAS PubMed.
- G. Furth, R. Knierim, V. Buss and C. Mayer, Int. J. Biol. Macromol., 2008, 42, 33–40 CrossRef CAS PubMed.
- L. R. Palmer, T. Chen, A. M. I. Lam, D. B. Fenske, K. F. Wong, I. MacLachlan and P. R. Cullis, Biochim. Biophys. Acta, 2003, 1611, 204–216 CrossRef CAS.
- A. P. Sandhu, A. M. I. Lam, D. B. Fenske, L. R. Palmer, M. Johnston and P. R. Cullis, Anal. Biochem., 2005, 341, 156–164 CrossRef CAS PubMed.
- H. J. Lee, S. E. Kim, I. K. Kwon, C. Park, C. Kim, J. Yang and S. C. Lee, Chem. Commun., 2010, 46, 377–379 RSC.
- Y. Kakizawa, S. Furukawa and K. Kataoka, J. Controlled Release, 2004, 97, 345–356 CrossRef CAS PubMed.
- D. E. Clapham, Cell, 1995, 80, 259–268 CrossRef CAS.
- Y. C. Tseng, A. Yang and L. Huang, Mol. Pharm., 2013, 10, 4391–4395 CrossRef CAS PubMed.
Footnotes |
| † Electronic supplementary information (ESI) available. See DOI: 10.1039/c4bm00012a |
| ‡ Authors contributed equally. |
| This journal is © The Royal Society of Chemistry 2014 |

