Mesoporous nanogold–MnO2–poly(o-phenylenediamine) hollow microspheres as nanotags and peroxidase mimics for sensing biomolecules
Wenqiang
Lai
,
Junyang
Zhuang
,
Xiaohua
Que
,
Libing
Fu
and
Dianping
Tang
*
Ministry of Education Key Laboratory of Analysis and Detection for Food Safety, Fujian Provincial Key Laboratory of Analysis and Detection for Food Safety, Department of Chemistry, Fuzhou University, Fuzhou 350108, P.R. China. E-mail: dianping.tang@fzu.edu.cn; Fax: +86 591 2286 6135; Tel: +86 591 2286 6125
First published on 10th March 2014
Abstract
A new electrochemical immunosensor was designed for the determination of carcinoembryonic antigen (CEA) with sensitivity enhanced by using nanogold–poly(o-phenylenediamine)–manganese dioxide organic–inorganic hybrid nanostructures (GNPM) as nanotags and peroxidase mimics. Initially, mesoporous poly(o-phenylenediamine)–manganese dioxide (PPD–MnO2) hollow microspheres were synthesized by an inorganic/organic interfacial polymerization technique. Then gold nanoparticles were assembled onto the surface of PPD–MnO2, which were used for the labelling of the anti-CEA detection antibody (pAb2). The prepared GNPM nanotags were characterized using transmission electron microscopy (TEM), field emission scanning electron microscopy (FESEM), UV-vis absorption spectroscopy, N2 adsorption–desorption isotherm measurements and Fourier transform infrared spectroscopy (FTIR). The assay was carried out with a sandwich-type immunoassay format in pH 5.5 acetic acid-buffered saline solution containing 2.5 mmol L−1 H2O2. Experimental results indicated that the electrochemical immunosensor exhibited a wide dynamic range from 0.01 to 80 ng mL−1 towards the target CEA with a detection limit (LOD) of 6.0 pg mL−1. The immunosensor also displayed a good stability and acceptable reproducibility and selectivity. In addition, the methodology was evaluated by assaying 10 clinical serum samples, providing a good relationship between the electrochemical immunosensor and the commercialized electrochemiluminescent (ECL) method for determination of CEA.
Introduction
Immunoassays, based on the specific antigen–antibody reaction, are widely used to detect or quantify various biomolecules in clinical diagnostics, environmental evaluation and food analysis.1 Recently, various immunoassay protocols and strategies based on different signal transducer principles, e.g. radioimmunoassay,2 quartz crystal microbalance immunoassay (QCM),3 surface plasmon resonance (SPR) immunoassay,4 enzyme-linked immunosorbent immunoassay (ELISA),5 chemiluminescence immunoassay,6 fluorescence immunoassay,7 and mass spectrometric (MS) immunoassay,8 have been reported for the determination of biomolecules. Among these methods, electrochemical immunoassay has attracted great attention under the spotlight owing to its intrinsic advantages, such as simplification, rapidity, sensitivity and low cost.9–11 However, one important concern for the successful development of a good electrochemical immunoassay is to lower the detection limit and increase the detection sensitivity.12 Thus, one increasing interest has been focusing on the amplification of detectable signal by coupling molecular biological methods with nano amplification technologies.Typically, signal amplification can usually be achieved by improving the transducer sensitivity (i.e. physical amplification) or by using labelling-wise strategies (i.e. chemical amplification).13,14 Molecular biological amplification and nano amplification are commonly utilized worldwide in this field.15–17 Undoubtedly, native enzyme labels are used more widely than any other types of labels, because a single molecular enzyme, e.g. horseradish peroxidase, may cause the conversion of 107 molecules of substrate per minute. However, a basic limitation of using native enzymes is susceptibility to interference and changes in assay conditions during the signal generation stage, e.g. pH and temperature.18,19 In contrast, the emergence of nanocatalysts or enzymatic mimics opens up a new horizon for the use of nanomaterial labels for signal amplification, especially for redox-active enzymatic mimics.20 The power and scope of such nanomaterials can be greatly enhanced by coupling them with immunoreactions and electrical processes (i.e., nanobioelectronics).
Manganese oxides, one of the largest families of porous materials with various structures as found in manganese oxide minerals, exhibit high activity in some catalytic reactions.21 Xiao and co-workers found that manganese dioxide (MnO2) nanoparticles displayed a strong catalytic oxidation ability toward hydrogen peroxide (H2O2).22 Russo et al. studied the decomposition of H2O2 promoted by MnO2 catalyst support on γ-alumina.23 Hence, MnO2 nanoparticles could be used as both peroxidase and oxidase mimics toward the reduction of H2O2.8,24 Investigation has also proven that manganese oxide can be used as a substitute for noble metal catalysis, however, because of the lower surface area, the catalytic activity was often disturbed.25 Hence, tremendous research interest was focused on the laboratory synthesis of MnO2 nanostructures with various structures to improve the catalytic ability.26,27 Poly(o-phenylenediamine) (PPD), a highly aromatic polymer containing a 1,4-diaminophenazine or quinoraline repeating unit,28 has received significant attention for the synthesis of specifically shaped MnO2 nanomaterials. The formed organic conducting PPD polymers naturally have both a pore size and a charged group that prevent interfering compounds from permeating them, so they have drawn wide interest in biosensor fabrication.
Carcinoembryonic antigen (CEA), a glycoprotein most often associated with colorectal cancer, is utilized to monitor patients with this type of cancer.29 The most popular use is in the early detection of relapse in individuals already treated for colorectal cancer.30 The value of CEA in human serum is helpful for curative determination, monitoring and prognosis of cancerous tumors. Herein, we report the proof-of-concept of a new enzyme-free electrochemical immunosensor for the sensitive detection of CEA by using mesoporous MnO2–PPD hybrid nanostructures as nanotags and peroxidase mimics. Then the synthesized MnO2–PPD nanomaterials are used for the assembly and labelling of nanogold and the detection antibody, respectively, in turn. Upon introduction of target CEA, the sandwiched immunocomplex is formed between the nanotag and the immobilized capture antibody on the sensor. The conjugated nanotags can catalyze the reduction of H2O2 in the detection solution. By monitoring the change in the cathodic current, we may quantitatively determine the concentration of target CEA in the sample. The aim of this work is to explore a new enzyme-free electrochemical immunoassay with sensitivity enhancement for the detection of low-abundance proteins.
Experimental
Reagents and chemicals
Carcinoembryonic antigen (CEA) was purchased from Biocell Biotechnol. Co., Ltd (Zhengzhou, China). Monoclonal mouse anti-human CEA antibody (clone II-7; designated as mAb1, dilution: 1![[thin space (1/6-em)]](https://www.rsc.org/images/entities/char_2009.gif) :25–1:50) and polyclonal rabbit anti-human CEA antibody (designated as pAb2) were purchased from Dako Diagnostics Co., Ltd (Shanghai, China). o-Phenylenediamine (OPD) (98 wt%) and HAuCl4·4H2O were provided from Sinopharm Group Co., Ltd (Shanghai, China). Potassium permanganate was provided from Chem. Re. Factory (Shanghai, China). 16 nm gold colloids were prepared and characterized as described.30 All other reagents were of analytical grade and were used without further purification. Ultrapure water obtained from a Millipore water purification system (≥18 MΩ, Milli-Q, Millipore) was used in all runs. Acetic acid-buffered saline (ABS) solutions with various pH values were prepared by mixing definite volumes of 0.1 mol L−1 HAc and 0.1 mol L−1 NaAc, and 0.1 mol L−1 KCl was used as the supporting electrolyte.
:25–1:50) and polyclonal rabbit anti-human CEA antibody (designated as pAb2) were purchased from Dako Diagnostics Co., Ltd (Shanghai, China). o-Phenylenediamine (OPD) (98 wt%) and HAuCl4·4H2O were provided from Sinopharm Group Co., Ltd (Shanghai, China). Potassium permanganate was provided from Chem. Re. Factory (Shanghai, China). 16 nm gold colloids were prepared and characterized as described.30 All other reagents were of analytical grade and were used without further purification. Ultrapure water obtained from a Millipore water purification system (≥18 MΩ, Milli-Q, Millipore) was used in all runs. Acetic acid-buffered saline (ABS) solutions with various pH values were prepared by mixing definite volumes of 0.1 mol L−1 HAc and 0.1 mol L−1 NaAc, and 0.1 mol L−1 KCl was used as the supporting electrolyte.
Synthesis and labeling of nanogold–poly(o-phenylenediamine)–MnO2 (GNPM)
Mesoporous MnO2–poly(o-phenylenediamine) hybrid nanostructures (designated as PPD–MnO2) were synthesized according to the literature with some modification.31 Prior to synthesis, two solutions were prepared as follows. Solution (A) was initially prepared by addition of 5 mmol o-phenylenediamine into 50 mL CHCl3; while solution (B) consisted of 5 mmol KMnO4 and 50 mL deionized water (which was adjusted to pH 1 by using hydrochloric acid). Following that, the ice-cold solution (B) was dropped slowly into the ice-cold solution (A). Meanwhile, an obvious interface was formed immediately between the organic phase and aqueous phase. Next, the mixture was maintained at 4 °C for 6 h. During this process, the chemical oxidative polymerization of o-phenylenediamine and the reduction of MnO4− to manganese oxides occurred at the interface. Finally, the formed precipitates in the aqueous solution (i.e. PPD–MnO2) were filtered and washed with ethanol and distilled water, and stored at 4 °C for further use.Next, the as-prepared PPD–MnO2 was used for the labelling of pAb2. Initially, 2 mg PPD–MnO2 was dissolved thoroughly in 1 mL H2O, and then the resulting solution was added into 20 mL of 16 nm gold colloids (C[Au] ≈ 10 mmol L−1). Afterward, the mixture was gently shaken overnight at room temperature (RT, 25 ± 1.0 °C). During this process, gold nanoparticles were assembled onto the PPD–MnO2via the free amino groups of PPD.32 The nanogold-supporting PPD–MnO2 nanoparticles (designated as GNPM) were centrifuged, dried and dispersed into pH 7.4 PBS solution (C[GNPM] ≈ 1.0 mg mL−1). Following that, 300 μL of 1.0 mg mL−1 pAb2, dissolved in 50 mmol L−1 pH 7.3 N-2-hydroxyethylpiperazine-N′-(2-ethanesulfonic acid) buffer, was added drop by drop to the GNPM colloids, and stirred slightly overnight at 4 °C. Meanwhile, the pAb2 antibody was attached onto the GNPM. The association of the pAb2 antibody with the surface of GNPM was possibly due to the interaction between cysteine or NH3+-lysine residues of the antibody and the gold nanoparticles.29 The resultant mixture was washed with pH 7.4 PBS and centrifuged at 5000 rpm for 15 min three times to remove the supernatant. Finally, the obtained precipitates (i.e. GNPM-labeled pAb2, designated as GNPM–pAb2) were re-dispersed in 1.0 mL of pH 7.4 PBS containing 1.0 wt% bovine serum albumin and stored at 4 °C when not in use.
Preparation of the electrochemical immunosensor
A glassy carbon electrode (GCE, 3 mm in diameter) was polished repeatedly with 0.3 μm and 0.05 μm alumina slurry, followed by successive sonication in acetone, ethanol and deionized water for 5 min before drying in air. Following that, a layer of gold nanoparticles (GNP) was electrochemically deposited on the surface of the GCE using a potential of −0.2 V for 60 s in 1.0 mmol L−1 HAuCl4 according to our previous report.15 Afterwards, the GNP-modified GCE was immersed into the mAb1 (1.0 mg mL−1), and incubated for 12 h at 4 °C. Finally, the as-prepared immunosensor was incubated in 1.0 wt% BSA for 60 min at RT to eliminate non-specific binding effects and block the remaining active groups. The obtained electrode (designated as mAb1/GNP/GCE) was stored at 4 °C for further usage.Electrochemical measurements
All electrochemical measurements were carried out with a conventional three-electrode system with a modified GCE as working electrode, a platinum foil as auxiliary electrode, and a saturated calomel electrode (SCE) as reference electrode. Initially, 5 μL of standards or samples with various CEA concentrations and 5 μL of the prepared GNPM–pAb2 suspension were simultaneously dropped on the mAb1/GNP/GCE, and incubated for 1 h at 37 °C to ensure an adequate reaction between antigens and antibodies. After washing with pH 7.4 PBS, the electrochemical measurements were carried out in pH 5.5 ABS containing 2.5 mmol L−1 H2O2 using differential pulse voltammetry (DPV) from −300 to −900 mV (vs. SCE) with a pulse amplitude of 50 mV and a pulse width of 50 ms. All incubations and measurements were conducted at RT. Analyses were all performed in triplicate. The preparation process and measurement principle of the electrochemical immunosensor are schematically illustrated in Scheme 1.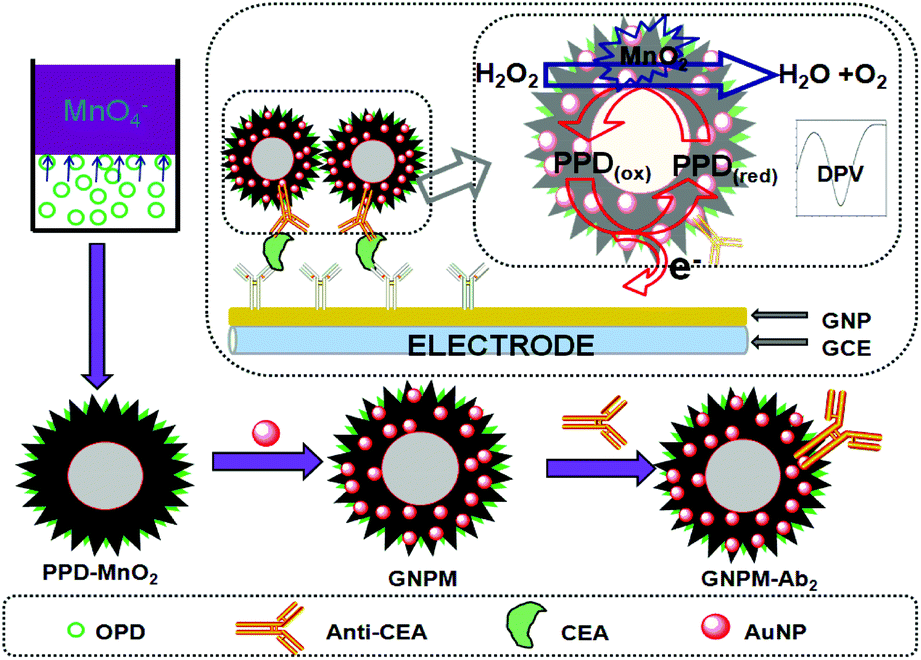 | ||
| Scheme 1 Schematic illustration of the electrochemical immunoassay using GNPM–pAb2 as signal tags and the preparation process of the GNPM nanotag. | ||
Results and discussion
Characterization of the as-prepared GNPM and GNPM–pAb2
Fig. 1 shows typical field emission scanning electron microscopy (FESEM) and transmission electron microscopy (TEM) images obtained. As shown from Fig. 1a, the PPD–MnO2 was composed of many agglomerated submicron spheres with an average diameter of 350 nm. Also, the submicron spheres consisted of radial nanosheets with a thickness of less than 10 nm. Numerous nanogold particles were dispersed on the PPD–MnO2 (Fig. 1b). The presence of gold nanoparticles provided a large surface area for the conjugation of biomolecules. Interestingly, it was observed from Fig. 1c that the as-prepared PPD–MnO2 submicron spheres have a hollow structure with a shell thickness of about 50 nm. The growth mechanism of the PPD–MnO2 composites could be briefly rationalized as follows. In the beginning, the chemical oxidative polymerization of OPD and the reduction of MnO4− to manganese oxides occurred at the aqueous/organic interfacial region concurrently. Due to a slow diffusion of OPD into the reactive interface, the self-assembled growth of a hollow PPD–MnO2 composite would be favored. And the hydrophilic nature of the PPD–MnO2 composite causes it to diffuse from the interface into the upper aqueous phase,33 thus preventing the contact between MnO2 and OPD monomers. This would prevent reduction of MnO2 by OPD, and result in the formation of mesoporous PPD–MnO2 hollow nanostructures.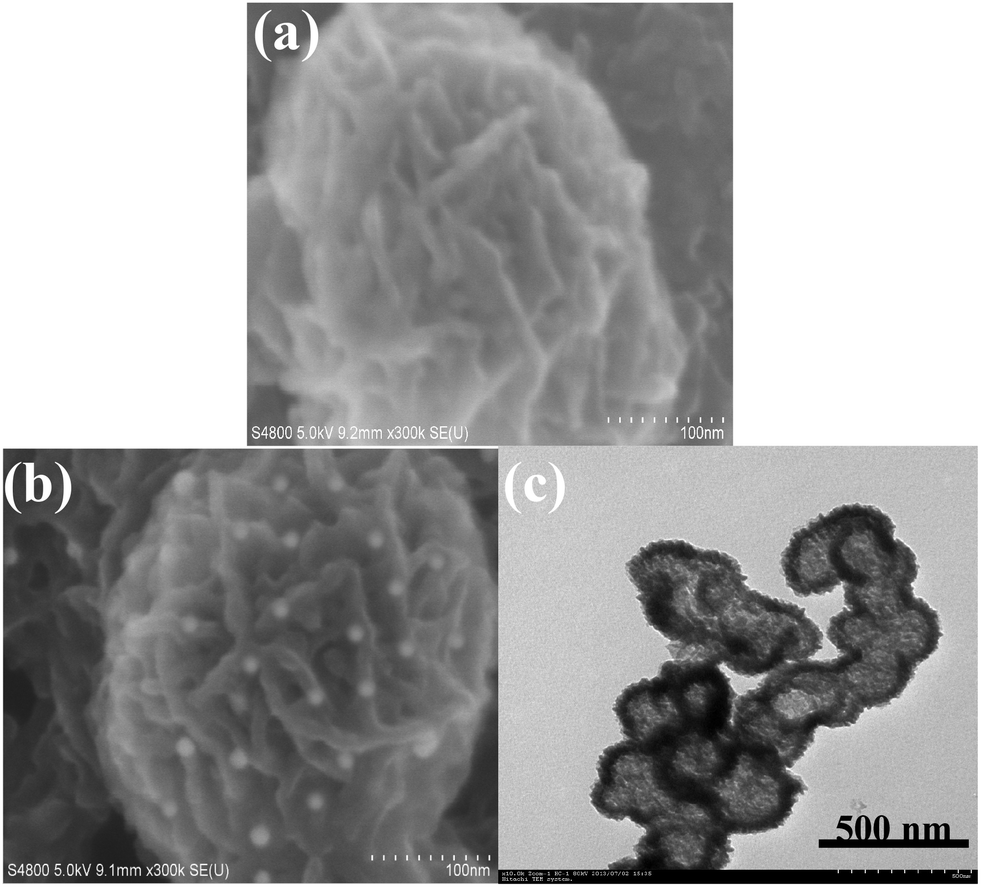 | ||
| Fig. 1 SEM images of (a) PPD–MnO2 and (b) GNPM, and (c) TEM image of the as-synthesized GNPM. | ||
Fourier transform infrared (FTIR) spectroscopy was used to characterize the structure of the PPD–MnO2. Fig. 2A is the FTIR spectrum of PPD–MnO2. The peak at 3430 cm−1 corresponded to the N–H stretching vibrations of the NH group, and the peak centered at 3163 cm−1 was assigned to the N–H stretching vibrations of the NH2 group. The peak at 1615 cm−1 was associated with the C![[double bond, length as m-dash]](https://www.rsc.org/images/entities/char_e001.gif) N stretching vibrations in the phenazine ring. The peaks appearing at 1381 and 1158 cm−1 were related to the PPD conductivity and a degree of delocalization of electrons, indicating that the PPD is doped by HCl to an extent.34 The peaks at 1112 and 833 cm−1 were attributed to the in-plane vibrations and the out-of-plane deformation of C–H in the benzene ring, respectively. The presence of the bands appearing at 520 cm−1 was assigned to Mn–O stretching vibrations. To further investigate the formation of mesoporous PPD–MnO2, an N2 adsorption–desorption test was performed to characterize the specific surface area and the pore-size distribution of the PPD–MnO2, and the resulting isotherm and BJH plot are given in Fig. 2B. As seen in Fig. 2B, a typical type IV isotherm with a hysteresis loop of type H3 appeared in the N2 adsorption–desorption isotherm. This type of isotherm suggests the PPD–MnO2 had a disordered mesoporous structure, in which the mesopores arose from the packing of ultrathin nanosheets giving rise to slit-shaped pores. The calculated BJH pore-size distribution was narrow and centered with a diameter of 3.5 nm (inset in Fig. 2B). The prepared PPD–MnO2 with a well-defined mesoporous structure was beneficial for the facilitation of electron transfer due to the presence of nanoscale pores that can facilitate the penetration of the base solution and ions. And the BET specific surface area of the PPD–MnO2 was quantified to be 216 m2 g−1. Hence, mesoporous PPD–MnO2 was expected to provide more accessible electroactive sites for the catalysis of H2O2 and immobilized more gold nanoparticles for the labelling of more biomolecules.
N stretching vibrations in the phenazine ring. The peaks appearing at 1381 and 1158 cm−1 were related to the PPD conductivity and a degree of delocalization of electrons, indicating that the PPD is doped by HCl to an extent.34 The peaks at 1112 and 833 cm−1 were attributed to the in-plane vibrations and the out-of-plane deformation of C–H in the benzene ring, respectively. The presence of the bands appearing at 520 cm−1 was assigned to Mn–O stretching vibrations. To further investigate the formation of mesoporous PPD–MnO2, an N2 adsorption–desorption test was performed to characterize the specific surface area and the pore-size distribution of the PPD–MnO2, and the resulting isotherm and BJH plot are given in Fig. 2B. As seen in Fig. 2B, a typical type IV isotherm with a hysteresis loop of type H3 appeared in the N2 adsorption–desorption isotherm. This type of isotherm suggests the PPD–MnO2 had a disordered mesoporous structure, in which the mesopores arose from the packing of ultrathin nanosheets giving rise to slit-shaped pores. The calculated BJH pore-size distribution was narrow and centered with a diameter of 3.5 nm (inset in Fig. 2B). The prepared PPD–MnO2 with a well-defined mesoporous structure was beneficial for the facilitation of electron transfer due to the presence of nanoscale pores that can facilitate the penetration of the base solution and ions. And the BET specific surface area of the PPD–MnO2 was quantified to be 216 m2 g−1. Hence, mesoporous PPD–MnO2 was expected to provide more accessible electroactive sites for the catalysis of H2O2 and immobilized more gold nanoparticles for the labelling of more biomolecules.
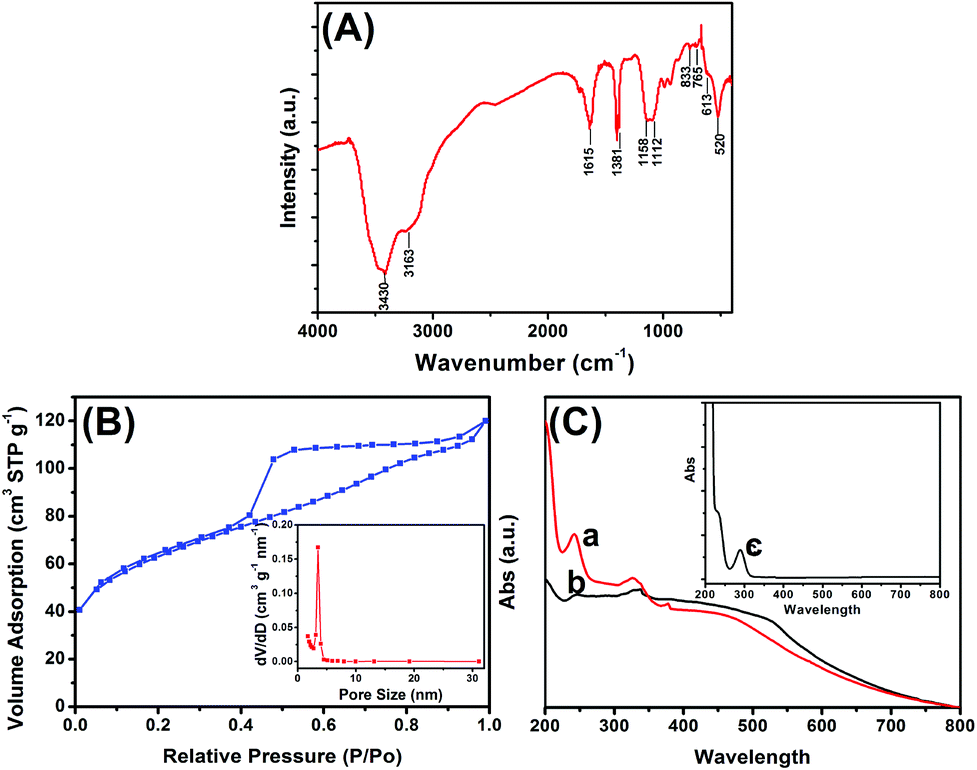 | ||
| Fig. 2 (A) FTIR spectrum of PPD–MnO2, (B) N2 adsorption–desorption isotherm of PPD–MnO2 (inset: pore distribution), and (C) UV-vis absorption spectra of (a) PPD–MnO2, (b) GNPM and (c) o-phenylenediamine. | ||
To further monitor the assembly of nanogold and pAb2 antibody on the surface of PPD–MnO2, UV-vis absorption spectrometry (UV 1102, Tianmei, China) was also used. One characteristic peak at 290 nm was observed for pure o-phenylenediamine (curve ‘c’ in Fig. 2C), while two absorption peaks at 248 nm and 451 nm were obtained for PPD–MnO2 (curve ‘a’ in Fig. 2C). The reason for this might be attributed to the formation of poly(o-phenylenediamine). As is well known, there are two different types of structure for poly(o-phenylenediamine): a phenazine-type structure35 and a polyaniline-like backbone structure.36 The dimer and oligomer containing the phenazine-type have been reported to give absorption bands at 420 nm and 451 nm, respectively.37 The immobilization of poly(o-phenylenediamine) in PPD–MnO2 could provide a precondition for the assembly of gold nanoparticles. After the gold nanoparticles were immobilized on PPD–MnO2, two absorption peaks were obtained at 248 nm and 518 nm (curve ‘b’ in Fig. 2C). The peak at 518 nm might be derived from the peak due to nanogold particles. Importantly, the absorbance of poly(o-phenylenediamine) (248 nm) was obviously lower than that of PPD–MnO2 alone. Hence, the result suggested that nanogold particles could be assembled on the PPD–MnO2.
Characteristics of the electrochemical immunosensor
Typically, the bioactivity and amount of the immobilized biomolecules can be largely affected by the surface properties of the transducer. Thus, a layer of GNP was electrodeposited on the bare electrode, which was expected to increase the surface coverage of the modified electrode, and enhance the immobilized amount of the mAb1 antibody. As seen from Fig. 3A, the bare GCE and the GNP/GCE were qualitatively determined using cyclic voltammetry in 0.5 mol L−1 H2SO4. The cathodic peak current of GNP/GCE (curve ‘b’ in Fig. 3A) is much higher than that of the bare GCE (curve ‘a’ in Fig. 3A) within the applied potentials, indicating that the GNP-modified GCE could provide a large surface area for immobilization of biomolecules.27 The inset of Fig. 3A displays the electron impedance spectroscopy (EIS) curves of the GNP/GCE before and after modification with mAb1. As seen from curve ‘a’ in the inset of Fig. 3A, a relatively small resistance (∼10 Ω) was observed with the GNP/GCE. When the mAb1 antibody was conjugated onto the GNP/GCE, the resistance dramatically increased (∼425 Ω) due to the weak conductivity of antibodies (curve ‘b’ in the inset of Fig. 3A). These results indicated that the introduction of biomolecules hinder electron transfer. Moreover, the coverage of the mAb1 antibody on the GNP/GCE could be calculated from the EIS spectrum via the equation: θ = (Rct − R0ct)/Rct (where R0ct and Rct represent the electrochemical impedance before and after immobilization of antibodies, respectively).38 The results obtained from the EIS spectra indicated that the coverage of mAb1 has basically reached saturation with a value of 97%.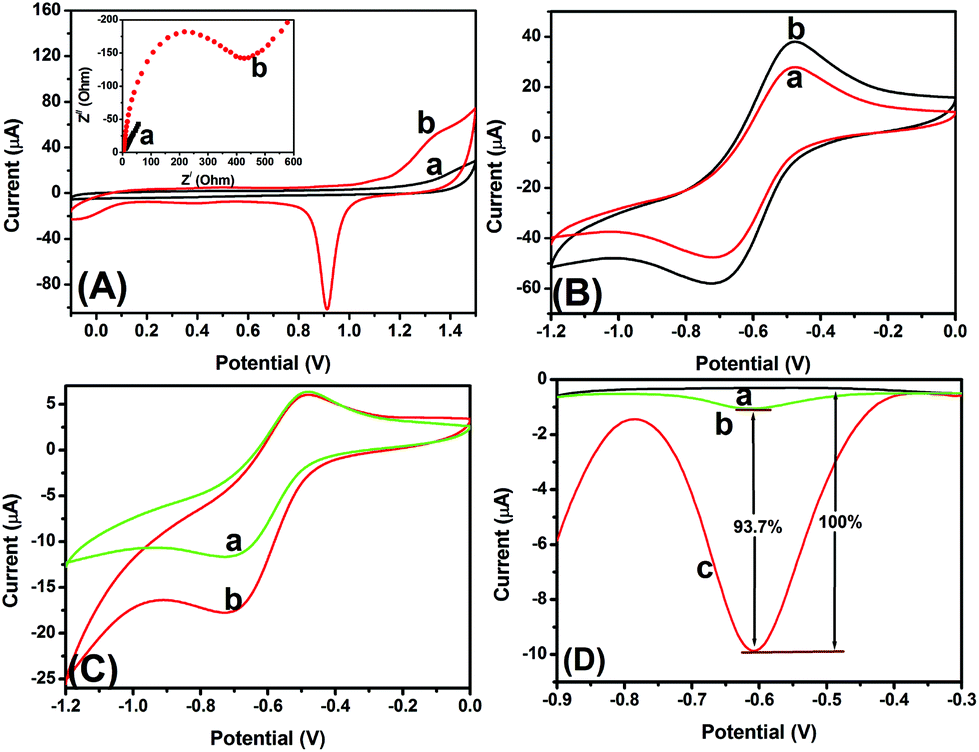 | ||
| Fig. 3 (A) Cyclic voltammograms of (a) the bare GCE and (b) the GNP/GCE in 0.5 mol L−1 H2SO4 at 50 mV s−1 (inset: electrochemical impedance spectra of (a) the GNP/GCE and (b) mAb1/GNP/GCE in pH 7.4 PBS containing 5 mmol L−1 Fe(CN)63−/4− and 0.1 mol L−1 KCl). (B) Cyclic voltammograms of (a) PPD–MnO2-modified GCE and (b) GNPM-modified GCE in pH 5.5 ABS. (C) Cyclic voltammograms of mAb1/GNP/GCE after incubation with 5 ng mL−1 CEA and GNPM–pAb2 in pH 5.5 ABS in the (a) absence and (b) presence of 2.5 mmol L−1 H2O2. (D) DPV responses of (a) mAb1/GNP/GCE, (b) the electrode from ‘a’ after incubation with 0 ng mL−1 CEA and GNPM–pAb2, and (c) the electrode from ‘a’ after incubation with 5 ng mL−1 CEA and GNPM–pAb2 in pH 5.5 ABS containing 2.5 mmol L−1 H2O2. | ||
To investigate the effect of the nanogold-modified PPD–MnO2, the GNPM and PPD–MnO2 were directly added dropwise onto bare GCEs. After drying, the modified electrodes were tested using cyclic voltammetry in pH 5.5 ABS. As seen from Fig. 3B, a couple of redox peaks with greater peak currents were observed with the GNPM-modified GCE (curve ‘b’ versus curve ‘a’). The results indicated that the presence of gold nanoparticles could accelerate the electron transfer when doped onto the PPD–MnO2.39
To realize our design, the newly prepared immunosensor was used for the detection of 5 ng mL−1 CEA (used as an example). As seen from curve ‘a’ in Fig. 3C, a couple of stable redox peaks at −500 mV and −700 mV appeared in pH 5.5 ABS after incubation with GNPM–pAb2. Upon addition of H2O2 in pH 5.5 ABS, an obvious catalytic characteristic appeared with an increase of the reduction current (curve ‘b’ in Fig. 3C). These results indicated that the as-synthesized GNPM could possess catalytic activity, and be preliminarily used for the detection of CEA with a sandwich-type assay format.
To further clarify whether the as-prepared mAb1/GNP/GCE could non-specifically adsorb the GNPM–pAb2, the as-prepared immunosensors were used for the detection of 0 and 5 ng mL−1 CEA (as an example), and the characteristics were investigated in pH 5.5 ABS by using differential pulse voltammetry (Fig. 3D). No peak was observed for the immunosensor (curve ‘a’ in Fig. 3D). When the immunosensor was incubated with 0 ng mL−1 CEA and excess GNPM–pAb2, however, a small peak current was achieved (curve ‘b’ in Fig. 3D). In contrast, the peak current increased by 93.7% relative to the DPV peak current of curve ‘b’ when the immunosensor was reacted with 5 ng mL−1 CEA (curve ‘c’ in Fig. 3D). Hence, GNPM–pAb2 could be preliminarily utilized for the detection of target CEA by the designed route.
Analytical performance
Using GNPM–pAb2 as detection tags, the sensitivity and dynamic range of the developed electrochemical immunosensor were evaluated toward CEA standards in pH 5.5 ABS containing 2.5 mmol L−1 H2O2 with a sandwich-type immunoassay format. As seen from the inset in Fig. 4a, the DPV peak currents increased with increasing CEA concentration. A linear dependence between the peak currents and the logarithm of CEA concentration was obtained in the range from 0.01 to 80 ng mL−1 with a detection limit (LOD) of 6.0 pg mL−1 estimated at a signal-to-noise ratio of 3 (n = 18) (Fig. 4a). Since the threshold value in normal human serum is about 3 ng mL−1 for CEA, the electrochemical immunosensor can completely meet the requirement of clinical diagnostics. Although the system has not yet been optimized for maximum efficiency, the sensitivity of the electrochemical immunoassays was lower than that of a commercialized CEA ELISA kit (0.32 ng mL−1, Genway Biotech. Inc.).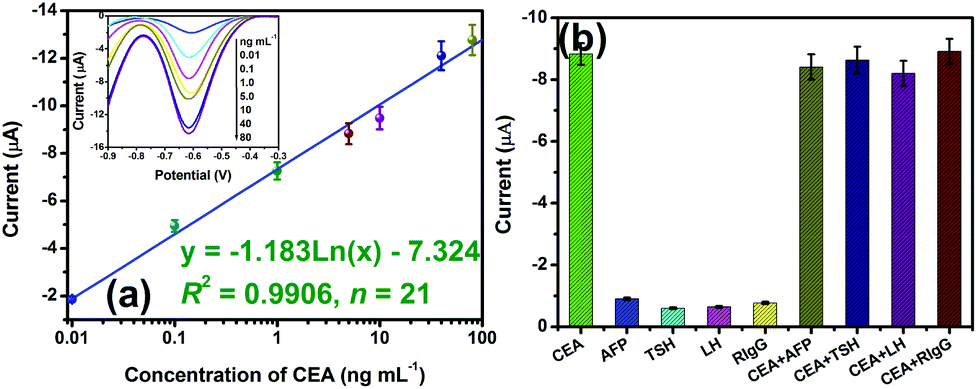 | ||
| Fig. 4 (a) Calibration plots of the electrochemical immunosensor toward CEA standards (inset: the corresponding DPV curves in pH 5.5 ABS containing 2.5 mmol L−1 H2O2), and (b) the specificity of the electrochemical immunosensor. | ||
To evaluate the specificity of the developed electrochemical immunosensor for target CEA, we challenged the system with other biomarkers or proteins, e.g. alpha-fetoprotein (AFP), thyroid stimulating hormone (TSH), luteinizing hormone (LH) and rabbit IgG (RIgG). Initially, these samples were assayed alone by using the developed immunoassay, and then the mixture containing target CEA and interfering material was studied. As seen from Fig. 4b, a high electrochemical signal could be obtained toward target CEA. More significantly, the existence of interfering agents in the target CEA sample did not affect an obvious change in the current in comparison with target CEA alone. So, the electrochemical immunosensor exhibited high specificity.
The precision and reproducibility of the electrochemical immunosensor was monitored by assaying three CEA standards (high, middle and low levels) using identical batches of mAb1/GNP/GCE and GNPM–pAb2. Experimental results indicated that the coefficients of variation (CVs, n = 3) of the intra-assay with the same batch were 6.7%, 6.8% and 4.3% for 0.1, 5, 20 ng mL−1 CEA, respectively, whilst the CVs of the inter-assay with various batches were 7.5%, 9.8% and 8.2% toward the above-mentioned standards, respectively. The CVs of the intra-assay and inter-assay were below 10%. Therefore, the reproducibility of the electrochemical immunosensor was acceptable.
When the as-prepared mAb1/GNP/GCE and GNPM–pAb2 were not in use, they were stored at 4 °C. The analytical properties of the electrochemical immunosensor were monitored every five days by using 5 ng mL−1 CEA as an example. Experimental results indicated that as much as 88.6% of the initial electrochemical signal was maintained after storing for 30 days.
Analysis of real samples and evaluation of method accuracy
The possible applicability of the developed electrochemical immunosensor for real samples was also investigated by assaying 10 clinic serum specimens with various concentrations of CEA, which were provided by the Fujian Provincial Hospital of China according to the rules of the local ethical committee. Before measurement, these samples were gently shaken at RT (Note: all handling and processing were performed carefully, and all tools in contact with patient specimens and immunoreagents were disinfected after use) and then evaluated by using the electrochemical immunosensor. The obtained results were calculated according to the mentioned-above linear regression equation, which were compared with those obtained by using the commercialized electrochemiluminescent (ECL) immunoassay-based automatic analyzer. The results are listed in Table 1. As shown in Table 1, all the texp (t-test for experiment) values in the case were less than tcrit (t-test for criteria; tcrit[4, 0.05] = 2.77), indicating that no significant differences at the 0.05 significance level were encountered between two methods, thus revealing a high method accuracy of the electrochemical immunosensor.| Sample no. | Method; concentration (mean ± SD, n = 3, ng mL−1) | t exp | |
|---|---|---|---|
| Found by the immunosensor | Found by the ECL method | ||
| 1 | 0.8 ± 0.1 | 0.9 ± 0.1 | 1.22 |
| 2 | 5.9 ± 0.4 | 6.2 ± 0.3 | 1.04 |
| 3 | 64.1 ± 6.0 | 58.6 ± 5.6 | 1.16 |
| 4 | 25.2 ± 2.5 | 27.5 ± 3.0 | 1.02 |
| 5 | 8.7 ± 0.8 | 8.3 ± 0.7 | 0.65 |
| 6 | 3.5 ± 0.2 | 3.7 ± 0.4 | 0.77 |
| 7 | 35.3 ± 4.0 | 38.5 ± 3.4 | 1.06 |
| 8 | 56.2 ± 5.1 | 52.1 ± 3.2 | 1.18 |
| 9 | 17.7 ± 1.4 | 19.2 ± 1.1 | 1.46 |
| 10 | 46.7 ± 2.1 | 48.9 ± 2.4 | 1.19 |
Conclusions
In summary, this work describes the design of a new electrochemical immunosensor for the sensitive detection of low-abundance protein (CEA used in this case) in biological fluids by using mesoporous GNPM as nanotag and peroxidase mimics for the amplification of detectable signal. Mesoporous MnO2–PPD organic–inorganic hybrid nanostructures are not only employed as the building blocks for the assembly of nanogold and proteins, but are also used as peroxidase mimics for the reduction of H2O2 with the help of PPD. The synergistic reaction between the redox-active PPD and the catalytic MnO2 promotes amplification of the electrochemical signal. Compared with conventional enzyme immunoassays, the nanocatalyst-based immunoassay is favorable under harsh conditions. Future work should be focused on the detection of other low-abundance proteins by controlling the target antibody, thereby representing a versatile assay scheme.Acknowledgements
Support by the “973” National Basic Research Program of China (2010CB732403), the Research Fund for the National Science Foundation of Fujian Province (2011J06003), the Doctoral Program of Higher Education of China (20103514120003), the National Natural Science Foundation of China (21075019, 41176079), and the Program for Changjiang Scholars and Innovative Research Team in University (IRT1116) is gratefully acknowledged.Notes and references
- X. Cao, N. Wang, S. Jia, L. Guo and K. Li, Biosens. Bioelectron., 2013, 39, 226–230 CAS.
- S. Ayoub, K. Allan and N. Ebeid, Radiochemistry, 2013, 55, 428–435 CrossRef CAS.
- D. Tang, B. Zhang, J. Tang, L. Hou and G. Chen, Anal. Chem., 2013, 85, 6958–6966 CAS.
- G. Pelossof, R. Tel-Vered and I. Willner, Anal. Chem., 2012, 84, 3703–3709 CAS.
- A. Ambrosi, F. Airo and A. Merkocj, Anal. Chem., 2010, 82, 1151–1156 CAS.
- C. Zong, J. Wu, C. Wang, H. Ju and F. Yan, Anal. Chem., 2012, 84, 2410–2241 CAS.
- T. Li, J. Byun, B. Kim, Y. Shin and M. Kim, Biosens. Bioelectron., 2013, 42, 403–408 CrossRef CAS PubMed.
- X. Liu, Q. Wang, H. Zhao, L. Zhang, Y. Su and Y. Lv, Analyst, 2012, 137, 4552–4558 CAS.
- R. Liu, X. Liu, Y. Tang, L. Wu, X. Hou and Y. Lv, Anal. Chem., 2011, 83, 2330–2334 CAS.
- B. Zhang, Y. Cui, B. Liu, H. Chen, G. Chen and D. Tang, Biosens. Bioelectron., 2012, 35, 461–465 CrossRef CAS PubMed.
- W. Lai, D. Tang, L. Fu, X. Que, J. Zhuang and G. Chen, Chem. Commun., 2013, 49, 4761–4763 CAS.
- J. Tang, X. Chen, J. Zhou, Q. Li, G. Chen and D. Tang, Analyst, 2013, 138, 4327–4333 CAS.
- D. Tang, Y. Cui and G. Chen, Analyst, 2013, 138, 981–990 CAS.
- X. Pei, B. Zhang, J. Tang, B. Liu, W. Lai and D. Tang, Anal. Chim. Acta, 2013, 758, 1–18 CAS.
- W. Lai, D. Tang, X. Que, J. Zhuang, L. Fu and G. Chen, Anal. Chim. Acta, 2012, 755, 62–68 CAS.
- J. Tang, J. Zhou, Q. Li, D. Tang, G. Chen and H. Yang, Chem. Commun., 2013, 49, 1530–1532 RSC.
- H. Niu, R. Yuan, Y. Chai, L. Mao, Y. Yuan, Y. Gao and Y. Zhuo, Chem. Commun., 2011, 47, 8397–8399 CAS.
- S. Park, H. Boo and T. Chung, Anal. Chim. Acta, 2006, 556, 46–57 CAS.
- C. Lavery, M. Macinnis, J. Macdonld, J. Williams, C. Spencer, A. Burke, D. Irwin and G. D'Cunha, J. Agric. Food Chem., 2010, 58, 8471–8476 CAS.
- J. Xie, X. Zhang, H. Wang, H. Zheng and Y. Huang, TrAC, Trends Anal. Chem., 2012, 39, 114–129 CrossRef PubMed.
- W. Wei, X. Cui, W. Chen and D. Ivey, Chem. Soc. Rev., 2011, 40, 1697–1721 RSC.
- X. Xiao, Y. Song, H. Liu, M. Xie, H. Hou, L. Wang and Z. Li, J. Mater. Sci., 2013, 48, 4843–4850 CrossRef CAS.
- V. Russo, L. Protasova, R. Turco, M. De Croon, V. Hessel and E. Santacesaria, Ind. Eng. Chem. Res., 2013, 52, 7668–7676 CrossRef CAS.
- L. Luo, F. Li, L. Zhu, Z. Zhang, Y. Ding and D. Deng, Electrochim. Acta, 2012, 77, 179–183 CrossRef CAS PubMed.
- C. Langley, C. Biljana, C. Banks and R. Compton, Jpn. Soc. Anal. Chem., 2007, 23, 165–172 Search PubMed.
- Y. Han, J. Zheng and S. Dong, Electrochim. Acta, 2013, 90, 35–43 CrossRef CAS PubMed.
- H. Chen, Z. Gao, Y. Cui, G. Chen and D. Tang, Biosens. Bioelectron., 2013, 44, 108–114 CrossRef CAS PubMed.
- H. Yoshikawa, S. Imura and E. Tamiya, Anal. Chem., 2012, 84, 9811–9817 CrossRef CAS PubMed.
- Z. Gao, M. Xu, L. Hou, G. Chen and D. Tang, Anal. Chem., 2013, 85, 6945–6952 CrossRef CAS PubMed.
- J. Zhou, W. Lai, J. Zhuang, J. Tang and D. Tang, ACS Appl. Mater. Interfaces, 2013, 5, 2773–2781 CAS.
- J. Wang, Y. Yang, Z. Huang and F. Kang, J. Power Sources, 2012, 204, 236–243 CrossRef CAS PubMed.
- Z. Zhang, S. Patskovskyy, P. Bouvrette, J. Luong and A. Gedanken, J. Phys. Chem. B, 2004, 108, 4046–4052 CrossRef.
- N. Nuraje, K. Su, N. Yang and H. Matsui, ACS Nano, 2008, 2, 502–506 CrossRef CAS PubMed.
- Y. Sheng, J. Chen and D. Zhu, Acta Mater. Compositae Sin., 2004, 21, 1–7 CAS.
- S. Sivakkumer and R. Saraswathi, J. Appl. Electrochem., 2004, 34, 1147–1152 CrossRef PubMed.
- K. Chiba, T. Ohsaka, Y. Ohnuki and N. Oyama, J. Electroanal. Chem., 1987, 219, 117–124 CrossRef CAS.
- W. Premasiri and W. Euler, Macromol. Chem. Phys., 1995, 196, 3655–3666 CrossRef.
- E. Laviron, J. Electroanal. Chem., 1979, 100, 263–270 CrossRef CAS.
- X. Li, M. Huang, W. Duan and Y. Yang, Chem. Rev., 2002, 102(9), 2925–3030 CrossRef CAS PubMed.
| This journal is © The Royal Society of Chemistry 2014 |