Influence of the pattern size of micropatterned scaffolds on cell morphology, proliferation, migration and F-actin expression
Hiroshi
Sunami
*ab,
Ikuko
Yokota
ab and
Yasuyuki
Igarashi
b
aPRESTO, Japan Science and Technology Agency (JST), N21W11 Sapporo, Japan. E-mail: sunami@cris.hokudai.ac.jp; Fax: +81-11-706-9087; Tel: +81-11-706-9086
bFrontier Research Center for Post-genome Science and Technology, Hokkaido University Faculty of Advanced Science, N21W11 Sapporo, Japan
First published on 28th November 2013
Abstract
To determine how the three-dimensional (3D) shape of scaffolds influences cell functions, 3D micropatterned scaffolds of various sizes were fabricated on a silicon substrate. The micropatterns were equilateral triangular pores with 3–20 μm long sides, and all had the same pore ratio (total pore area per unit area) and depth. The patterns only differed in terms of their 2D size. Such scaffolds have not been previously generated, and thus the effects of pattern size on cell functions have not been addressed. NIH-3T3 cells were cultured on these micropatterned scaffolds, and their morphology, proliferation rate, migration rate, and level of F-actin expression were assessed. Cells became more rounded and F-actin expression decreased as the pattern size of the scaffold decreased. Relationships were also demonstrated between pattern size and cell proliferation and migration. These results suggest that the pattern size of 3D micropatterned scaffolds affects the level of mechanical stress that cells experience, and thereby influences F-actin expression, cell morphology, cell proliferation and cell migration.
Introduction
Cells adhere to three-dimensional (3D) extracellular matrices in vivo. Various 3D scaffolds, ranging in size from the nanometre1,2 to micrometre scale,3–5 have been used to reproduce such cell adhesion in vitro,6 and many studies have reported that the topologies of these scaffolds affect cell functions.The morphologies of cells cultured on 3D scaffolds with patterns of various shapes differ greatly from those of cells cultured on flat surfaces.7–13 For example, cells elongate parallel with the patterns of 3D scaffolds,4,12,14,15 the areas of cells that adhere differ between 3D patterned scaffolds and flat surfaces,8,16 and cell aggregation is greater on 3D patterned scaffolds than on flat surfaces.17–21 The growth capacity,8,13,20,22 metabolic function,13,19–21 and differentiation potential9,23 of cells grown on 3D patterned scaffolds markedly differ from those of cells grown on flat surfaces. However, the mechanisms that underlie these differences are only partly understood. The effect of the three-dimensional shape on cell functions still involves many unknown factors and the difference from the two-dimensional shape is not understood. Furthermore, it has been proposed that the pattern size of the 3D scaffold affects cell functions.8 However, this has not been clearly demonstrated because scaffolds with patterns that differ only in terms of their size have not been investigated. Furthermore, the 3D patterned scaffolds used to date vary widely in terms of pattern shape, chemical composition, electric charge and viscoelasticity. To determine the behaviour of cells cultured on patterned scaffolds, the effect of changing one property of the scaffold at a time, such as the size of the pattern, must be investigated.
In this study, we generated scaffolds that differed only in terms of the size of the pattern. Such scaffolds have not been previously generated, and thus the effect of pattern size on cells has not been addressed. Micropatterns of regular equilateral triangular pores of various sizes were generated on a silicon substrate. This substrate was chosen as it does not deform elastically, which meant that all of the scaffolds had the same elasticity and that the influence of pattern size, and no other factors, could be investigated.
These patterns had the same pore ratio and differed only in terms of the area of each pore. An equilateral triangle was chosen as it is a simple polygon with the lowest number of sides and vertices. The length of each side of the equilateral triangles ranged from 3 μm to 20 μm, which is smaller than the area of a spread NIH-3T3 cell. The patterns had a constant depth of approximately 18.1 μm, which meant that pore depth did not affect cell functions. NIH-3T3 cells were grown on these scaffolds, and their morphology, proliferation rate, migration rate and level of F-actin expression were assessed.
Materials and methods
Fabrication of 3D patterned scaffolds by photolithography
The 3D patterned scaffolds were fabricated on a silicone substrate using photolithography. The silicone substrate was a 10 mm × 10 mm quadrate that was 725 μm thick. Patterns were fabricated in various regions (1000 μm × 1000 μm), and each patterned area was located 500 μm from the adjacent patterned areas. The equilateral triangles had 3, 4, 5, 6, 7, 8, 9, 10, 15 or 20 μm long sides. The generation of these 3D patterned scaffolds on the substrate was confirmed by field emission scanning electron microscopy (FE-SEM; JSM-6700FT, Jeol Ltd, Japan) and colour laser 3D microscopy (VK-9700, Keyence Co., Japan). The cutting planes of the patterns were observed by FE-SEM, and the depths of five equilateral triangles of each pattern were measured and the mean depth was calculated.Determination of the pore ratios of the 3D patterned scaffolds
The 3D patterned scaffolds were observed using colour laser 3D microscopy. To examine cell proliferation and F-actin expression, five scaffolds of each pattern size were imaged using a 150× objective (Nikon Co., Japan). These images were analysed using Metamorph Software ver. 7.7 (Molecular Devices, Inc., USA) to determine the total pore area per unit area (the pore ratio) of each pattern. Shape analysis of the patterns was performed in an area of 71.0 μm × 94.6 μm. The pore ratios as determined by shape analysis were compared with the theoretical pore ratios, which were calculated on the basis of the blueprints of the patterns.Hydrophilic treatment, sterilization and degassing of 3D patterned scaffolds
The surfaces of the 3D patterned scaffolds were treated with oxygen plasma using reactive ion etching (RIE-10NRV, Samco, Inc., Japan), which greatly enhanced the hydrophilicity of the surfaces. The contact angle of a 5 μl water droplet on a flat silicon substrate was 72.6 ± 1.9° (n = 26) prior to oxygen cleaning and 11.2 ± 3.2° (n = 22) after oxygen cleaning.The 3D patterned scaffolds were sterilized at 120 °C for 20 min, immersed in a 35 mm cell culture dish containing culture medium, and degassed with gentle agitation at −0.08 to −0.09 MPa for 1 min. Extracellular matrix proteins that were adsorbed onto the 3D patterned scaffolds were observed using confocal laser scanning microscopy. Immunostained vitronectin, laminin and fibronectin were imaged using a 100× objective (Olympus Co., Japan), and were found to be homogenously distributed (data not shown).
Cells, reagents and experimental instruments
NIH-3T3 cells were purchased from DS Pharma Biomedical Co., Ltd (Japan). DMEM-low glucose, stabilized penicillin–streptomycin solution, 0.25% trypsin–EDTA solution, and the PKH26 Red Fluorescent Cell Linker Kit for General Cell Membrane Labeling were purchased from Sigma-Aldrich (United States). Foetal bovine serum (Gibco 26140) and phalloidin-Alexa 488 were purchased from Invitrogen (United States). Phosphate buffer solution containing 4% paraformaldehyde was purchased from NACALAI TESQUE, INC. (Japan). EUKITT was purchased from O. Kindler (Germany). Cell culture dishes (35 mm) were purchased from Corning (United States). Glass-bottomed 12ø dishes (35 mm) were purchased from Iwaki (Japan). Micro cover glasses were purchased from Matsunami Glass Ind., Ltd (Japan). PBS was used at pH 7.4.Observation and analysis of cell morphology using confocal laser scanning microscopy
The sterilized 3D patterned scaffolds were degassed as described above. NIH-3T3 cells were seeded onto the sterile substrates at a density of 1 × 10⁴ cells per cm2, cultured for 72 h in the aforementioned medium and culture conditions, and then fixed with PBS containing 4% paraformaldehyde. The cells were stained with phalloidin-Alexa 488 (1![[thin space (1/6-em)]](https://www.rsc.org/images/entities/char_2009.gif) :250, 6 h) to label F-actin. Micro cover glasses were applied with EUKITT mounting medium.
:250, 6 h) to label F-actin. Micro cover glasses were applied with EUKITT mounting medium.
The 3D morphologies of adhered cells were observed using confocal laser scanning microscopy (FV-1000D, Olympus Co., Japan). A reflection image of the scaffold and a fluorescence image of F-actin were simultaneously observed using a 40× objective (Olympus Co., Japan). To image regions of cells that had entered pores, imaging was performed from the level of the upper surface of the scaffold to a depth of 30 μm at 0.5 μm intervals.
Next, the 2D cell morphology was analysed using superimposed images of cells taken at the levels of the substrate and of the upper surface of the scaffold. To exclude the influence of the cell–cell interactions on cell morphology, 26 cells that were well separated from the surrounding cells were selected on each patterned scaffold and flat surface. The contours of these cells were manually traced, and their 2D cell area and slenderness ratio were measured using image analysis software (AxioVision4.8, Zeiss, Germany). The slenderness ratio was the ratio between the lengths of the major and minor axes of a cell with an ellipsoid shape.
Staining of living cells with PKH26
Cells were seeded onto scaffolds as described above, cultured for 2 h, and then immersed in PKH26 (1:500) for 4 min. The substrate was placed face-down in culture medium in a 35 mm (12ø) glass-bottomed dish so that it could be observed with an inverted microscope. The four corners of the substrate were positioned onto the frame of the glass coverslip so that there was sufficient space for the culture medium to diffuse between the downward-facing cells and the bottom of the dish. Cells were incubated at 37 °C in an atmosphere of 5% CO2/95% air and then cell proliferation and migration were assessed.
Estimation of cell proliferation
Cells were seeded onto five sterilized scaffolds of each triangular pore size, and were then stained with PKH26 as described above. Cells were observed at 4 and 72 h after seeding using an inverted fluorescence microscope (Observer Z1, Zeiss, Germany). A Stage Top Incubator INU-ZILCS (Tokai hit, Japan) was used to maintain the cell culture conditions of 37 °C, 5% CO2/95% air, and high humidity. Fluorescence images of the cells and reflection images of the substrates were simultaneously captured in fields of 871 μm × 690 μm using a 10× objective (Zeiss, Germany) and a CCD camera.The number of PKH26-labelled cells within the defined field was manually counted. Cell densities on the flat surfaces and each of the patterned scaffolds were compared 4 h and 72 h after seeding.
Time-lapse observation and estimation of cell migration
Cells were seeded onto the various scaffolds and stained with PKH26 as described above. Time-lapse microscopy commenced 4 h after seeding and images were acquired every 30 min using an inverted fluorescence microscope (Observer Z1, Zeiss, Germany) and a Stage Top Incubator INU-ZILCS (Tokai hit, Japan). The imaging conditions were as described above. To exclude the influence of cell–cell interactions, cell migration was only observed for 24 h, during which time cell density was comparatively low.Cell migrations were manually tracked using Metamorph Software ver. 7.7 and the coordinates of each cell were obtained at each time-point. Mean migration rates were determined by calculating the mean distance migrated per unit time using these coordinates, which were determined from images that were acquired every 30 minutes for a total of 24 hours. Then, the mean migration rates of six cells on each surface were averaged.
Analysis of F-actin expression
Cells were processed, stained, and mounted as described in the previous section and observed using confocal laser scanning microscopy (FV-1000D, Olympus Co., Japan). To compare the F-actin expression in cells cultured on flat and patterned surfaces, the boundaries between these surfaces were imaged using a 20× objective (Olympus Co., Japan). Fluorescence images of cells stained with phalloidin-Alexa 488 to label F-actin and reflection images of the substrates were captured simultaneously. To image regions of the cell that had entered pores, cells were imaged from the level of the upper surface of the scaffold to a depth of 30 μm at 0.5 μm intervals. Superimposed fluorescence images of F-actin taken at all levels of the scaffold were used. After most cells in the image had been selected, the mean brightness of cellular F-actin staining on each patterned and flat surface was analysed using Metamorph Software ver. 7.7. Moreover, to compare the morphology of F-actin in cells grown on the various surfaces, more highly magnified images of F-actin were acquired using a 100× objective (Olympus Co., Japan).Statistics
Statistical analyses were performed using GraphPad Prism (GraphPad Software, Inc., USA). The mean ± standard deviation is shown. One-way factorial ANOVA and Tukey's multiple comparison test (Fig. 1D, 3 and 4), or the Kruskal–Wallis test with a post-hoc test (Fig. 2I and J) were used to compare each patterned surface with the flat surface and all of the patterned surfaces to each other. P < 0.05 was considered significant. n.s., not significant; *p < 0.05; **p < 0.01; ***p < 0.001.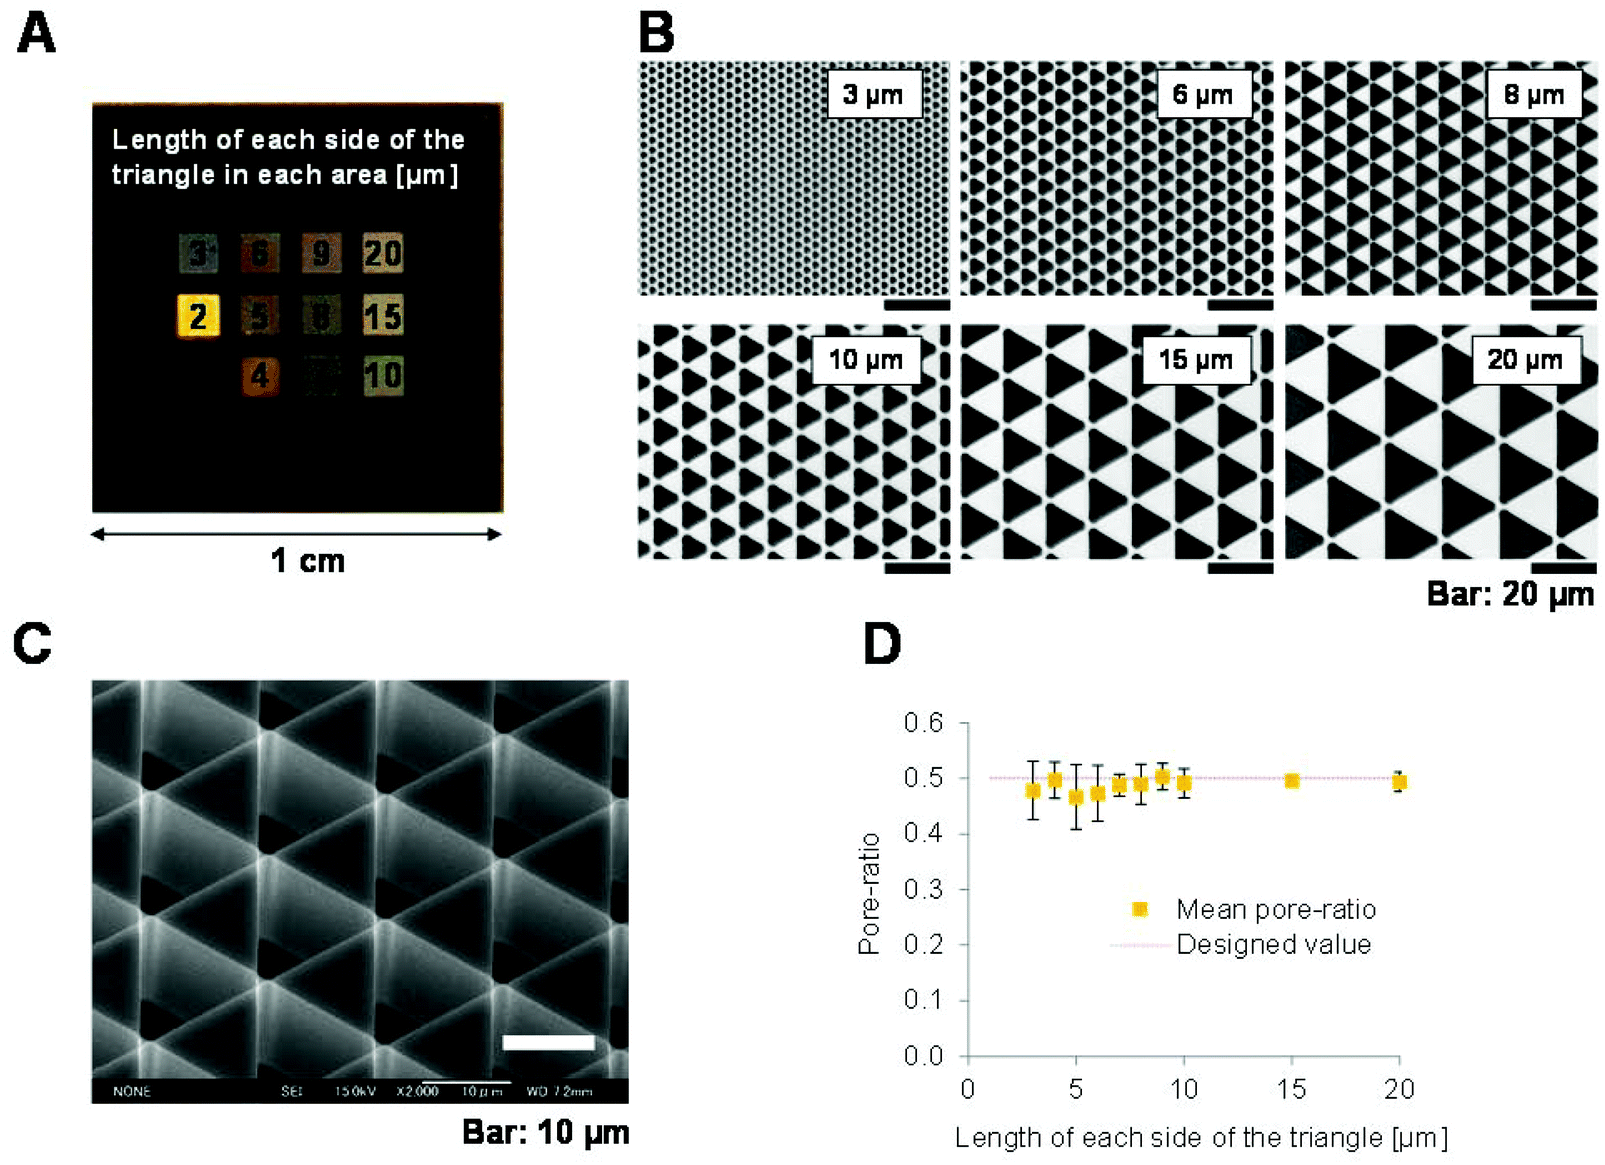 | ||
| Fig. 1 Properties of 3D patterned scaffolds of variously sized equilateral triangular pores generated by photolithography. (A) Overview image of the patterned silicon substrate taken with a digital camera. (B) Colour laser 3D microscopy images of the triangular pores of various sizes arranged in a scale pattern on the silicon substrate. Adjoining pores are not connected. The lengths of the sides of the triangles are indicated. (C) Field emission scanning electron microscopy image of a 3D patterned scaffold consisting of triangular pores oriented perpendicular to the surface. The vertices of the pores are slightly rounded as a result of the processing method. (D) Comparison of the actual and theoretical (designed value) pore ratios (total pore area per unit area). Values represent the mean ± standard deviation (n = 5). The theoretical values were calculated based on the blueprints of the photomasks. Statistical analysis confirmed that the pore ratios of the scaffolds did not significantly differ. | ||
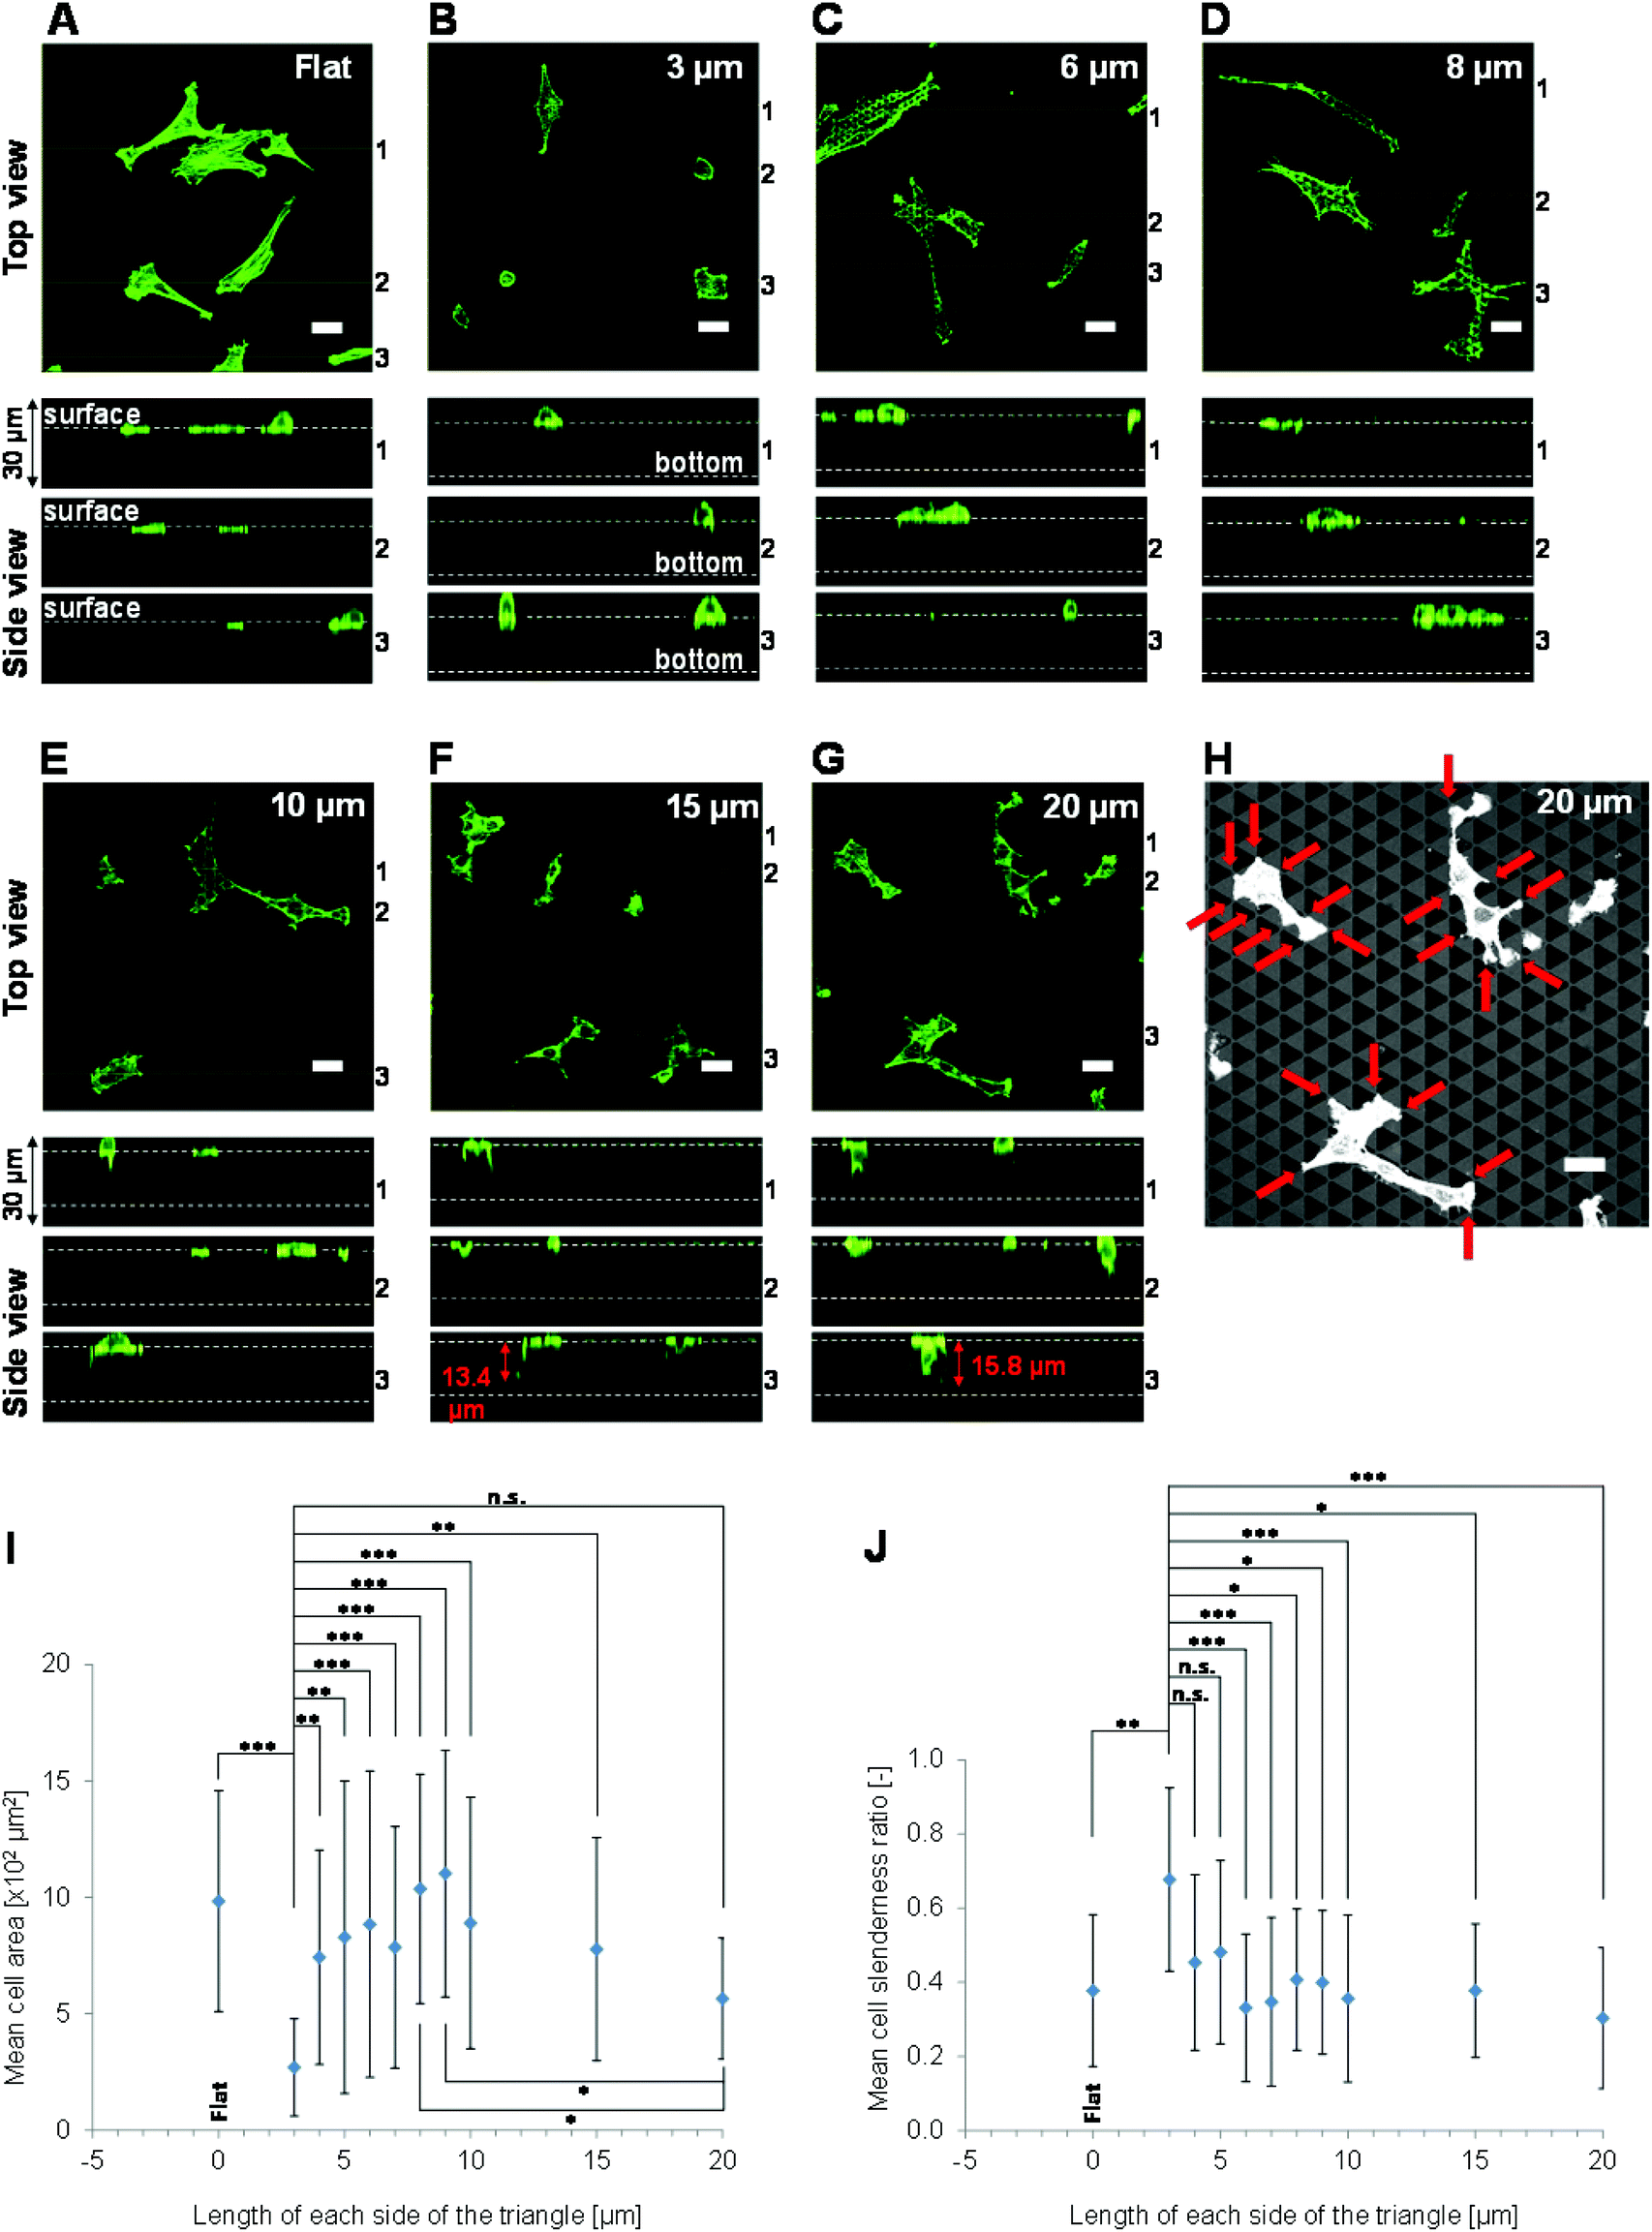 | ||
| Fig. 2 3D morphologies of phalloidin-Alexa 488-labelled NIH-3T3 cells cultured on the scaffolds for 72 h. (A–G) Images were acquired by confocal laser scanning microscopy from the level of the upper surface of the scaffold to a depth of 30 μm at 0.5 μm intervals. A top view and three sectional (side) views (1–3) are shown in each panel. The sectional images are from the levels denoted by lines 1–3 in the top view. These sites were selected because they contained many cells and were well separated from each other. The top views were produced by merging the fluorescence images taken at all intervals. Fluorescence intensity, which was enhanced to improve the visualization of cell morphology, differs between cells grown on the various scaffolds. The position of the upper surface of the pattern in the sectional views was confirmed by the reflection image of the pattern, which was observed simultaneously with the fluorescence image. Scale bars represent 30 μm. (H) Reflection image of cells grown on triangles with 20 μm long sides. Red arrows indicate cell protrusions extending along the edge of the pattern. (I) Mean areas of cells cultured on the flat surfaces or the various patterned scaffolds. Values represent mean ± standard deviation (n = 26). (J) The cell slenderness ratio is the ratio between the lengths of the major and minor axes of a cell with an ellipsoid shape. Values represent mean ± standard deviation (n = 26). | ||
Results
Fabrication of 3D scaffolds with different pattern sizes
The 3D shapes of cell matrices reportedly greatly influences cell function. To investigate this, we used photolithography to fabricate 3D patterned scaffolds with regular equilateral triangular pores on a silicon substrate (Fig. 1A). The triangular pores had 3–20 μm long sides and were densely arranged in a scale-like pattern (Fig. 1B and C). The silicon substrate does not deform elastically and the 3D patterned surface has a silicon crystal face and is smoother than a cover glass. The 3D patterned scaffolds were similar to each other and had an almost constant depth of 18.1 ± 0.3 μm (n = 50). This is larger than the thickness of a NIH-3T3 cell, which has a maximum thickness of 4 μm.24,25 The hydrophilicity of these silicon surfaces was enhanced by oxygen cleaning, and cell adhesion on these surfaces was comparable to that on a cleaned cover glass.To determine the pore ratio and pattern size of each scaffold, 3D images were obtained using colour laser 3D microscopy. The actual and theoretical pore ratios are shown in Fig. 1D. The actual pore ratios remained nearly constant in patterns of all sizes and were almost equal to the theoretical values. This confirmed that the patterns fabricated were almost the same as the blueprints, in which the pore ratio was constant.
In summary, 3D scaffolds with homogenous patterns over a wide area could be fabricated using photolithography. These patterns had an almost constant depth and pore ratio. This allowed the effect of the pattern size of the scaffold, and no other factors, on cell functions to be investigated.
Morphologies of cells grown on flat surfaces and 3D patterned scaffolds of various sizes
The morphologies of NIH-3T3 cells cultured on the various surfaces were assessed. First, the 3D morphologies of adhered NIH-3T3 cells cultured for 72 h were observed using confocal laser scanning microscopy. The top views of the cells varied greatly between the different pattern sizes. The morphologies of cells cultured on patterns of triangles with 3, 6, 8, 10, 15 or 20 μm long sides are shown in Fig. 2A–G. Cells grown on triangles with 3 μm long sides were small and rounded, whereas cells grown on triangles with 4–20 μm long sides were large and spread. Cells grown on all patterns extended protrusions over the pores. The cells grown on triangles with 15 or 20 μm long sides extended over the upper surface of the pores with an elongated morphology (quantitative data are not shown). A reflection image of cells grown on triangles with 20 μm long sides is shown (Fig. 2H). This image indicated that the cells extended protrusions along the edge of pattern. The edge is defined as the rim of the pore of a 3D patterned scaffold, or the top surface of the pattern. Cells grown on triangles with 15 or 20 μm long sides clearly extended along the patterns (quantitative data is not shown).The mean area of cells grown on triangles with 3 μm long sides was smaller than that of cells grown on triangles with 4–15 μm long sides (Fig. 2I). Moreover, the mean area of cells grown on triangles with 20 μm long sides was smaller than that of cells grown on triangles with 8 or 9 μm long sides (Fig. 2I). The mean slenderness ratio of cells grown on triangles with 3 μm long sides was larger than that of cells grown on triangles with 6–20 μm long sides (Fig. 2J). These results are in agreement with previous reports that cells grown on 3D patterned scaffolds with fine shapes are round and that the area of the cell that adheres to the scaffold is small.26–30
Side views of the cells were also acquired. Cells grown on triangles with 3, 6 or 8 μm long sides primarily extended in the horizontal direction, to the same extent as cells grown on flat surfaces, and rarely extended in the vertical direction (i.e., toward the base of the pore) (Fig. 2A–D). Although cells grown on triangles with 10, 15 or 20 μm long sides did extend in the vertical direction, they mainly adhered near the upper surface of the scaffolds, and did not adhere to the pore base (Fig. 2E–G). The greatest distance a cell body extended toward the pore base was 15.8 μm, which was observed on triangles with 20 μm long sides (Fig. 2G).
These results show that NIH-3T3 cells primarily adhere and extend close to the upper surfaces of 3D patterned scaffolds of non-continuous and subcellular size pores on the micrometre scale with an approximate depth of 18 μm.
Proliferation of cells grown on flat surfaces and 3D patterned scaffolds of various sizes
The densities of PKH26-labelled NIH-3T3 cells cultured on the various surfaces for 4 and 72 h were investigated. Cell numbers were determined and cell densities were estimated based on fluorescence images acquired at each time-point. The densities of cells grown on the various scaffolds for 4 or 72 h are shown in Fig. 3. After 4 h of culture, there were no significant differences between the densities of cells cultured on flat surfaces and those of cells cultured on the various scaffolds; however, there were marked differences after 72 h of culture. The densities of cells grown on triangles with 3–5 μm long sides were significantly lower than those of cells grown on flat surfaces (p < 0.01). By contrast, the densities of cells grown on triangles with 6–20 μm long sides were not significantly different from those of cells grown on flat surfaces. Moreover, the cell density tended to decrease as the size of the triangles decreased (Fig. 3).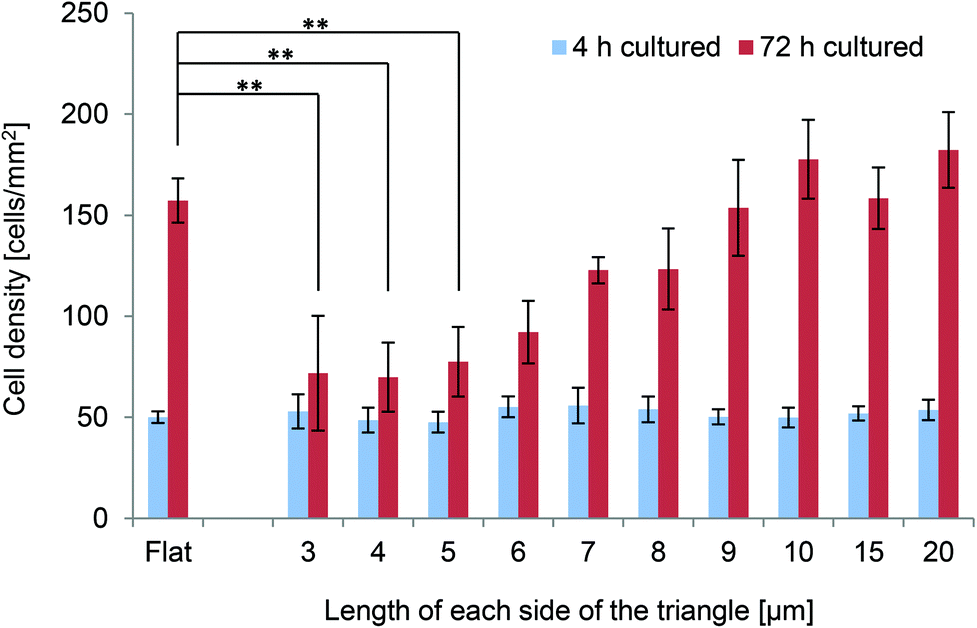 | ||
| Fig. 3 Densities of NIH-3T3 cells cultured on the scaffolds for 4 h or 72 h. Cells were manually counted in an 871 μm × 690 μm field, which was observed using a 10× objective and was located approximately at the centre of each pattern (1000 μm × 1000 μm area). Values represent mean ± standard deviation (n = 5). After 4 h of culture, the densities of cells grown on the flat surfaces were not significantly different from those of cells grown on the patterned surfaces, and the densities of cells grown on each of the patterned surfaces were not significantly different from each other. After 72 h of culture, the density of cells grown on the flat surfaces was significantly higher than those of cells grown on triangles with 3, 4 or 5 μm long sides (p < 0.01). After 72 h of culture, the densities of cells grown on triangles with 9–20 μm long sides were significantly higher than those of cells grown on triangles with 3–6 μm long sides (p < 0.05). The density of cells was higher after 72 h of culture than after 4 h of culture on each of the surfaces (p < 0.05), except for triangles with 3, 4 or 5 μm long sides (n.s.). | ||
As the cell densities after 4 h of culture were similar between the different surfaces, the cell densities after 72 h of culture were used to calculate the proliferation rates. Interestingly, the proliferation rates of cells grown on triangles with 3–6 μm long sides were significantly slower than those of cells grown on triangles with 9–20 μm long sides (p < 0.05). The proliferation rates of cells grown on triangles with 6–20 μm long sides were comparable to those of cells grown on flat surfaces, while the proliferation rates of cells grown on triangles with 3–5 μm long sides were slower than those of cells grown on flat surfaces.
Migration of cells grown on flat surfaces and 3D patterned scaffolds of various sizes
The migration rates of NIH-3T3 cells grown on the various surfaces were investigated. Time-lapse images of PKH26-labelled cells on each surface were commenced at 4 h after seeding for 24 h. The trajectories of six cells on each surface were traced, and the starting point of each cell was mapped to the origin. Representative examples are shown in Fig. 4A–D. The level of cell migration was higher on flat surfaces than on each of the 3D patterned scaffolds. The mean migration rates of cells cultured on each of the 3D patterned scaffolds were markedly slower than those of cells cultured on flat surfaces (Fig. 4E). Since NIH-3T3 cells primarily extended horizontally along the upper surfaces of the 3D patterned scaffolds, it was assumed that the area of a cell that was adhered to the surface was smaller on the 3D patterned scaffolds (in which the pore ratio was 50%) than on the flat surfaces. Therefore, the reduced mean cell migration rates on the patterned surfaces were expected. Interestingly, the mean cell migration rate was slowest when cells were cultured on triangles with 3 μm long sides, and this migration rate was significantly slower than those of cells cultured on triangles with 6, 7, 8, 15 or 20 μm long sides.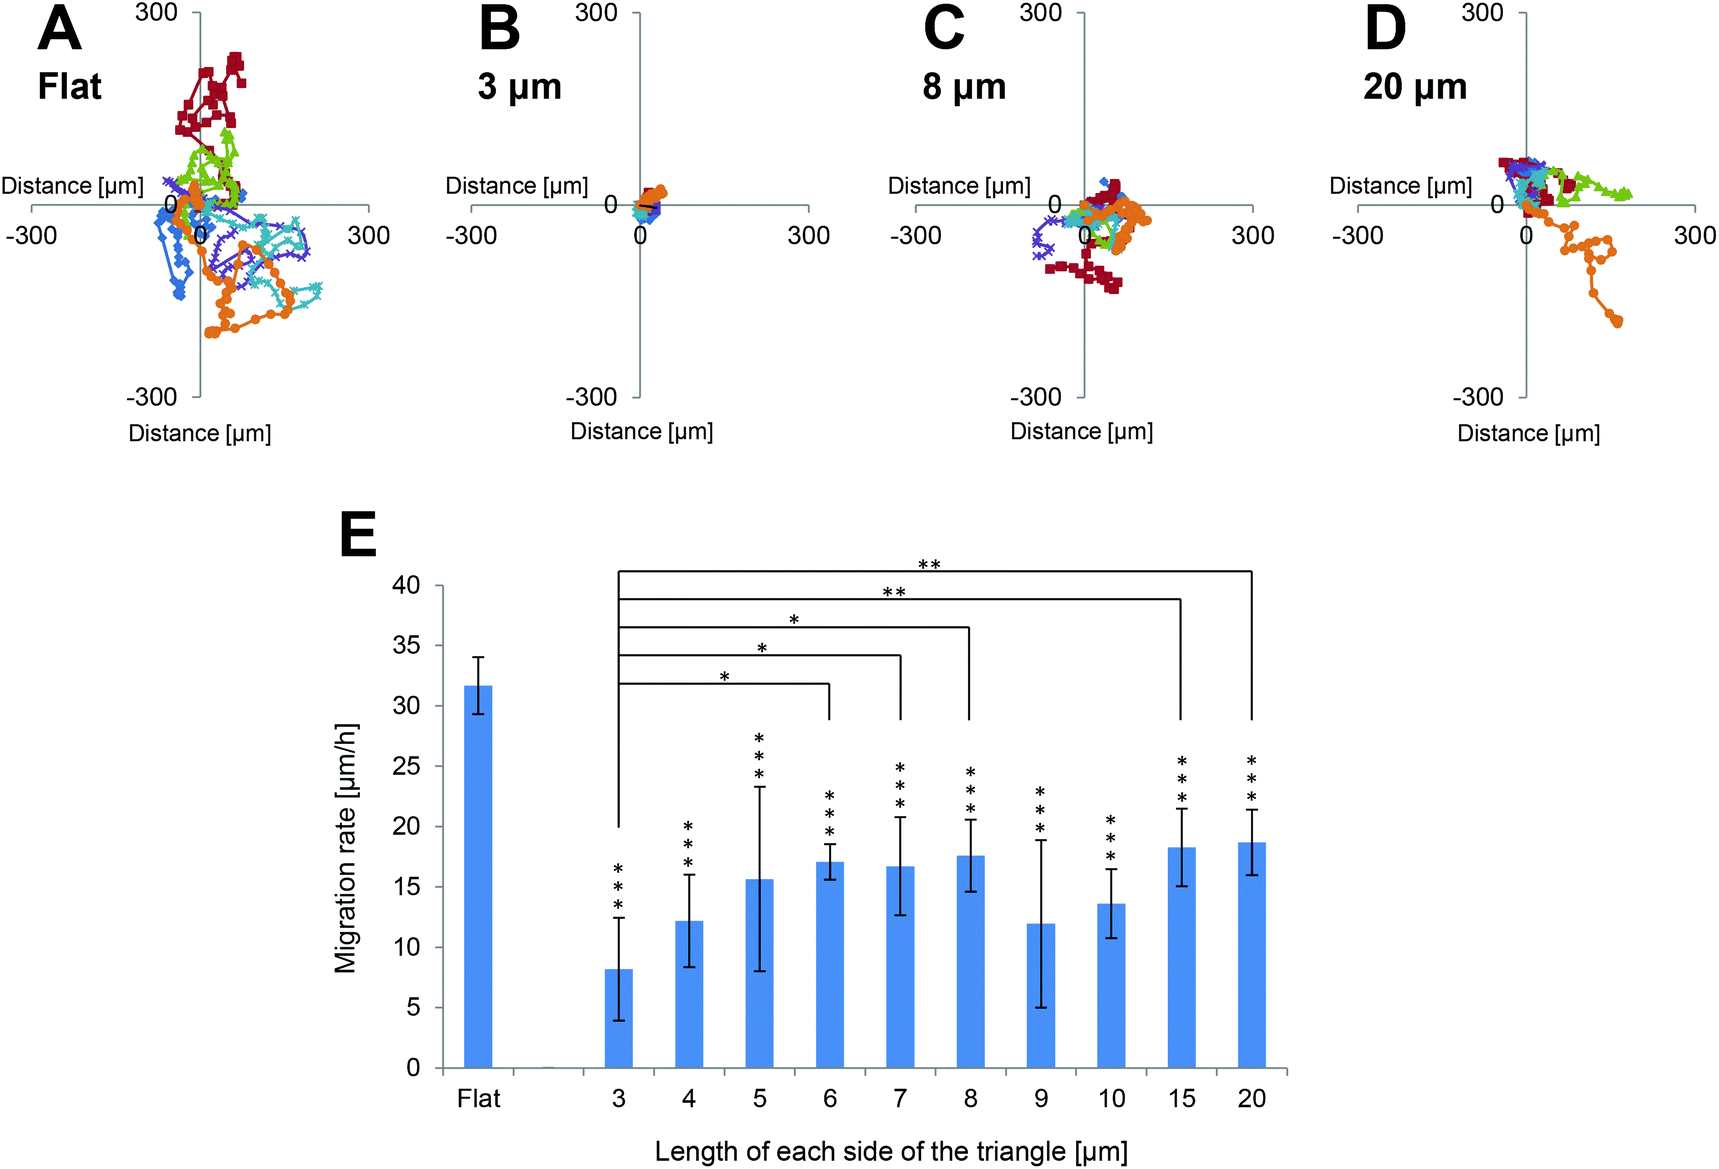 | ||
| Fig. 4 Migration rates of NIH-3T3 cells cultured on the scaffolds. (A–D) Trajectories of six cells cultured on the (A) flat surface or scaffolds of triangles with (B) 3 μm, (C) 8 μm, or (D) 20 μm long sides. These are representative examples. Cells were imaged at 30 min intervals for 24 h and the coordinates of each cell were obtained at each time-point by manual tracking of the cells. Trajectories were based on the coordinates of the cells and the starting position of each cell was mapped to the origin. (E) Mean migration rates of cells cultured on each surface (n = 6 cells per surface). Values represent the mean ± standard deviation. The mean migration rate of cells cultured on the flat surfaces was significantly faster than those of cells cultured on each of the pattered scaffolds (p < 0.01). The mean migration rate of cells cultured on triangles with 3 μm long sides was significantly slower than that of cells cultured on triangles with 6 μm (p < 0.05), 7 μm (p < 0.05), 8 μm (p < 0.05), 15 μm (p < 0.01), or 20 μm (p < 0.01) long sides. | ||
Level of F-actin expression in cells grown on flat surfaces and 3D patterned scaffolds of various sizes
The rigidity of the surface on which cells are cultured affects the level of F-actin expression, which in turn affects cell proliferation,26 migration,27,31–35 morphology26–30 and differentiation.36–41 Based on this, we hypothesised that F-actin might underlie why the rates of cell proliferation and migration decreased as the size of the 3D patterned scaffold decreased. To investigate this, we assessed F-actin expression in cells cultured on each of the surfaces. Images were acquired of phalloidin-Alexa 488-labelled cells at boundaries between the patterned and flat surfaces using confocal laser scanning microscopy (Fig. 5A). In cells cultured on flat surfaces, the fluorescence intensity of F-actin staining was high and arranged in thick, long actin filaments. Such staining was not observed in cells cultured on any of the 3D patterned scaffolds. The fluorescence intensity of F-actin staining was weaker in cells cultured on the 3D patterned scaffolds than in cells cultured on the flat surfaces. Fig. 5B shows the mean brightness of cellular F-actin staining on each patterned and flat surface in the images shown in Fig. 5A. The mean brightness of cellular F-actin staining in ten flat areas shown in Fig. 5A was 48.2 ± 3.5 (arb. unit). Expression of F-actin was higher in cells that were grown on a scaffold with a large pattern than in cells that were grown on a scaffold with a small pattern. A magnified view of F-actin in a cell at a boundary between a flat surface and a patterned surface of triangles with 10 μm long sides is shown in Fig. 5C; the fluorescence intensity of F-actin staining was weaker on the 3D patterned scaffold than on the flat surface.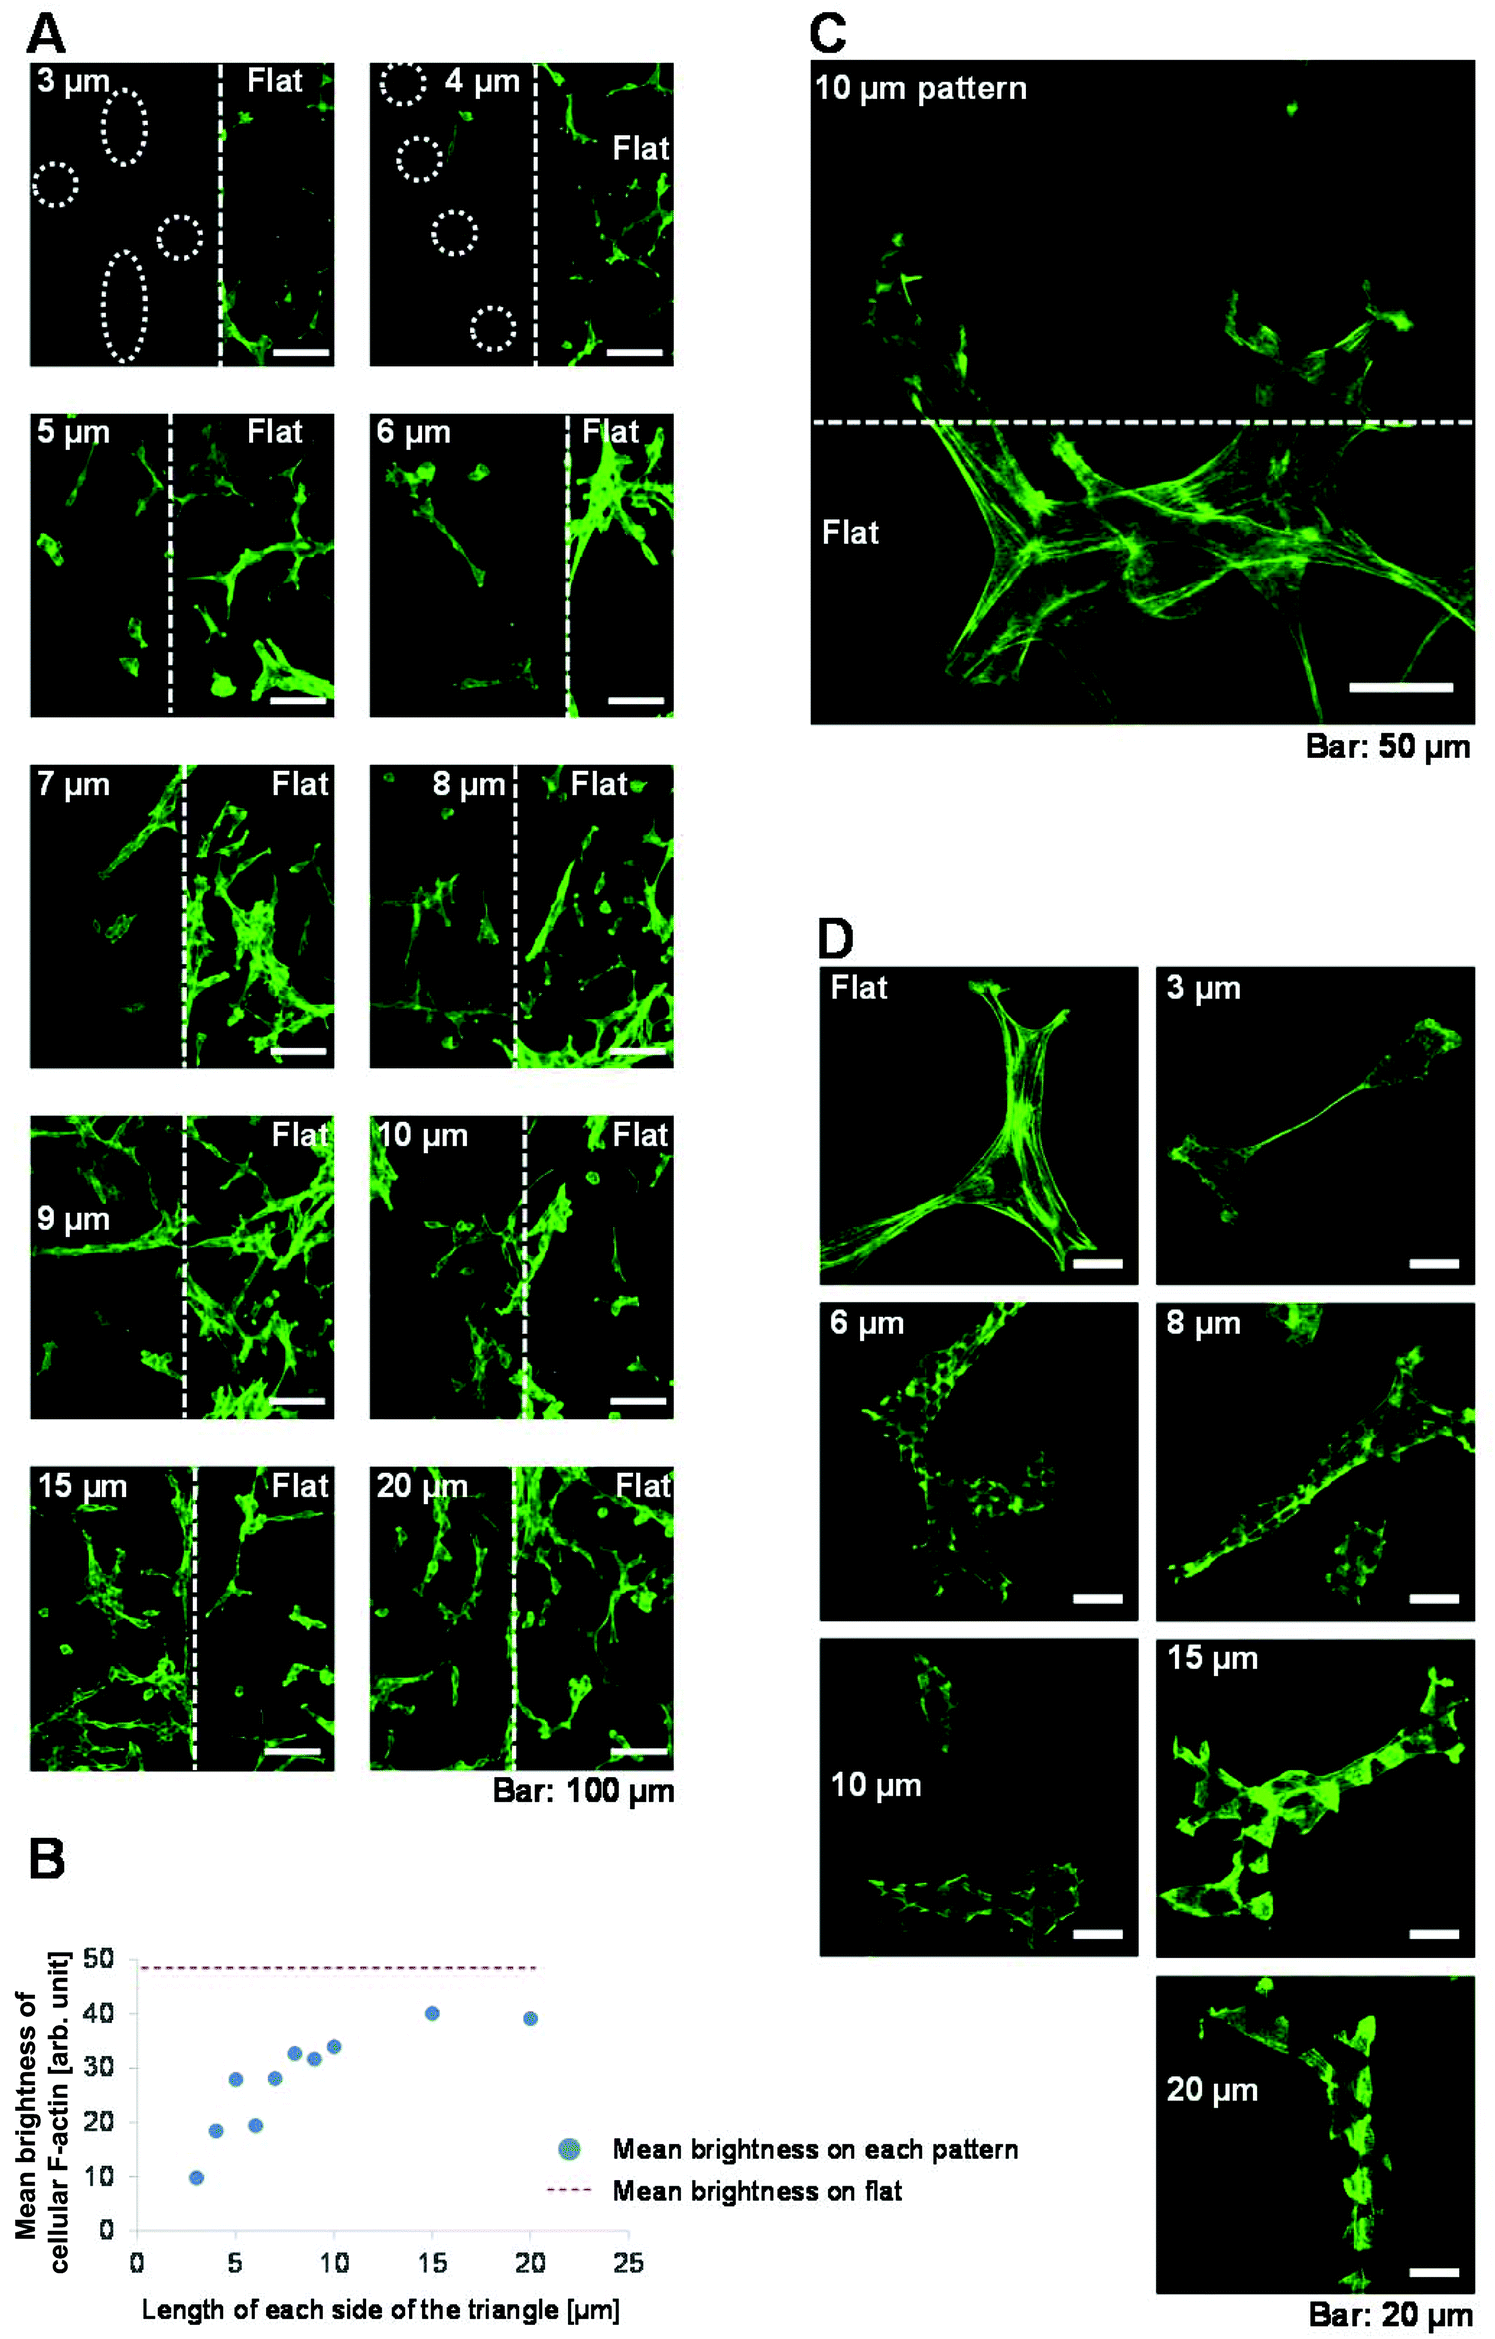 | ||
| Fig. 5 F-actin expression in NIH-3T3 cells cultured on the scaffolds. (A) Cells were cultured for 72 h on the various scaffolds and then labelled with phalloidin-Alexa 488 to stain F-actin. Confocal laser scanning microscopy images were acquired of the boundaries between the patterned and flat surfaces. Images were taken from the level of the upper surface of the scaffold to a depth of 30 μm at 0.5 μm intervals. Merged images of the fluorescence images taken at all intervals are shown. The central white dashed line indicates the boundary between the patterned (left) and flat (right) surfaces, which were drawn based on the merged reflection and fluorescence images. The white dashed circles shown in 3 μm and 4 μm indicate cells in which the fluorescence intensity is low. Images were captured under constant conditions using the same light source on the same day and are displayed with the same contrast and brightness. (B) Mean brightness of cellular F-actin staining in each patterned and flat area was analysed using the images shown in (A). Mean brightness of cellular F-actin staining in ten flat areas shown in (A) was 48.2 ± 3.5 (arb. unit), which is indicated by the dashed red line in (B). (C) Magnified view of F-actin in a cell at the boundary between a flat surface and a surface of triangles with 10 μm long sides. (D) Magnified views of cells cultured on flat surfaces or on triangles with 3, 6, 8, 10, 15 or 20 μm long sides and stained with phalloidin-Alexa 488. | ||
More magnified views of F-actin staining in cells cultured on each of the surfaces were acquired (Fig. 5D). The level of F-actin expression was lower and the filaments were shorter in cells cultured on 3D patterned scaffolds than in cells cultured on flat surfaces. Interestingly, the level of F-actin expression was lower in cells cultured on triangles with 3–10 μm long sides than in cells cultured on triangles with 15 or 20 μm long sides. Thus, cells cultured on patterned scaffolds of different sizes expressed different levels of F-actin.
Discussion
Influence of the 3D shape of scaffolds on cell functions
In cells cultured on 3D patterned scaffolds, the expression levels of adhesion signalling complexes,42 focal adhesion kinase13,42 and F-actin,13,15,43 their proliferative,8,13,20,22 cell aggregation17–20 and metabolic13,19–21 capacities, and their differentiation potential9,23 differ from those of cells cultured on flat surfaces. Although such differences have been demonstrated in many different cell types, the underlying mechanisms remain unclear. It is difficult to compare the effects of 3D scaffold size on cell behaviour quantitatively on the basis of previous reports because the patterns used differ in terms of material composition, shape, pore ratio and depth. To determine the physical properties of the 3D patterned scaffolds that underlie these differences in cell behaviours, we examined cells cultured on scaffolds with equilateral triangular pores of various sizes. We investigated whether cell functions differ when cells are grown on these patterned scaffolds, which differ only in terms of unit size and, if so, the underlying mechanism.Influence of the pattern size of scaffolds on cell functions
F-actin expression was lower in cells cultured on small triangles (3–10 μm long sides) than in cells cultured on large triangles (15 or 20 μm long sides) (Fig. 5A, B and D). The rigidity of the surface on which cells are cultured affects the level of F-actin expression, which in turn affects cell proliferation,26 migration,27,31–35 morphology26–30 and differentiation.36–41 Based on this, we hypothesise that the pattern size of the scaffold on which cells are grown influences the level of F-actin expression (Fig. 5), which in turn affects cell proliferation (Fig. 3) and migration (Fig. 4). It is uncertain how cells sense the size of the 3D patterned scaffold on which they are grown. Desmosomes44,45 and actin filaments26–28,30 form readily when cells sense strong mechanical stress. F-actin expression was lowest in cells cultured on triangles with sides shorter than 10 μm (Fig. 5A, B and D), which shows that mechanical stress decreases as the pattern size decreases.Interestingly, cells grown on triangles with 3 μm long sides were small and rounded. This resembles the morphologies of cells cultured on soft scaffolds, which exert little mechanical stress on cells. Moreover, when cells are cultured on soft scaffolds, the level of F-actin expression is reduced,26–28,30 the sizes of the adhered areas of cells decreases,26–30 and the rates of proliferation26 and migration27,31 tend to decrease (Table 1). However, the relationship between the rigidity of the scaffold and cell migration should be interpreted with caution because the migration rates of some cell types decrease on hard scaffolds and increase on soft scaffolds.32,33 Furthermore, cells that express high levels of adhesion proteins migrate faster on soft scaffolds than on hard scaffolds.34,35 Cells cultured on triangles with 8–9 μm long sides spread more than cells cultured on triangles with 20 μm long sides; cells cultured on triangles with 3 μm long sides spread very little (Fig. 2H). These results indicate that the size of the adhered area of a NIH-3T3 cell increases as the mechanical stress that the 3D substrate exerts on cells decreases, up to a threshold level; when the mechanical stress falls below this threshold level, the size of the adhered area starts to decrease. This is in agreement with a study by Yeung et al.28
Mechanical stress on adhered cells
Based on previous reports (Table 1) and our observations of F-actin expression, cell morphology, proliferation and migration (Table 2), we hypothesised that the level of mechanical stress cells experienced decreased as the pattern size decreased (Fig. 6). In support of this, long, thick actin filaments are observed in cells cultured on 3D scaffolds with patterns on the micrometre scale.46 In contrast, the level of F-actin expression is lower in cells cultured on nanoscale 3D patterned scaffolds than in cells cultured on flat surfaces.12,47 It cannot be assumed that the 3D shape of the scaffold exerts strong mechanical stress on adherent cells.15,48,49 We showed that the level of mechanical stress that a scaffold exerts on cells is modulated by its pattern size. Therefore, pattern size may be a useful parameter for calculating the amount of mechanical stress that a 3D substrate exerts on cells.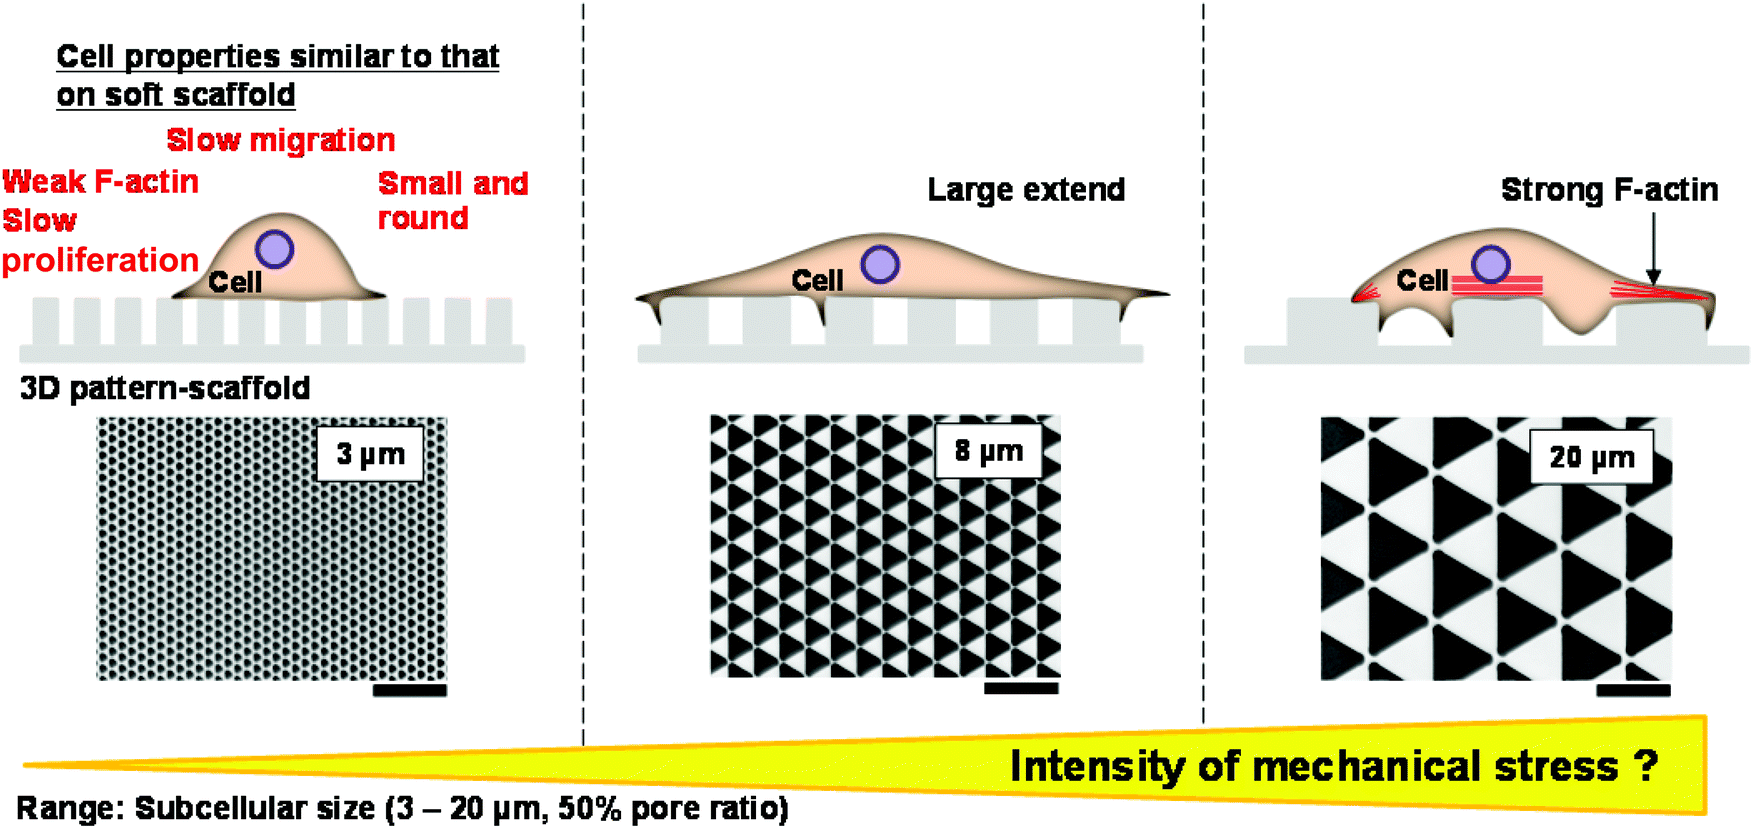 | ||
| Fig. 6 Schematic illustration of the level of mechanical stress that 3D micropatterned scaffolds exert on cells as a function of the unit size of the pattern. The level of mechanical stress that a substrate exerts on cells may decrease as the pattern size decreases. Scale bars represent 20 μm. | ||
| Small size (3 μm) | Middle size (8 μm) | Large size (20 μm) | |
|---|---|---|---|
| F-actin | Weak | Medium | Strong |
| Morphology | Round and small | Large extend | Extend along pattern |
| Proliferation | Slow | n.s. | Fast |
| Migration | Slow | n.s. | Fast |
Conclusions
The goal of this study was to quantify the influence of the shape sizes of 3D patterned scaffolds on cell functions, since such analyses had not been previously performed. We fabricated 3D micropatterned scaffolds of regular equilateral, triangular pores of various sizes on a silicon substrate. These patterns differed only in terms of the pattern size and had a constant pore ratio and depth, which was greater than the thickness of a cell. This allowed us to describe quantitatively how the pattern size influences cell functions.The migration and proliferation rates of NIH-3T3 cells cultured on these scaffolds tend to decrease as the pattern size decreases. Thus, the pattern size of 3D patterned scaffolds affects cell functions. Furthermore, the level of F-actin expression changes in response to mechanical stress, and this likely contributes to the relationship between pattern size and cell proliferation and migration. Although only patterns on the micrometre scale were used in this study, we expect that pattern size will affect cell functions on most 3D patterned scaffolds.
Acknowledgements
This work was supported by JST PRESTO “Nanosystems and Emergent Functions”, a MEXT Grant-in-Aid for Young Scientists (A) (20680024), and MEXT Grant-in-Aids for Exploratory Research (21657037 and 25560186). The microfabrication of scaffolds in this study was supported by Hokkaido Innovation through Nanotechnology Support (HINTS) centred at Hokkaido University and Nano-Integration Foundry (NIMS) of the “Nanotechnology Platform Project” operated by MEXT, Japan.References
- I. Wheeldon, A. Farhadi, A. G. Bick, E. Jabbari and A. Khademhosseini, Nanotechnology, 2011, 22, 212001 CrossRef PubMed.
- J. J. Norman and T. A. Desai, Ann. Biomed. Eng., 2006, 34, 89–101 CrossRef PubMed.
- A. Khademhosseini, R. Langer, J. Borenstein and J. P. Vacanti, Proc. Natl. Acad. Sci. U. S. A., 2006, 103, 2480–2487 CrossRef CAS PubMed.
- A. Curtis and C. Wilkinson, Biomaterials, 1997, 18, 1573–1583 CrossRef CAS.
- V. L. Tsang and S. N. Bhatia, Adv. Drug. Deliv. Rev., 2004, 56, 1635–1647 CrossRef PubMed.
- J. Lee, M. J. Cuddihy and N. A. Kotov, Tissue Eng. Part B Rev., 2008, 14, 61–86 CrossRef CAS PubMed.
- M. Ghibaudo, J. M. Di Meglio, P. Hersen and B. Ladoux, Lab Chip, 2011, 11, 805–812 RSC.
- M. Tanaka, A. Takayama, E. Ito, H. Sunami, S. Yamamoto and M. Shimomura, J. Nanosci. Nanotechnol., 2007, 7, 763–772 CrossRef CAS PubMed.
- Y. Miyagawa, H. Okita, M. Hiroyama, R. Sakamoto, M. Kobayashi, H. Nakajima, Y. U. Katagiri, J. Fujimoto, J. Hata, A. Umezawa and N. Kiyokawa, Tissue Eng. Part A, 2011, 17, 513–521 CrossRef CAS PubMed.
- T. Nishikawa, R. Ookura, J. Nishida, K. Arai, J. Hayashi, N. Kurono, T. Sawadaishi, M. Hara and M. Shimomura, Langmuir, 2002, 18, 5734–5740 CrossRef CAS.
- T. Nishikawa, M. Nonomura, K. Arai, J. Hayashi, T. Sawadaishi, Y. Nishiura, M. Hara and M. Shimomura, Langmuir, 2003, 19, 6193–6201 CrossRef CAS.
- E. K. Yim, E. M. Darling, K. Kulangara, F. Guilak and K. W. Leong, Biomaterials, 2010, 31, 1299–1306 CrossRef CAS PubMed.
- D. W. Hamilton, K. S. Wong and D. M. Brunette, Calcif. Tissue Int., 2006, 78, 314–325 CrossRef CAS PubMed.
- S. Jungbauer, R. Kemkemer, H. Gruler, D. Kaufmann and J. P. Spatz, ChemPhysChem, 2004, 5, 85–92 CrossRef CAS PubMed.
- S. Britland, H. Morgan, B. Wojiak-Stodart, M. Riehle, A. Curtis and C. Wilkinson, Exp. Cell Res., 1996, 228, 313–325 CrossRef CAS PubMed.
- M. J. Dalby, N. Gadegaard, M. O. Riehle, C. D. Wilkinson and A. S. Curtis, Int. J. Biochem. Cell Biol., 2004, 36, 2005–2015 CrossRef CAS PubMed.
- Y. Yoshii, A. Waki, K. Yoshida, A. Kakezuka, M. Kobayashi, H. Namiki, Y. Kuroda, Y. Kiyono, H. Yoshii, T. Furukawa, T. Asai, H. Okazawa, J. G. Gelovani and Y. Fujibayashi, Biomaterials, 2011, 32, 6052–6058 CAS.
- T. Sato, M. Tanaka, S. Yamamoto, E. Ito, K. Shimizu, Y. Igarashi, M. Shimomura and J. Inokuchi, J. Biomater. Sci. Polym. Ed., 2010, 21, 1947–1956 CrossRef CAS PubMed.
- M. Tanaka, K. Nishikawa, H. Okubo, H. Kamachi, T. Kawai, M. Matsushita, S. Todo and M. Shimomura, Colloids Surf., A, 2006, 284, 464–469 CrossRef PubMed.
- K. Nakamura, N. Kato, K. Aizawa, R. Mizutani, J. Yamauchi and A. Tanoue, J. Toxicol. Sci., 2011, 36, 625–633 CrossRef CAS.
- J. Lee, M. J. Cuddihy, G. M. Cater and N. A. Kotov, Biomaterials, 2009, 30, 4687–4694 CrossRef CAS PubMed.
- K. C. Popat, E. E. Leary Swan, V. Mukhatyar, K. I. Chatvanichkul, G. K. Mor, C. A. Grimes and T. A. Desai, Biomaterials, 2005, 26, 4516–4522 CrossRef CAS PubMed.
- S. Battista, D. Guarnieri, C. Borselli, S. Zeppetelli, A. Borzacchiello, L. Mayol, D. Gerbasio, D. R. Keene, L. Ambrosio and P. A. Netti, Biomaterials, 2005, 26, 6194–6207 CrossRef CAS PubMed.
- K. V. Christ, K. B. Williamson, K. S. Masters and K. T. Turner, Biomed Microdevices, 2010, 12, 443–455 CrossRef PubMed.
- C. Bottier, C. Gabella, B. Vianay, L. Buscemi, I. F. Sbalzarini, J. J. Meister and A. B. Verkhovsky, Lab Chip, 2011, 11, 3855–3863 RSC.
- A. M. Quinlan and K. L. Billiar, J. Biomed. Mater. Res. A, 2012, 100, 2474–2482 Search PubMed.
- B. Ananthanarayanan, Y. Kim and S. Kumar, Biomaterials, 2011, 32, 7913–7923 CrossRef CAS PubMed.
- T. Yeung, P. C. Georges, L. A. Flanagan, B. Marg, M. Ortiz, M. Funaki, N. Zahir, W. Ming, V. Weaver and P. A. Janmey, Cell Motil. Cytoskeleton, 2005, 60, 24–34 CrossRef PubMed.
- G. Jiang, A. H. Huang, Y. Cai, M. Tanase and M. P. Sheetz, Biophys. J., 2006, 90, 1804–1809 CrossRef CAS PubMed.
- M. J. Paszek, N. Zahir, K. R. Johnson, J. N. Lakins, G. I. Rozenberg, A. Gefen, C. A. Reinhart-King, S. S. Margulies, M. Dembo, D. Boettiger, D. A. Hammer and V. M. Weaver, Cancer Cell, 2005, 8, 241–254 CrossRef CAS PubMed.
- J. L. MacKay, A. J. Keung and S. Kumar, Biophys. J., 2012, 102, 434–442 CrossRef CAS PubMed.
- C. M. Lo, H. B. Wang, M. Dembo and Y. L. Wang, Biophys. J., 2000, 79, 144–152 CrossRef CAS.
- R. A. Jannat, G. P. Robbins, B. G. Ricart, M. Dembo and D. A. Hammer, J. Phys. Condens. Matter, 2010, 22, 194117 CrossRef PubMed.
- S. R. Peyton and A. J. Putnam, J. Cell. Physiol., 2005, 204, 198–209 CrossRef CAS PubMed.
- C. B. Khatiwala, S. R. Peyton and A. J. Putnam, Am. J. Physiol. Cell Physiol., 2006, 290, C1640–C1650 CrossRef CAS PubMed.
- J. Du, X. Chen, X. Liang, G. Zhang, J. Xu, L. He, Q. Zhan, X. Q. Feng, S. Chien and C. Yang, Proc. Natl. Acad. Sci. U. S. A., 2011, 108, 9466–9471 CrossRef CAS PubMed.
- M. D. Treiser, E. H. Yang, S. Gordonov, D. M. Cohen, I. P. Androulakis, J. Kohn, C. S. Chen and P. V. Moghe, Proc. Natl. Acad. Sci. U. S. A., 2010, 107, 610–615 CrossRef CAS PubMed.
- A. M. Kloxin, J. A. Benton and K. S. Anseth, Biomaterials, 2010, 31, 1–8 CrossRef CAS PubMed.
- P. M. Gilbert, K. L. Havenstrite, K. E. Magnusson, A. Sacco, N. A. Leonardi, P. Kraft, N. K. Nguyen, S. Thrun, M. P. Lutolf and H. M. Blau, Science, 2010, 329, 1078–1081 CrossRef CAS PubMed.
- A. I. Teixeira, S. Ilkhanizadeh, J. A. Wigenius, J. K. Duckworth, O. Inganas and O. Hermanson, Biomaterials, 2009, 30, 4567–4572 CrossRef CAS PubMed.
- A. J. Engler, S. Sen, H. L. Sweeney and D. E. Discher, Cell, 2006, 126, 677–689 CrossRef CAS PubMed.
- C. H. Seo, K. Furukawa, K. Montagne, H. Jeong and T. Ushida, Biomaterials, 2011, 32, 9568–9575 CrossRef CAS PubMed.
- S. Sarkar, M. Dadhania, P. Rourke, T. A. Desai and J. Y. Wong, Acta Biomater., 2005, 1, 93–100 CrossRef PubMed.
- N. Q. Balaban, U. S. Schwarz, D. Riveline, P. Goichberg, G. Tzur, I. Sabanay, D. Mahalu, S. Safran, A. Bershadsky, L. Addadi and B. Geiger, Nat. Cell Biol., 2001, 3, 466–472 CrossRef CAS PubMed.
- D. Riveline, E. Zamir, N. Q. Balaban, U. S. Schwarz, T. Ishizaki, S. Narumiya, Z. Kam, B. Geiger and A. D. Bershadsky, J. Cell Biol., 2001, 153, 1175–1186 CrossRef CAS.
- D. Motlagh, T. J. Hartman, T. A. Desai and B. Russell, J. Biomed. Mater. Res. A, 2003, 67, 148–157 Search PubMed.
- M. J. Dalby, M. O. Riehle, D. S. Sutherland, H. Agheli and A. S. Curtis, J. Biomed. Mater. Res. A, 2004, 69, 314–322 Search PubMed.
- K. Arai, M. Tanaka, S. Yamamoto and M. Shimomura, Colloids Surf., A, 2008, 313, 530–535 CrossRef PubMed.
- M. Ghibaudo, L. Trichet, J. Le Digabel, A. Richert, P. Hersen and B. Ladoux, Biophys. J., 2009, 97, 357–368 CrossRef CAS PubMed.
| This journal is © The Royal Society of Chemistry 2014 |