The influence of gold surface texture on microglia morphology and activation†
Yih Horng
Tan‡
,
Shana E.
Terrill‡
,
Geeta S.
Paranjape
,
Keith J.
Stine
and
Michael R.
Nichols
*
Department of Chemistry and Biochemistry and Center for Nanoscience, University of Missouri-St. Louis, One University Boulevard, St. Louis, Missouri 63121, USA. E-mail: nicholsmic@umsl.edu; Fax: +1 (314) 516-5342; Tel: +1 (314) 516-7345
First published on 23rd September 2013
Abstract
Microglial cells play a critical role in the propagation of neuroinflammation in the central nervous system. Microglia sense and respond to environmental signals including chemical, physical and biological cues from the surrounding cell/tissue components. In this project, our goal was to examine the effects of surface texture on BV-2 microglia morphology and function by comparing flat and nanoporous gold (np-Au) surfaces to the more conventional glass. The biocompatibility of np-Au with microglia was evaluated using functional cell assays and high resolution imaging with scanning electron microscopy (SEM). Microglia seeded on glass, ultra-flat gold (UF-Au), ultra-thin (UT) np-Au and np-Au monolith were adherent to all surfaces and their viability was not compromised as assessed by multiple toxicity assays. SEM revealed detailed morphological characteristics of adherent microglia and indicated few dramatic changes as a result of the different surfaces. Microglia proliferation was hampered by np-Au monolith but less by UT np-Au and not at all on UF-Au or glass. Microglial activation, measured by tumor necrosis factor α (TNFα) production, was fully functional (and equivalent) on all gold surfaces compared to glass. The present findings should help further the understanding of basic microglia biology on textured surfaces and more fully evaluate np-Au as a multi-functional biocompatible material. The knowledge obtained and technology developed will have a significant impact in the fabrication of nanoelectronic devices, chemical sensor development, porous nanostructured materials for BioMEMs/NEMs integration, and functional biomaterial coatings for drug delivery.
Introduction
Over the past few decades, significant efforts have focused on the development of new intelligent biomaterials or biomembrane-mimicking substrates/interfaces. These materials have the ability to monitor, investigate, and modulate biological behavior. The development of this capability will improve, and perhaps revolutionize therapeutics such as the repair of damaged tissues due to trauma, disease, or congenital abnormalities. However, such novel biomimetic interfaces must continually be evaluated for biocompatibility properties including in vivo stability, stimulation of the host immune response, and interaction with living cells.1 Gold has been investigated for many years as a potential biomaterial, both for application in biomedical devices and for use as a cell culture substrate. Many of these studies have investigated the effect of gold nanoscale topography or chemical modification of the gold surface on cellular response.2–5 The advantages of gold stem from its chemical stability, high conductivity6 and the advances in gold-thiol chemistry for presenting ligands or immobilized proteins for cell adhesion studies.4,7–9 Numerous examples of cell culture on gold or chemically-modified gold substrates have been reported and these studies demonstrate that cell adhesion is influenced by the size and geometric shape of the gold surface, the chemical and protein composition on the substrate surface or the mechanical properties of the substrate.10,11 In addition to bulk gold substrates, sub-nanometer size colloidal Au clusters or nanoparticles have attracted interest for potential applications for drug delivery or use as imaging contrast agents.12–14 Recently, it was demonstrated that microglial uptake of gold nanoparticles and subsequent microglial activation was influenced by the shape of the nanoparticles.15Nanoporous gold is a member of a new class of mesoporous metals that possess pores and ligaments ranging from tens to hundreds of nanometers in scale. These features are of increasing interest due to their potential applications in biosensors,6,16 catalysis,17 and cell culture platforms.5 The naturally occurring rough surface features of nanoporous gold are ideal for decreasing surface impedance and enhancing electrical potential stability in an implantable biomedical device.18,19 The resistance of nanoporous gold to corrosion and oxidation combined with its porosity makes it a unique material with significant feasibility as a potential platform for adherent cell culture and drug delivery.5 Numerous compatibility studies between mammalian cells and metallic surfaces, particularly gold, have been conducted recently reflecting the increased interest in this area. These studies have utilized both neurons and immune cells and have investigated a variety of interactions including internalization of gold nanoparticles, microglial activation by metal surfaces, differential cell adherence to electrodes, and gold surface effects on astrocyte morphology.5,15,20 Despite these important advances there are still numerous questions surrounding cell–gold surface interactions and it is important to demonstrate the effects of new types of substrates on cell adherence, viability, morphology, and function within the same study.
In the current study, gold substrates with different porosities, including ultra-thin nanoporous gold, were evaluated for their ability to support microglial survival, growth, and functional cytokine production upon stimulation. Scanning electron microscopy (SEM) was used in conjunction with cellular assays to evaluate, at high resolution, whether microglia morphology and function is perturbed by varied surfaces. The knowledge obtained in the present study may have implications for the fabrication of nanoelectronic devices and the design or improvement of microelectrode arrays for chronic deep-brain microstimulation and recording.21
Materials and methods
Preparation of nanoporous gold (np-Au) monoliths
Preparation of np-Au plates (monoliths) was performed as previously described,6,8,22 with a few modifications. Briefly, 10 carat yellow gold sheets (4.0 inch × 2.0 inch × 0.0098 inch, L × W × H, respectively) were purchased from Hoover and Strong (Richmond, Virginia, USA). The stated atomic composition of this commercial alloy is 41.7% Au, 20.3% Ag, and 38% Cu. Depending on the experiment protocols, the 10 carat sheet was cut into pieces of size of 8.0 mm × 8.0 mm × 0.25 mm, L × W × H, respectively, and placed in a concentrated nitric acid bath for 48 hours (the acid solution was refreshed at the 24 hour time point). Trace metal grade nitric acid was purchased from Fisher Scientific (Pittsburgh, USA). After the nitric acid de-alloying treatment, samples were rinsed thoroughly with Milli-Q water (18.2 MΩ cm resistivity at 25 °C, Millipore Corporation, Boston, USA) to neutral pH, followed by rinsing with HPLC grade ethanol (Sigma Aldrich, St. Louis, Missouri, USA). The microstructure of np-Au was characterized using scanning electron microscopy using a JEOL JSM-6320F field emission SEM (JEOL USA, Inc., California, USA).Fabrication of ultra-thin nanoporous gold (UT np-Au) and ultra-flat gold (UF-Au)
UT np-Au was prepared from commercially available gold/silver leaf (used as received, Sepp Leaf Products, Inc. New York, NY, USA) which was cut into a 2.0 inch × 2.0 inch dimension and floated on a concentrated nitric acid bath for 4 hours. After the nitric acid de-alloying treatment, the acid solution was carefully exchanged with Milli-Q water to neutral pH. The free floating np-Au leaf was then removed by dipping a circular coverslip (1.0 cm diameter), previously coated with polydimethylsiloxane (PDMS) (Dow Corning, USA), underneath the porous gold leaf. As the glass slide was removed, the free-floating leaf adhered smoothly onto the surface of the coverslip. After curing the PDMS pre-polymer in an oven for 3 hours, the sample was rinsed and kept in deionized water. For UF-Au preparation, freshly cleaved ruby muscovite mica was coated with a gold film, 200 nm thick, and glued onto a glass coverslip.16 The UF-Au is acceptable for cell seeding after stripping off from the mica sheet.Scanning electron microscopy analysis
Surface morphology and general structure of np-Au monolith, UF-Au, UT np-Au and glass were studied by SEM using a JEOL JSM-6320F field emission instrument. Microglia plated on substrate surfaces were fixed with 3.5% glutaraldehyde followed by 4% osmium tetroxide. Fixed cell samples were sputter-coated with 50 nm gold using an Anatech LTD instrument and imaged.Energy dispersive X-ray analysis (EDS)
The presence of gold in the acid dealloy substrates was determined with EDS by examination of the spectrum for peaks near 2.13 and 9.71 keV (gold); 2.98 keV (silver); and 0.93 and 8.04 keV (copper). No special preparation of the samples was required for EDS analysis. Five EDS spectra were captured and analyzed from different regions of each type of gold substrate. For comparison, the EDS spectrum was obtained for 10 carat yellow gold sheet and gold/silver leaf prior to acid treatment (ESI, Fig. S1†). All EDS spectra were captured using a Link Pentafet 6886 Model accessory (Oxford Microanalysis Group, UK).Cell culture and stimulation
BV-2 murine microglial cells were cultured in Dulbecco's modified Eagle's medium (DMEM, 4.5 g L−1 glucose) (Hyclone, Thermo Fisher Scientific, Pennsylvania, USA) containing 50 U mL−1 penicillin, 50 μg mL−1 streptomycin, 50 μM β-mercaptoethanol, and 5% fetal bovine serum (FBS, Hyclone).23 For cellular studies, microglia were removed from culture flasks with 0.25% trypsin and seeded at a density of 5 × 10⁵ cells mL−1 onto prepared glass or gold substrates situated in individual wells of a sterile 24-well cell culture plate in growth medium. Prior to cell treatment, medium was replaced with fresh serum-free medium followed by stimulation with ultra-pure lipopolysaccharide (LPS) from E. coli K12 (InvivoGen, San Diego, CA, USA) at a final concentration of 10 ng mL−1 (or otherwise stated). The cells were incubated at 37 °C for 24, 48, or 72 h in 5% CO2 and the medium was collected and stored at −20 °C for subsequent analysis by enzyme-linked immunosorbent assay (ELISA) or for counting of the cells in the medium. The background cellular response was assessed with the same volume of sterile water used as the vehicle for LPS.ELISA analysis
Measurement of microglia-secreted TNFα levels in the medium was determined by ELISA as previously detailed.23 Briefly, 96-well plates were coated overnight with monoclonal anti-mouse TNFα capture antibody, washed with phosphate-buffered saline (PBS) containing 0.05% Tween-20 and blocked with PBS containing 1% BSA, 5% sucrose and 0.05% NaN3 followed by a wash step. Successive treatments with washing in between were done with samples and standards, biotinylated polyclonal anti-mouse TNFα detection antibody in 20 mM Tris with 150 mM NaCl and 0.1% BSA, streptavidin-horseradish peroxidase (HRP) conjugate, and equal volumes of HRP substrates 3,3′,5,5′-tetramethylbenzidine and hydrogen peroxide. The reaction was stopped by the addition of 1% H2SO4 solution. The optical density of each sample was analyzed at 450 nm with a reference reading at 630 nm using a SpectraMax 340 absorbance plate reader (Molecular Devices, Union City, CA, USA). The concentration of TNFα in the experimental samples was calculated from a mouse TNFα standard curve of 15–2000 pg mL−1. When necessary, samples were diluted to fall within the standard curve.XTT cell viability assay
Viability of BV-2 microglia was determined by using an XTT [2,3-bis(2-methoxy-4-nitro-5-sulfophenyl)-2H-tetrazolium-5-carboxanilide] assay as previously described.23 Cellular metabolic activity was monitored by mitochondria-mediated reduction of XTT (Sigma Aldrich, St. Louis, MO, USA). XTT assay was also used in a cell-free manner to rule out the possibility of any bacterial contamination or contribution of the glass or gold substrates to XTT reduction. In the cellular XTT assay, control cells or cells exposed to LPS for 24 h were further incubated with 0.33 mg mL−1 XTT and 8.3 μM phenazine methosulfate (PMS) (Acros, Morris Plains, NJ, USA) in RPMI medium without phenol red for 2 h at 37 °C. The extent of XTT reduction was determined from the absorbance of the reduced form of XTT at 467 nm.LDH release assay
The viability of the BV-2 microglia was also measured by the release of intracellular lactate dehydrogenase (LDH) into the cell medium. The LDH activity assay which involves LDH-mediated reduction of nicotinamide adenine dinucleotide (NAD+), was coupled to XTT reduction to increase sensitivity, in a procedure modified from Korzeniewski et al.24 Briefly, following cell incubation for 24 h in the absence or presence of LPS, the medium was removed and centrifuged to remove any detached microglia. 25 μL conditioned medium was added to a 2![[thin space (1/6-em)]](https://www.rsc.org/images/entities/char_2009.gif) :1 ratio of LDH reaction cocktail and XTT/PMS resulting in final concentrations of 1 mM NAD+, 25 mM lactate and 95 mM CAPS buffer pH 10.0 (all from Sigma Aldrich, St. Louis, MO, USA), 0.33 mg mL−1 XTT and 8.3 μM PMS. The extent of LDH released (LDH activity) was measured by the change in absorbance of reduced XTT at 467 nm over a linear time course of 5 minutes.
:1 ratio of LDH reaction cocktail and XTT/PMS resulting in final concentrations of 1 mM NAD+, 25 mM lactate and 95 mM CAPS buffer pH 10.0 (all from Sigma Aldrich, St. Louis, MO, USA), 0.33 mg mL−1 XTT and 8.3 μM PMS. The extent of LDH released (LDH activity) was measured by the change in absorbance of reduced XTT at 467 nm over a linear time course of 5 minutes.
Cell adhesion and growth
BV-2 microglia were plated overnight and stimulated as described above. After 24 hours of treatment, the medium was removed and the cells in the medium were counted using a Cellometer Auto T4 Plus SK-150 cell counter (Nexcelom Bioscience LLC, Lawrence, MA, USA). The number of cells recovered in the medium was divided by the total number of cells plated to determine the percentage of detached cells, and indirectly, the percentage of cells attached to the glass and gold substrates. The extent of microglia proliferation was determined by direct counting of the adherent cells over time. At each time point, the medium was removed and the adherent cells were detached with 0.25% trypsin and counted as described above.Results
Characterization of gold substrate surfaces
Four substrates, including glass, ultra-flat gold (UF-Au), ultra-thin nanoporous gold (UT np-Au) and nanoporous gold monolith (np-Au), were characterized by SEM. UF-Au substrate was generated using a well-recognized gold deposition technique which produces a 200 nm thick layer of gold on mica that can be subsequently glued to a glass coverslip.16 Stripping off the mica sheet leaves templated gold on glass. For comparison, a glass coverslip was used as a control in this study. Since glass is a poor conductor, approximately 10 nm of gold was sputtered on one side of the glass coverslip in order to enable SEM characterization. SEM images revealed relatively flat and smooth surfaces for the glass and the UF-Au substrate (Fig. 1A and B). In contrast, the corrugated morphology of the np-Au substrate was prepared as previously described.6,8,16 The porous metals, UT np-Au and np-Au, were formed by de-alloying and exhibited a completely irregular morphology for both the metallic gold ligaments and pore channels (Fig. 1C and D). The irregular structure made it difficult to quantitate differences between the gold substrates. However, randomized manual measurements were made using the images in Fig. 1C and D which are representative of numerous samples. These measurements revealed an average ± standard error pore diameter and ligament thickness for UT np-Au of 52.8 ± 2.0 nm (n = 157 measurements) and 51.7 ± 1.5 nm (n = 185 measurements), respectively. Values for the np-Au monolith plate average pore diameter and ligament thickness were 25.1 ± 0.9 nm (n = 228 measurements) and 40.5 ± 1.2 nm (n = 210 measurements), respectively. In addition to the notable pore diameter difference between the two nanoporous gold substrates, another physical difference of these substrates was their thickness (z dimension). From our analysis, the UT np-Au substrate was about 125 nm thick after transfer onto a glass coverslip, while SEM cross-section imaging indicated that the thickness of the np-Au monolith plate was approximately 250 μm.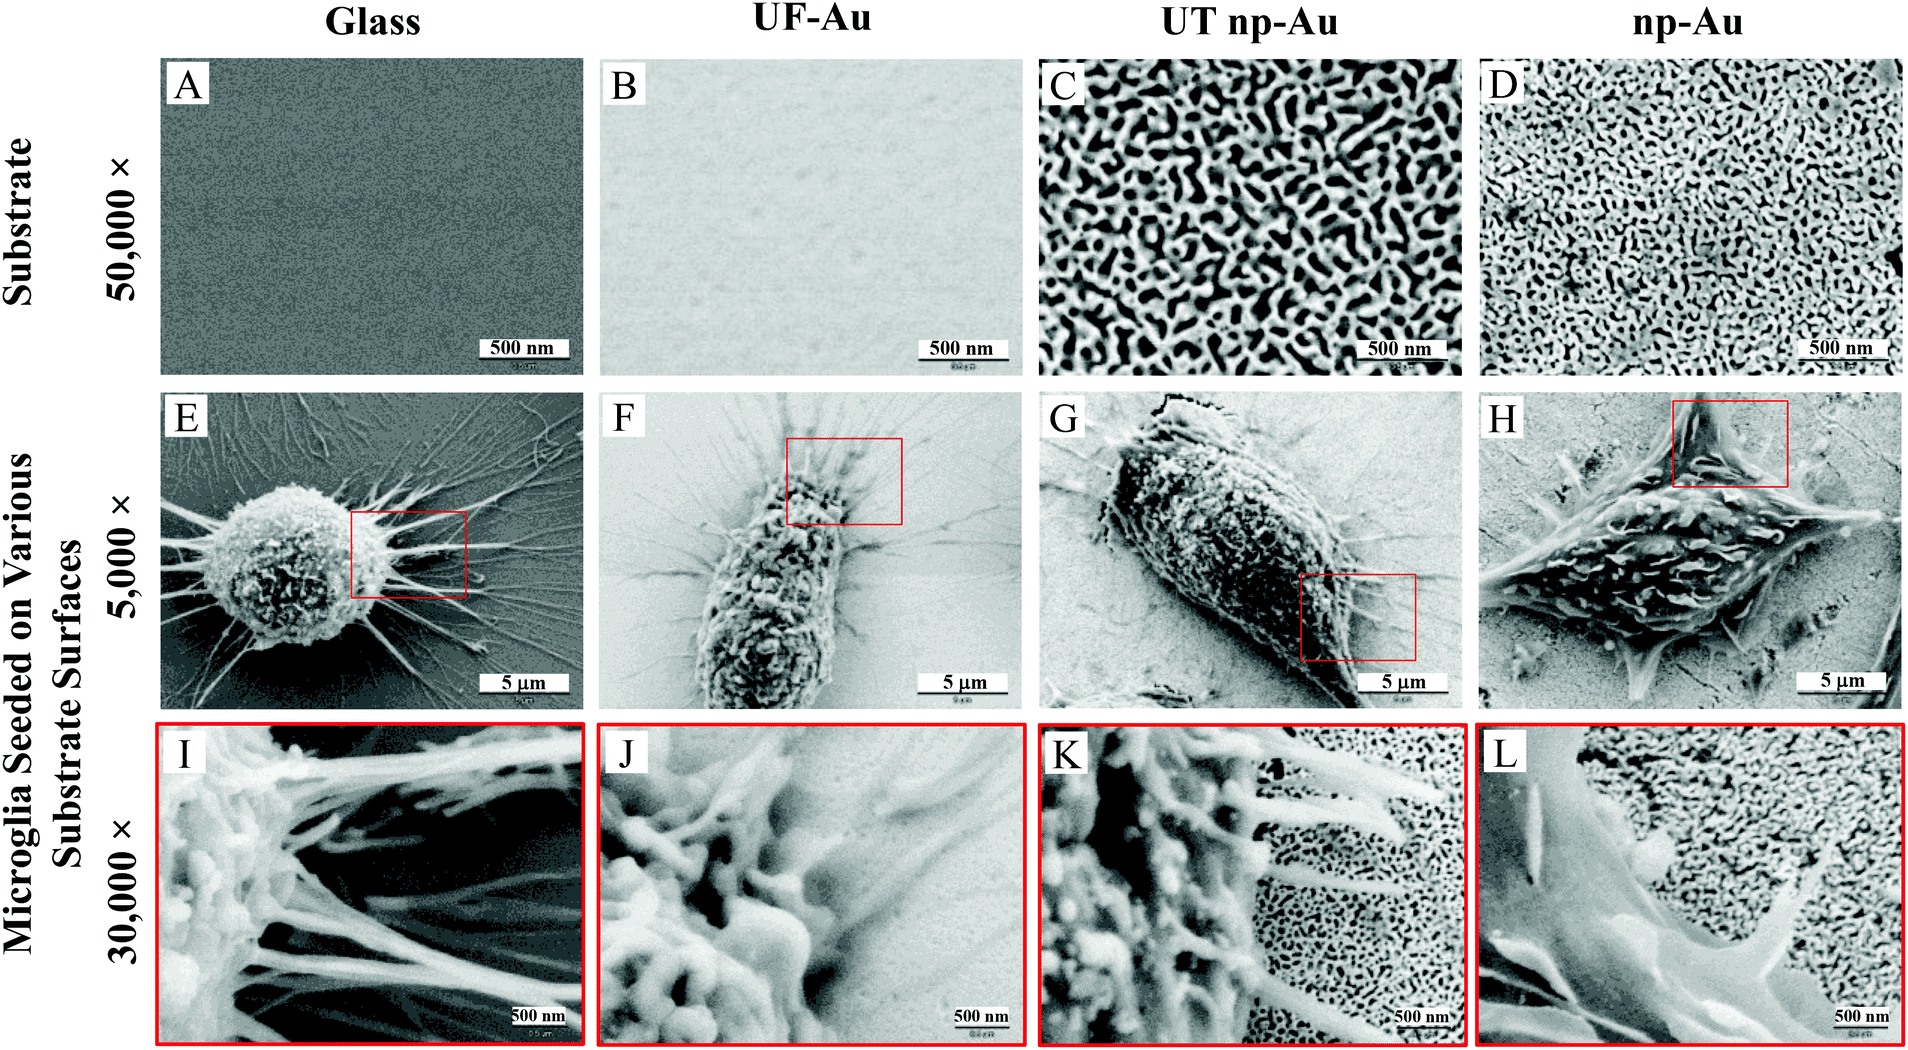 | ||
| Fig. 1 Scanning electron microscopy images of BV-2 murine microglial cells seeded on different substrate surfaces. (A–D) 2.4 μm × 1.8 μm SEM images of blank glass coverslip, UF-Au, UT np-Au and np-Au monolith plates. (E–H) 24.0 μm × 18.0 μm (or 5000× magnification) SEM images of BV-2 microglia adhered on the respective substrate surfaces in the top panel. (I–L) SEM images at 30000× magnification showing major and minor processes of microglia interacting with the substrate surfaces. The red boxes in panels E–H indicate areas that are shown at higher magnification in panels I–L. Presented images are representative of n = 12 images for each condition at each time point over four separate experiments. | ||
Qualitative X-ray analysis of substrate specimens
The nanoporous gold substrates were prepared by acid de-alloying to remove the less noble metals. However, residual amounts of these metals may form metal oxides that could directly affect microglia by impeding their proliferation or viability. The cellular toxicity may occur via interference with the cell's normal metabolic process or metal-induced production of reactive oxygen species causing oxidative stress in cells.25,26 To rule out the presence of high amounts of residual metals remaining after the acid de-alloying process, energy dispersive X-ray spectroscopy (EDS) analysis was conducted to determine the composition of metals (such as, gold, copper and silver) on the gold substrates. This approach is simple and promising because (1) each element has a unique set of peaks in its X-ray spectrum and (2) energy dispersive X-ray analysis, also known as EDX or XEDS, has detection limits of approximately 0.1% in bulk materials.8 Gold is known to be biocompatible but the presence of other metals may yield metal oxides that can damage and kill cells.25,26 If the residual content of the copper or silver is high, then oxidative stress might reduce microglia density on the np-Au substrate. Fig. 2 shows the EDS spectra of the four different substrates used in our investigation. The major peaks near 2.13 and 9.71 keV are the unique set of peaks for gold and are observed for UF-Au (panel B), UT np-Au (panel C), np-Au monolith (panel D) but not glass (panel A). Trace amounts of other metals were noted based on the minor peaks observed at different X-ray energies. A noticeable peak near 0.50 keV (Fig. 2A) is the typical X-ray energy peak for oxygen (0.53 keV) and is due to the oxide compositions (∼64% SiO2) of the glass coverslip. The other peaks in Fig. 2A near 1.04 and 1.74 keV belong to sodium and silicon, respectively. Based on the four X-ray spectra collected, various minute amounts of residual metals were present on these substrate surfaces. The X-ray energy peaks for copper (0.93 and 8.04 keV) and silver (2.98 keV) are insignificant when compared to those of gold. Therefore, the potential for silver or copper oxide toxicity or oxidative stress that may damage cells or prevent their adherence to the np-Au substrate is minimal. EDS spectra for yellow gold and gold foil before the acid de-alloying procedure are provided in Fig. S1.† The prepared and characterized gold surfaces were then examined for their ability to support microglial growth and function.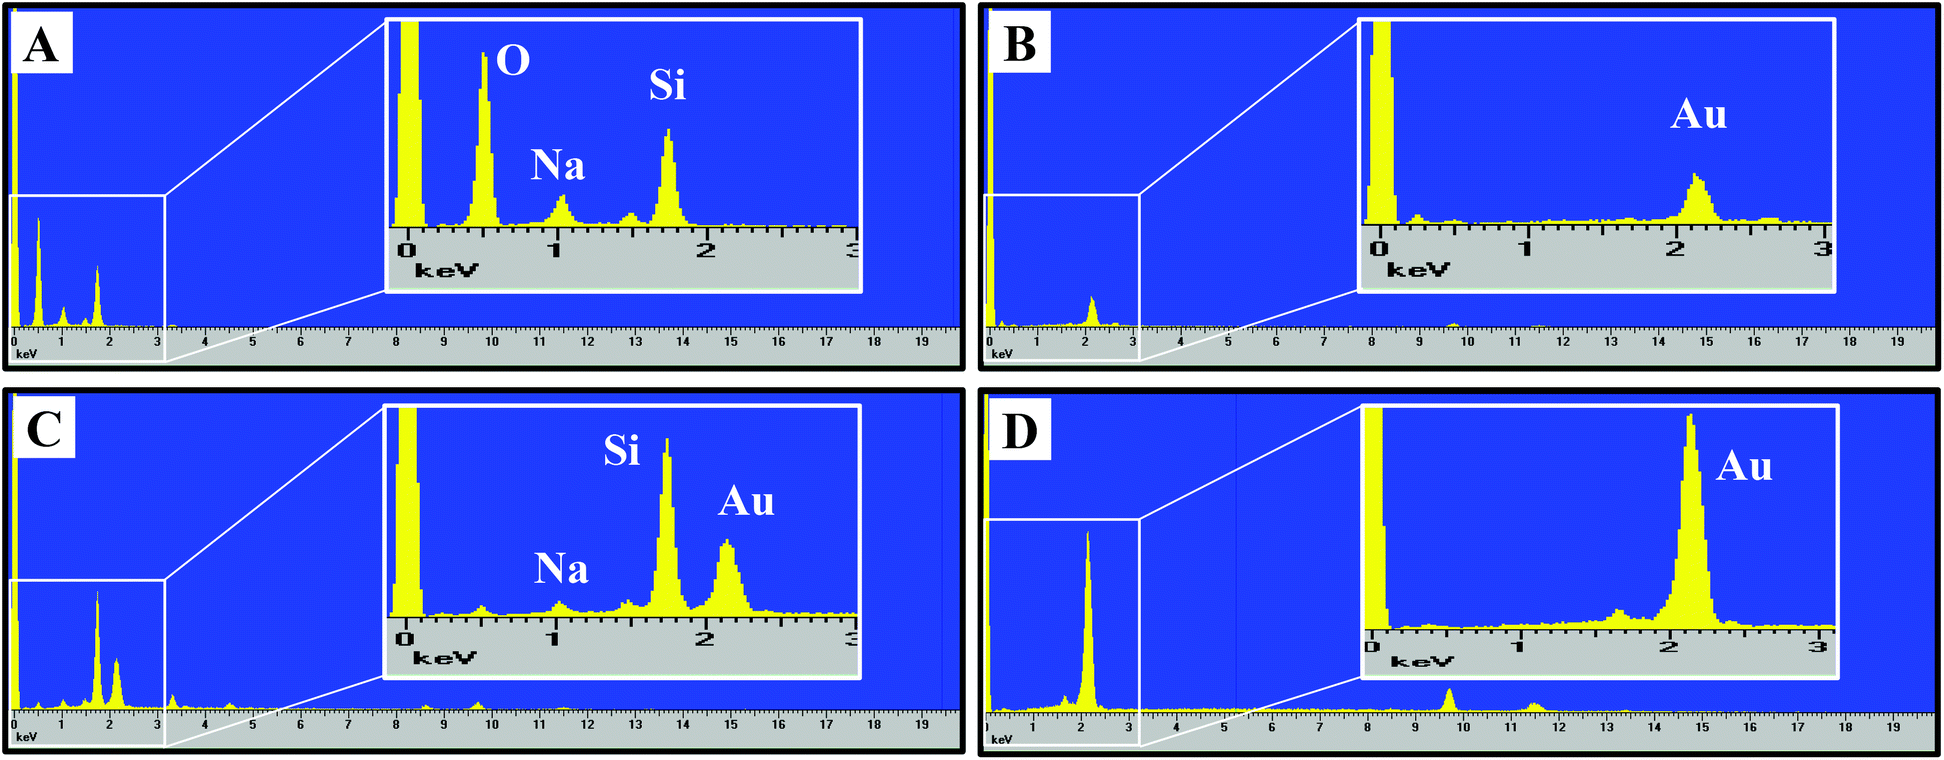 | ||
| Fig. 2 Energy-dispersive X-ray spectra for (A) glass, (B) UF-Au, (C) UT np-Au, (D) np-Au monolith. The K emission lines for O (0.53 keV), Na (1.04 keV) and Si (1.74 keV) were observed for glass. The typical X-ray energy peaks for gold are 2.13 and 9.71 keV. | ||
SEM provided topographical imaging of each material surface. Additionally, this high resolution technique was also used to visually characterize temporal changes in microglial cell morphology and cell–cell interactions. The immortalized BV-2 murine microglial cell line was used in this investigation and the cells were seeded onto the four surfaces as described in the Materials and methods section. Fig. 1E & I, F & J, G & K, and H & L showed microglia cells on glass, UF-Au, UT np-Au and np-Au surfaces, respectively. Since BV-2 microglia are adherent cells, no prior surface modification of these substrates was necessary to artificially assist or improve cell adhesion onto the substrate surfaces. SEM images showed a variety of microglia morphologies including rounded, unipolar, bipolar, and flattened (amoeboid) and all were observed routinely on all four types of substrate surfaces. Microglia on each of the four substrate surfaces tended to exhibit many short and branched processes extending outward from the cell and interacting with neighboring cells and the substrate surfaces. Although major processes were observed on many of the immobilized microglia, we cannot conclude that a distinct, or favored, cell morphology was adopted by microglia for any of the specific types of substrate used. The dimensions of the microglia were between 15–20 μm on the long axis, and 10–15 μm on the short axis and did not appear to be influenced by the type of substrate used as a platform.
Adherence of microglia to the substrate surfaces
The ability of BV-2 microglia to adhere to glass and different gold substrates was determined by quantifying the number of adherent microglia after plating of the cells and overnight incubation at 37 °C in 5% CO2. Microglia adherence was exceptional for glass, UF-Au, and UT np-Au (>94% adherent cells) but somewhat lower for np-Au (83% adherent cells) (Fig. 3). There was no significant statistical difference between glass, UF-Au, and UT np-Au. However, there was a significant difference in microglia adherence between glass and np-Au (p < 0.001).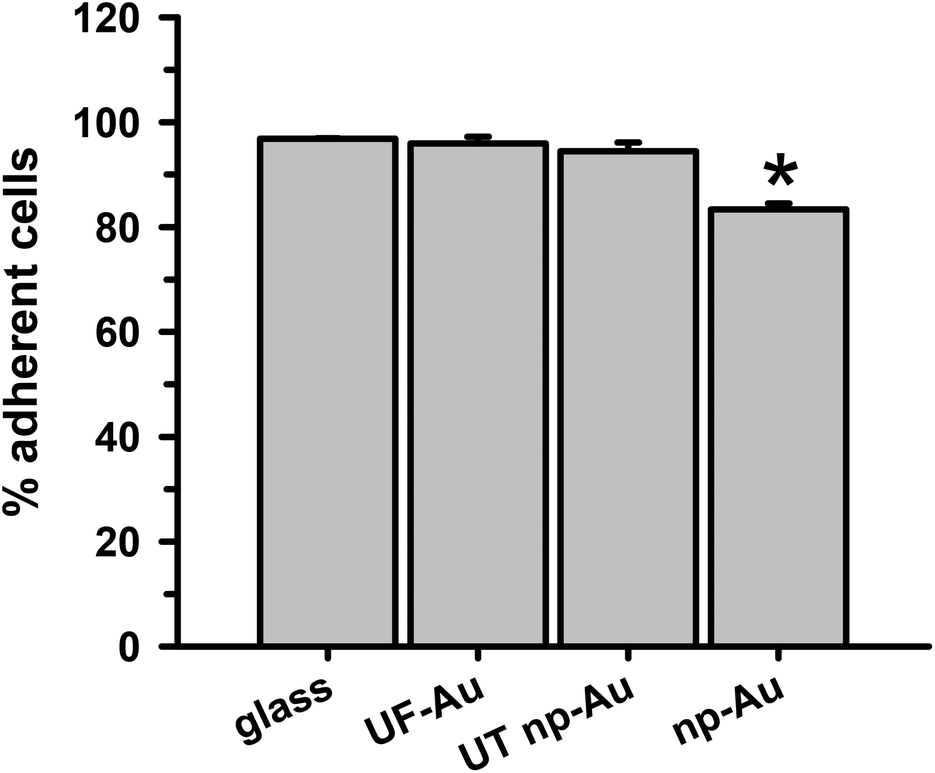 | ||
| Fig. 3 Ability of microglia to adhere to different substrates. BV-2 microglia (2 × 10⁵ cells) were plated on different substrates (n = 4 for each surface) and incubated overnight at 37 °C and 5% CO2 to allow for cell adherence. The number of adherent cells was determined as described in the Methods. Data and error bars represent the mean and std error for n = 4 trials in one experiment. A statistically significant difference, using a student t-test, was found in microglia adherence between glass and np-Au (*p < 0.001). | ||
Viability of BV-2 microglia
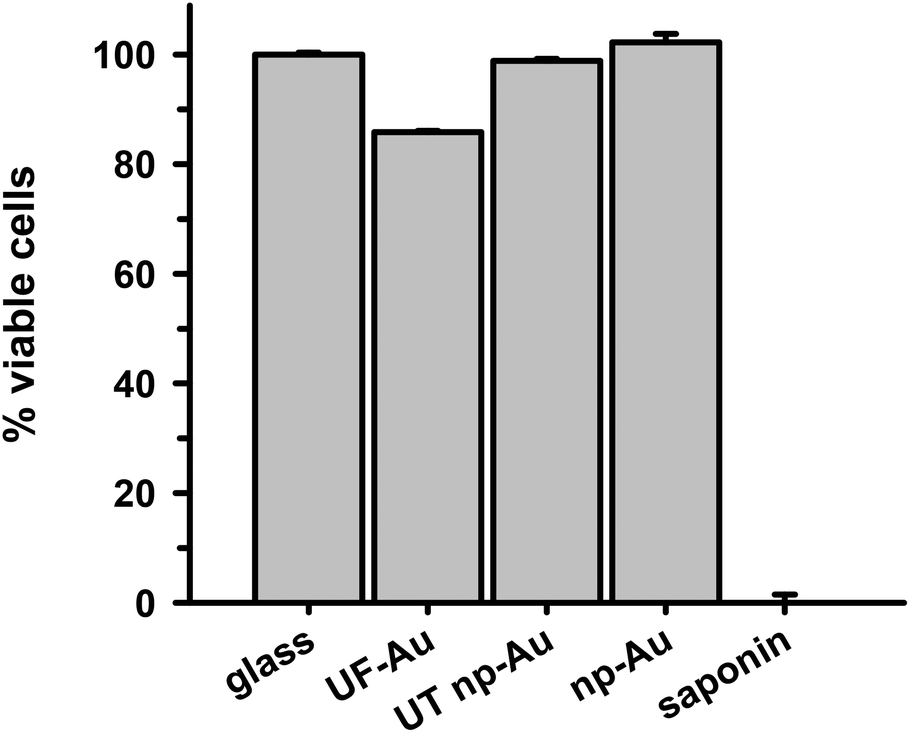
In order to determine whether there were toxic effects of the gold substrates (with various textures) on microglia after surface adherence, the metabolic integrity of the seeded microglia was determined using an XTT cell viability assay. The standard XTT assay relies on mitochondrial-mediated reduction of XTT by nicotinamide adenine dinucleotide (NADH) via trans-plasma membrane electron transport and an electron mediator.27 This approach generates a water-soluble orange-colored reduced formazan product which rapidly dissolves into the medium eliminating the need for additional steps that may interfere with the assay. Since this conversion only occurs in viable cells, the reduced orange formazan solution can be quantified spectrophotometrically (absorbance at 467 nm). Microglia attached to glass, UF-Au, and UT np-Au were comparable in their viability (similar production of reduced XTT) (Fig. 4) and very little toxicity was observed. However, cells incubated on np-Au were significantly restricted in their ability to metabolize and reduce XTT. Control (cell-free) wells containing each substrate and XTT showed the background levels of reduced XTT for each sample (Fig. S2†). All of the cell-free substrates showed insignificant absorbance (reduced XTT) when compared to substrate platforms with microglia present. This was expected, as the blank substrates used in this investigation are not known to react or cause reduction of XTT. The low absorbance observed for the microglia on np-Au monolith was rather unexpected since the np-Au monolith contains a similar porous morphology as the UT np-Au substrate (Fig. 1). The cell viability data indicated that the microglia on np-Au monolith were metabolically compromised despite the earlier findings of morphological normality and sufficient adherence of the microglia on np-Au (Fig. 1 and 3). However, it is also possible that the thickness of the np-Au monolith interfered with the production or detection of reduced XTT. Although gold is known for its inertness, either flat or in the presence of variable porosity, this scenario was possible due to the lower levels of background reduced XTT observed for the np-Au control compared to the other substrates (Fig. S2†). | ||
| Fig. 4 Analysis of microglia viability by XTT assay. BV-2 microglia (2 × 10⁵ cells) were plated overnight to allow cell adherence followed by incubation for 24 h at 37 °C in 5% CO2. The medium was removed and cell viability was assessed using a XTT assay as described in the Methods. Reduced XTT absorbance was measured at 467 nm. % cell viability was determined by comparing metabolism of reduced XTT by microglia on UF-Au, UT np-Au, and np-Au to microglia on glass. Data and error bars represent the mean and std error for n = 12 measurements for each condition over two separate experiments. A statistically significant difference was found in microglia viability between glass and np-Au (*p < 0.001). The other data points were not statistically different from each other. | ||
An alternative analysis of cell viability was used to further probe the viability of microglia on the np-Au monolith substrate. A lactate dehydrogenase (LDH) release assay was used to validate the XTT analysis. The presence of LDH activity in the medium is a general indicator of the leakage of intracellular LDH from the cells due to disruption or damage of the membrane integrity. Following incubation of microglia with the various substrates, the cell culture media was collected, centrifuged and the cell free supernatant examined for LDH activity (Fig. 5). Minimal LDH activity was observed in the microglia medium after incubation with all four substrates (Fig. 5). In particular, the np-Au substrate did not elicit LDH release from the adherent microglia indicating that the np-Au monolith was not toxic to microglia. Saponin, a known cellular toxin via cholesterol removal and membrane integrity disruption, caused significant LDH release from microglia cultured on glass and served as a positive toxicity control in these experiments (Fig. 5).
 | ||
| Fig. 5 Cell cytotoxicity determined by LDH release assay. BV-2 microglia (2 × 10⁵ cells) were plated overnight on the four substrate surfaces to allow adherence and then incubated for 24 h as described in the Materials and methods section. Conditioned medium was collected for each sample and analyzed for LDH activity (absorbance per min) as described. The levels of LDH activity in the conditioned medium from untreated or saponin-treated microglia on glass were used as 100% or 0% viability controls respectively. % cell viability for the other samples was determined by comparing LDH activity to the viability controls. Data and error bars represent the mean and std error for n = 3 measurements in one experiment for all conditions. | ||
Microglia proliferation on substrate surfaces
Cell survival and proliferation are important criteria for substrate biocompatibility. In addition to morphology and toxicity, the four substrates used in our investigation were evaluated for their ability to support cell growth and proliferation. Time dependent studies of microglia seeded onto the four substrate surfaces were carried out at 24, 48 and 72 h (Fig. 6). Quantification of cell density on these surfaces over time indicated that the number of adherent microglia progressively increased on the flat substrate surfaces, such as glass and UF-Au. Microglia density more than doubled from the initial number of seeded cells on the flat surfaces (circles, triangles, Fig. 6). An increase in microglia density was also observed on the UT np-Au substrate (squares, Fig. 6) at the 48 h time point; however, microglia density leveled off after that. The density of microglia cultured on np-Au (diamonds, Fig. 6) after 24 hours of seeding was slightly less than the number of cells plated (dashed line, Fig. 6) and did not increase or decrease over time. The difference in microglia growth was particularly striking at 48 h between np-Au and the other substrates. The additional observation that continued growth on UT np-Au was also hampered suggested that the texture had a negative effect on the process of cell division. To ensure consistency in the given experiment, all microglial proliferation studies were carried out simultaneously and similar observation were attained with repeated experiments. The inability of the microglia to grow or proliferate on the texturized np-Au surface helped to explain the contradiction between the earlier XTT and LDH release toxicity results in Fig. 4 and 5. Since the XTT assay was conducted after overnight plating and an additional 24 h incubation, the number of microglia was significantly lower on the np-Au compared to the other substrates. The disparity in microglia cell number explained the notably lower reduced XTT absorbance values for np-Au in Fig. 4.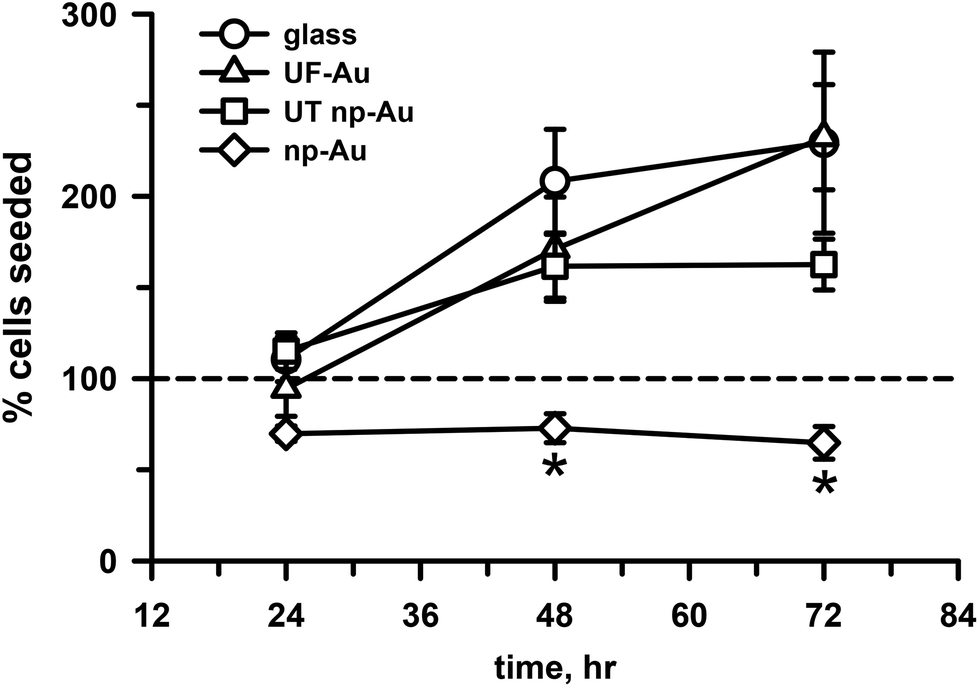 | ||
| Fig. 6 Microglia density on different substrate surfaces. BV-2 microglia (2 × 10⁵ cells, dashed line) were plated and allowed to grow at 37 °C and 5% CO2 on glass (circles), UF-Au (triangles), UT np-Au (squares), and np-Au (diamonds) substrates. Cell number was quantified as described in the Materials and methods section at 24, 48, and 72 h. Data points and error bars represent the mean and std error for n = 7 measurements for each condition and time point from two separate experiments. Statistical analysis was performed using a student t-test and significant differences in microglia density were observed between np-Au and the other samples at both 48 and 72 h (*p < 0.001). The other data points were not statistically different from each other. | ||
Microglia morphology upon LPS challenge
LPS, a bacterial-derived endotoxin, is a potent immune system stimulant and the most commonly used trigger for inducing microglial activation.23,28,29 In this investigation, a time-dependent morphological examination of LPS-stimulated microglia on glass and gold surfaces was carried out. Microglia immobilized onto glass, UF-Au, UT np-Au, and np-Au were challenged with 10 ng mL−1 LPS or control vehicle and imaged using high-resolution (2000× magnification) SEM after glutaraldehyde fixation at 0, 2, 6, 10 and 24 hour time points (Fig. 7A). Data for 2 and 10 h time points is not shown. The most frequently observed morphologies again included rounded, unipolar, bipolar, and flattened (amoeboid) shapes. In general, the outer surface morphology of the microglia was generally observed as having rough protrusive structures, such as filopodia, lamellipodia, and surface ruffles. Furthermore, most of the microglia contained many long and short processes (5 μm to 30 μm in length) projecting out of the cell body. Additionally, some cells contained a major process extending from one end of the microglial pole (unipolar), while other microglia had two major processes extending or stretching from two opposite ends of the microglial poles (bipolar) (Fig. 7A). The length of these major processes varied from cell to cell with some of the longest axis extending 20 μm or more. One common, but striking, observation during SEM acquisition was the direct interactions between extended major and minor processes of neighboring microglia. These connecting microglia processes appeared to form conjoining junctions. A global analysis of microglia morphologies was conducted on lower-resolution SEM images to determine the effect of both surface composition and LPS treatment on microglia morphology. A representative image is shown in Fig. S3† along with a description of how the analysis was conducted. The population of rounded, unipolar, bipolar, and flattened microglia states at 24 h was analyzed in the absence or presence of LPS and this distribution is shown in Fig. 7B. By far, the most common microglia morphology was rounded, ranging from 70–85% of the total number of microglia. Varying amounts of the other three populations were observed but a consistent trend was not seen indicating that the four surfaces did not induce cell morphological changes. Furthermore, the morphology of the microglia after 10 ng mL−1 LPS challenge did not appear dramatically different compared to unstimulated microglia under the same culture conditions (Fig. 7A, B). However, a slight increase in non-rounded morphologies was noted in the LPS-treated microglia. In a separate experiment, a higher concentration of LPS (100 ng mL−1) was used to treat microglia on the different surfaces and microglia morphology was compared to both untreated and 10 ng mL−1 LPS-treated cells. Fig. S4† shows a similar distribution to that in Fig. 7B for the lower LPS concentration with only small differences observed at the higher LPS concentration (Fig. S4†).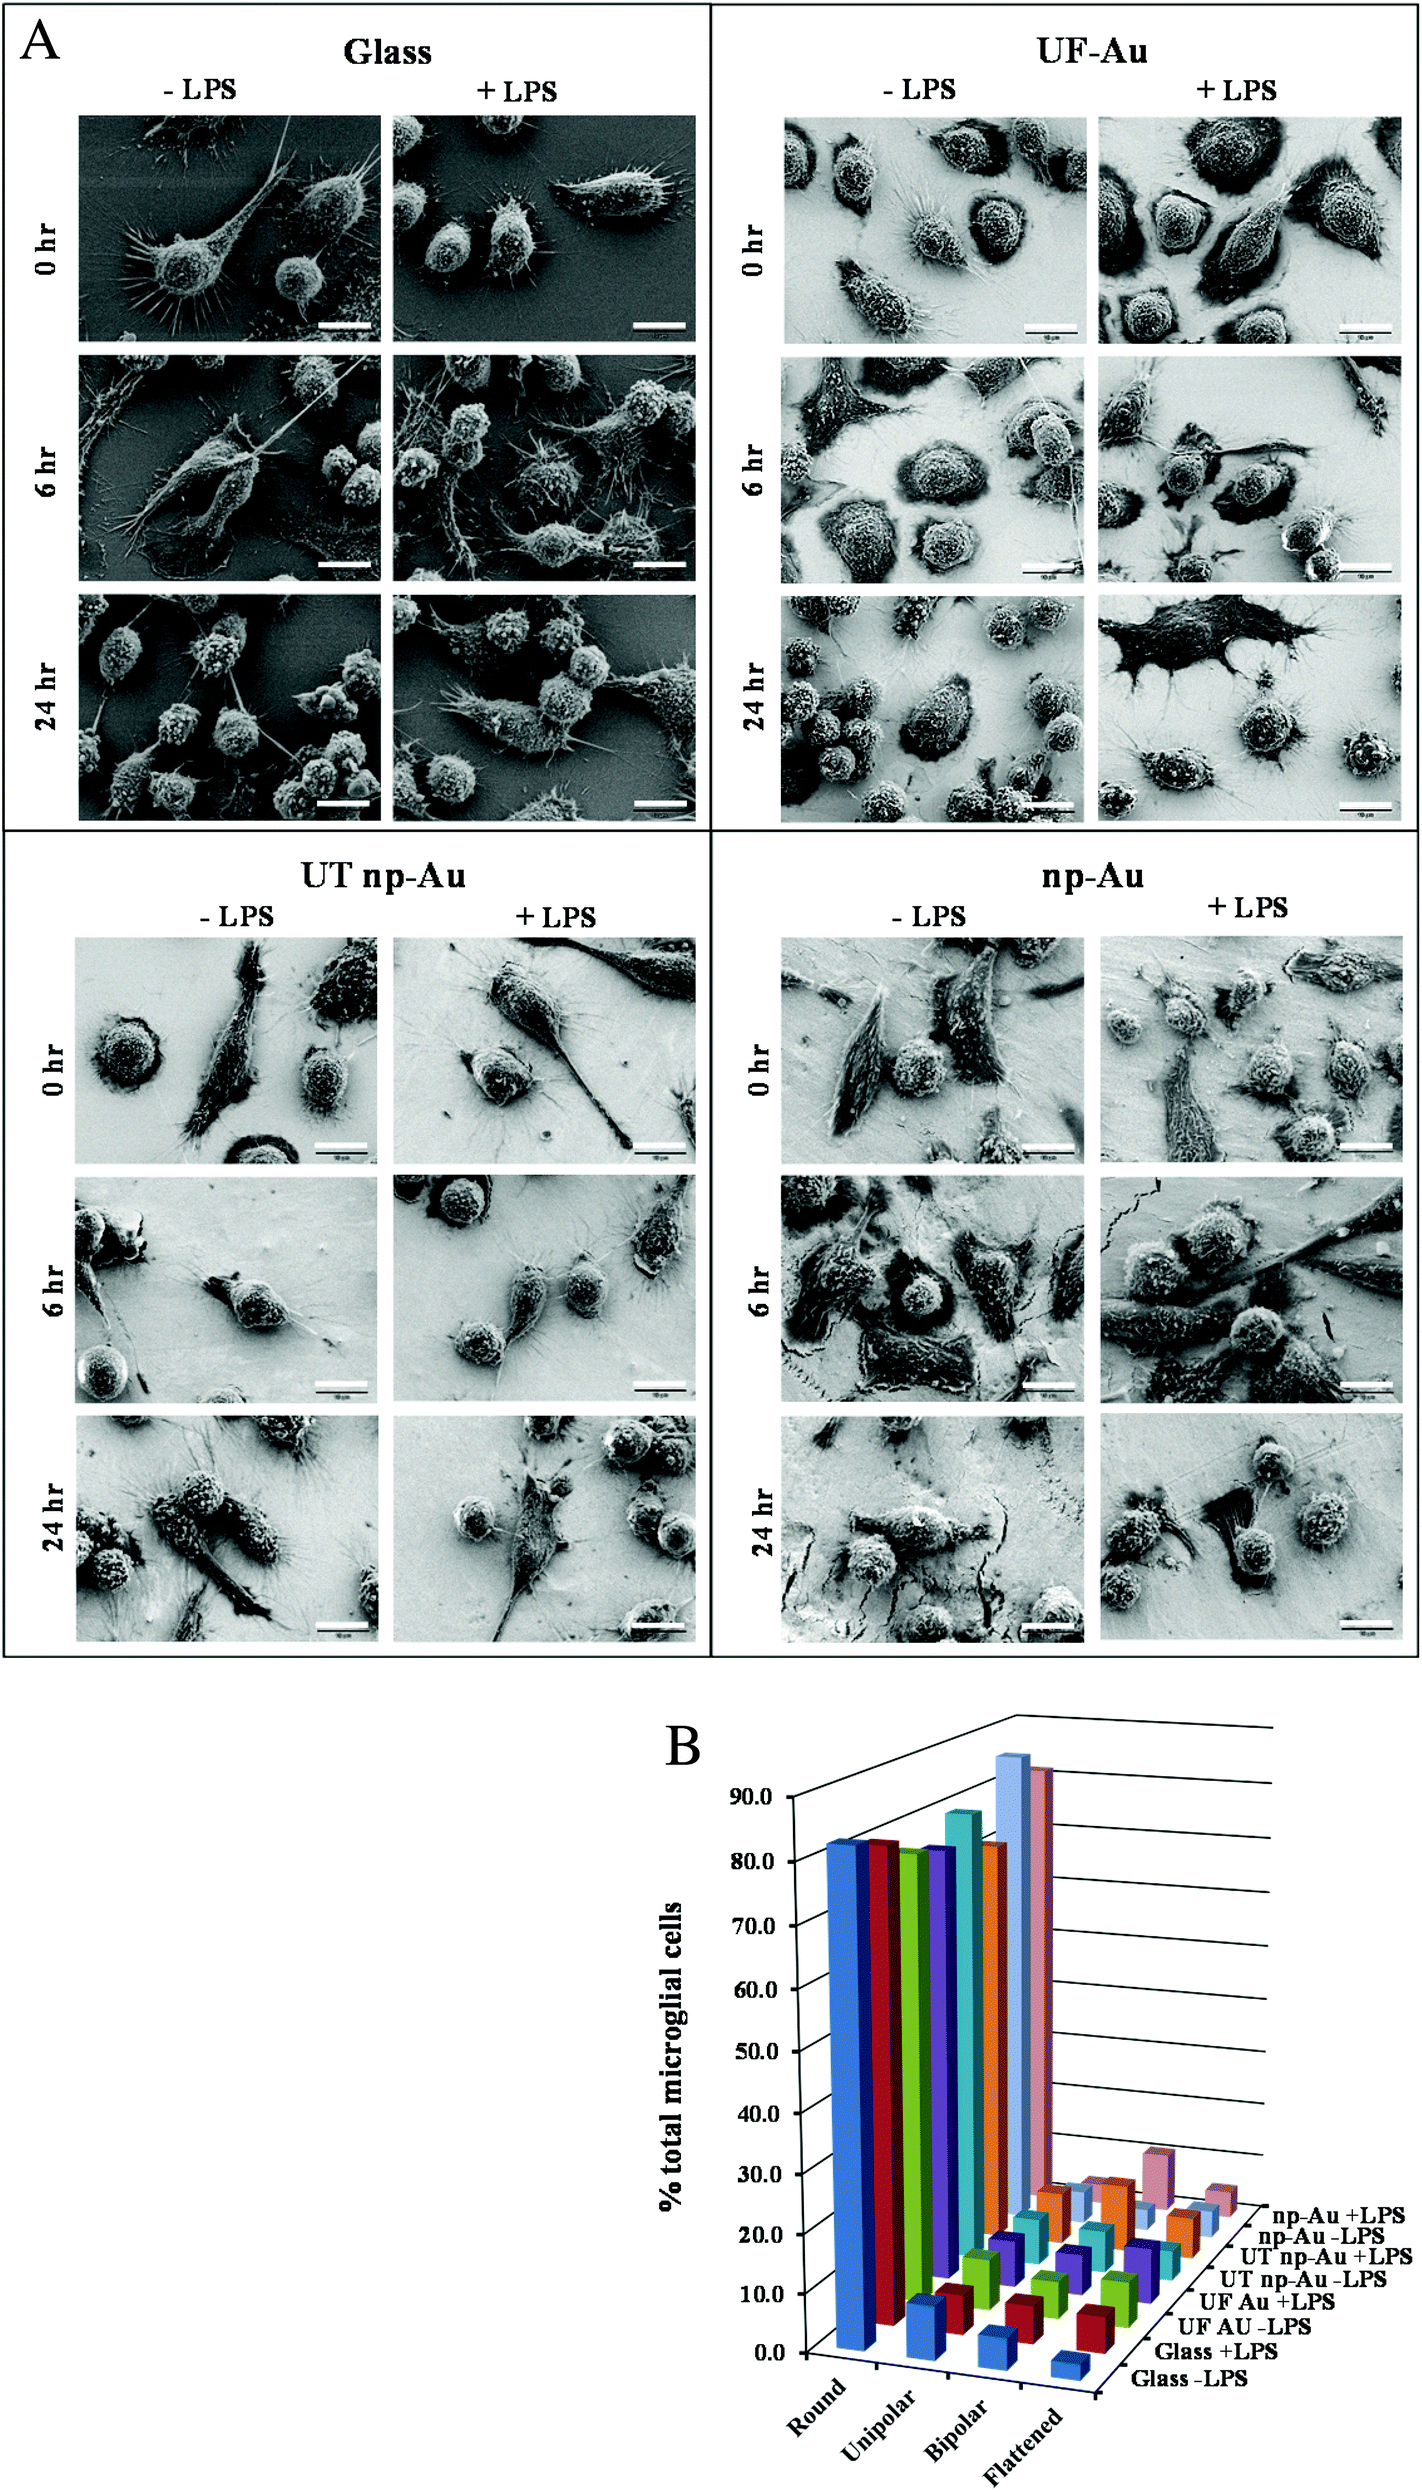 | ||
| Fig. 7 Microglia morphology on different substrate surfaces with and without challenge by LPS (10 ng mL−1). Panel A. BV-2 microglia were allowed to adhere to glass, UF-Au, UT np-Au and np-Au monolith followed by LPS exposure for 0, 2, 6, 10 and 24 h. At each time point the samples were prepared for SEM imaging as described in the Materials and methods section. Images were captured at an accelerating voltage of 5 kV. Data for 2 and 10 hour time points are not shown for space reasons. All images are 58 μm × 43 μm in size (2000× magnification) and the scale bar is equal to 10 μm. Presented images are representative of n = 12 images for each condition at each time point over four separate experiments. Panel B. Distribution of microglia morphologies on glass, UF-Au, UT np-Au and np-Au monolith in the absence or presence of LPS were analyzed as described in Fig. S3† using lower-resolution SEM images (250× magnification). Four distinct shapes were categorized and depicted in the above plot. Data bars represent the average of six image analyses from two separate experiments. Standard error values are provided in Table S1† in the supplementary material. The percentage of microglia displaying each morphology was determined by dividing the counted number for each by the total number of microglia representing all four shapes in the image. Average total microglia for each condition were glass (−LPS), 424, glass (+LPS), 427, UF-Au (−LPS), 435, UF-Au (+LPS), 268, UT np-Au (−LPS), 316, UT np-Au (+LPS), 282, np-Au (−LPS), 300, and np-Au (+LPS), 306. | ||
Additional studies were done to assess the adherence and viability of LPS-stimulated microglia on glass and gold substrate surfaces. These experiments were conducted in the same manner as those presented in Fig. 3–5 using adherence, XTT, and LDH release assays. No differences were observed in microglia adherence or vulnerability to the glass and gold surfaces between unstimulated and LPS-stimulated microglia (data not shown). The results for LPS-stimulated microglia mirrored those for control microglia in Fig. 3–5 within statistical error.
Cytokine release from microglia on the substrate surfaces
TNFα is a well-documented pleiotropic proinflammatory cytokine and can be produced in the central nervous system by activated microglia and astrocytes during the inflammatory response.30 It is well-established that LPS infection induces microglial production of TNFα along with other proinflammatory cytokines interleukin (IL)-1 and IL-6. We, and others, have assessed the level of microglial activation based on the amount of TNFα production23,31 and we used it here as a primary marker of the microglia inflammatory response to LPS. In order to determine if microglia adherence to texturized gold surfaces had an impact on microglia function, seeded microglia on glass, UF-Au, UT np-Au and np-Au substrates were stimulated with LPS (10 ng mL−1) for 24 hours and the levels of secreted TNFα were measured. This analysis revealed comparable levels of TNFα production by microglia among the four substrate surfaces studied (Fig. 8). The findings indicated that these surfaces did not markedly alter microglial cytokine production and were biocompatible with microglia proinflammatory studies. The negligible TNFα production observed for the unstimulated microglia demonstrated that the substrates alone do not elicit a microglial TNFα response. Therefore, microglial TNFα production is solely caused by LPS stimulation without any interference from the substrates themselves. The ability of microglia to retain their normal specific response to LPS stimulation on glass and both flat and texturized gold surfaces was a good indicator of biocompatibility for functional microglial assays.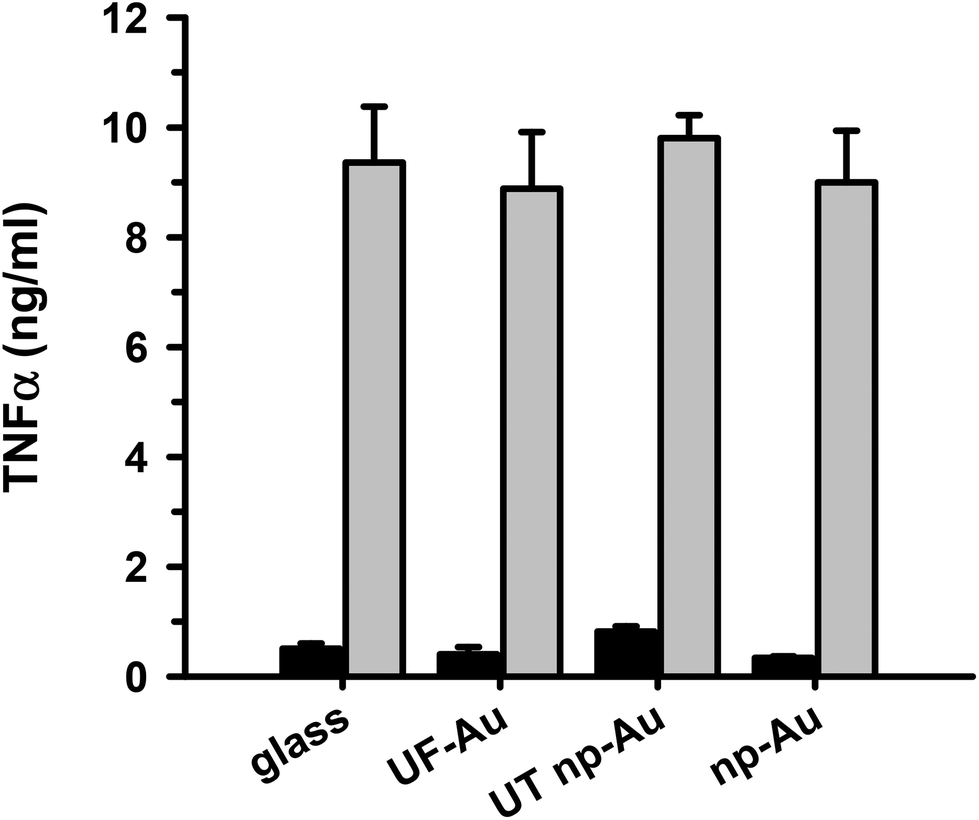 | ||
| Fig. 8 Microglial inflammatory response upon LPS challenge. BV-2 microglia were allowed to adhere to the substrate surfaces overnight, treated with 10 ng mL−1 final concentration of LPS or the same volume of sterile water and incubated for 24 h at 37 °C and 5% CO2. Subsequently, the supernatant was collected and analyzed for secreted TNFα by ELISA. The black bars are unstimulated control microglia and the gray bars are microglia stimulated with LPS. Values and error bars represent the mean and std error for n = 6 measurements for each condition over two separate experiments. | ||
Discussion
The present study describes the general morphology of BV-2 murine microglia cultured on different gold substrate surfaces. UF-Au, UT np-Au, and np-Au substrates were prepared to investigate their biocompatibility with microglia. SEM provided high resolution images of microglia morphologies and allowed detailed visualization of classic rounded, elongated, unipolar and bipolar microglial shapes along with numerous short and branched processes projecting outward of the cell body. These processes varied in length from 5 μm to 30 μm, although some major processes were many times the length of a cell body. The in vitro studies demonstrated that microglia were able to adhere to flat glass and gold surfaces as well as texturized gold surfaces, albeit with slightly less avidity to np-Au. The gold surfaces, even the highly grooved UF np-Au and np-Au monolith, were not toxic to microglia and did not interfere with LPS-induced TNFα production suggesting good biocompatibility for microglial functional and morphological studies.The use of flat gold as a substrate platform for cell culture has been widely reported in the literature due to its known biocompatibility,18,19 ease of modification with alkanethiolate self-assembled monolayers7 and with tailored self-assembled monolayer-based micropatterned arrays for controlling protein adsorption and cell adhesion.4,7 Furthermore, a variety of gold-based compounds have been investigated for their interaction with immune cells. A recent report by Hutter et al. in 2010 demonstrated the uptake of gold nanoparticles (spheres, rods, or urchin geometries) and microglial activation in vivo, via bioluminescence imaging. In their study using transgenic mice, they demonstrated that the geometry of the nanoparticle (especially the rod and urchin shaped) can influence microglial activation and that the urchin shaped nanoparticles are preferentially taken up by microglia.15 In this same report, in vitro studies with microglia demonstrated that gold nanoparticles stimulated several proinflammatory molecules including granulocyte macrophage colony-stimulating factor, IL-1α, and nitric oxide, but not TNFα. In the current study, the gold surfaces alone did not stimulate microglial TNFα production although other proinflammatory molecules were not measured. However our studies investigated gold macro-surface effects which would not have involved particle internalization and activation of uptake signaling pathways. In 2012, Seker et al. presented the first effort to utilize the high surface-to-volume ratio of np-Au (compared to flat gold) as a potential platform for culturing adherent astrocyte cells and investigated its feasibility for application as a drug delivery platform.5 They used an anti-mitotic drug cocktail known to reduce cellular growth (in a dose-dependent manner) to evaluate the performance of the material for drug release and efficient suppression of astrocyte proliferation. Their result indicated that the porous surfaces were minimally fouled by either the adherent astrocytes or the cell culture media, rendering it a prospective material favorable for sustained drug delivery.5
Microglia, the phagocytes of the brain, are known to respond to a myriad of cues (soluble and insoluble) in their physical environment (temperature, pressure, stiffness property of the substrate). Many of these cues induce microglial migration towards sites of damage or injury in the central nervous system. A recent study by Persheyev et al. indicated that BV-2 microglial morphology can be greatly impacted upon interaction with nanoparticles that possess micro-protrusions. The specific protrusions were in the form of either sharp, homogeneous cones or spikes on a textured substrate prepared using hydrogenated amorphous silicon (a-Si:H).32 The features on the texturized a-Si:H film in the range of 0.30–2.6 μm greatly impacted the overall cell morphology and the actin cytoskeleton with the most significant effects observed when the micro-protrusions were in the range of 0.90–2.6 μm. The low impact of the flat and texturized gold surfaces on microglia morphology in our study may be because the gold pores and ligaments are significantly smaller than the reported dimensions in Persheyev et al. However the presence of pores and the discontinuous gold area may hinder the formation of the needed focal adhesion sites for cell adhesion. Yarmush and colleagues found that shorter processes were observed when astrocytes were cultured on porous gold surfaces compared to non-porous surfaces.5 They suggested that the presence of “nanopits” in the nanoporous gold substrate may accommodate only a limited number of focal adhesion sites compared to the non-porous gold substrates, thereby reducing cellular spreading.
The use of SEM at high resolution revealed very little distinction in microglia morphology whether they were cultured on UF-Au, UT np-Au or np-Au. These observations may be due to minimal disruption of integrin clustering, resulting in negligible alteration of the microglial shapes by these surfaces. However, it has been reported that nanotopography or RGD ligand spacing can greatly impact the focal adhesion of these cells on the surface.3,32 The ideal spacing of ∼70 nm between the neighboring features or ligands can effectively promote integrin clustering, leading to the formation of focal adhesion complexes and the F-actin network.3 A larger separation distance of the neighboring features or ligands tend to disrupt the integrin clustering and dramatically influence cell adhesion quality and dynamic cell behaviors. In the case of the np-Au substrate, the corrugated surface contains both irregular ligaments and pores. The lack of a continuous smooth surface and the presence of these gold surface features (pores and ligaments) may not impact the exterior morphology of the microglia, but might directly affect the quality of focal adhesion or the number of focal adhesion sites. However, microglia adhesion to UT np-Au was not hampered and only slightly affected by np-Au (∼14%).
The UT np-Au and np-Au substrates were biocompatible with cultured microglia in most of our assays except for cell growth or proliferation. UT np-Au was supportive of microglia proliferation during the first 48 h but did not sustain growth at subsequent times. Microglial growth was completely absent on the texturized np-Au surface which is consistent with a previous observation reported by Leung et al. in 2008.20 In that study, antiserum against CD11b was used to label endogenous microglia and macrophages from the retrieved implanted electrode from rats’ brain. A higher number of adherent microglia were observed on the smooth side of the electrode compared to the recording site side, which was composed of grooved structures, and the number of cells decreased with the implantation time. The greatly diminished microglia growth on the np-Au monolith surface may be due to several physical properties of the gold that reduce diffusion of cell culture medium and CO2. These include a smaller pore size than UT np-Au (25 nm vs. 53 nm) and much greater overall thickness compared to UT np-Au (∼250 μm vs. ∼125 nm). Surface roughness may play a role as well. This property has been well-documented for glass and UF-Au by atomic force microscopy (AFM) with root-mean-square roughness values of 0.245 nm and 0.2–0.3 nm respectively.33,34 Stine and colleagues have extensively characterized np-Au monoliths8 which have a greater degree and variability of surface roughness (30–40 nm, data not shown). Furthermore, they have demonstrated that np-Au monoliths are open-ended mesoporous materials by (1) AFM characterization of the np-Au exterior and interior continuous porous structure,8 (2) successful immobilization of proteins within the np-Au structure using a flow-through approach,35 and (3) quantification of the surface area and pore volume of np-Au using nitrogen adsorption/desorption isotherms and Brunauer, Emmett, and Teller (BET) and Barrett–Joyner–Halenda (BJH) analysis.36 However, even with flow-through permitted by the np-Au monolith there may be some nutrient restrictions compared to the much thinner UT np-Au material.
Conclusions
The findings from this study demonstrated that np-Au as a microglial cell culture platform was metabolically non-toxic, non-disruptive to cell membranes, and compatible with microglia functional assays, but did not support microglial growth. UT np-Au, however did support microglia growth and matched the other characteristics of np-Au. These materials may have potential as effective substrates for coating or constructing nanoelectronic devices, biosensors, and functional biomaterial coatings for drug delivery.Abbreviations
| EDS | Energy dispersive X-ray spectroscopy |
| LPS | Lipopolysaccharide |
| SEM | Scanning electron microscopy |
| TNFα | Tumor necrosis factor α |
Conflict of interest
The authors declare that they have no conflict of interest.Acknowledgements
This work was supported by Award Number R15AG033913 from the National Institute on Aging (MRN).References
- Y. Zhong and R. V. Bellamkonda, J. R. Soc., Interface, 2008, 5, 957–975 CrossRef CAS PubMed.
- A. I. Teixeira, G. A. Abrams, P. J. Bertics, C. J. Murphy and P. F. Nealey, J. Cell Sci., 2003, 116, 1881–1892 CrossRef CAS PubMed.
- J. Huang and J. Ding, Soft Matter, 2010, 6, 3395–3401 RSC.
- M. Mrksich and G. M. Whitesides, Annu. Rev. Biophys. Biomol. Struct., 1996, 25, 55–78 CrossRef CAS PubMed.
- E. Seker, Y. Berdichevsky, K. J. Staley and M. L. Yarmush, Adv. Healthcare Mater., 2012, 1, 172–176 CrossRef CAS PubMed.
- O. V. Shulga, K. Jefferson, A. R. Khan, V. T. D'Souza, J. Liu, A. V. Demchenko and K. J. Stine, Chem. Mater., 2007, 19, 3902–3911 CrossRef CAS PubMed.
- Y. H. Tan, M. Liu, B. Nolting, J. G. Go, J. Gervay-Hague and G.-y. Liu, ACS Nano, 2008, 2, 2374–2384 CrossRef CAS PubMed.
- Y. H. Tan, J. Schallom, N. V. Ganesh, K. Fujikawa, A. V. Demchenko and K. J. Stine, Nanoscale, 2011, 3, 3395–3407 RSC.
- M. Mrksich, Acta Biomater., 2009, 5, 832–841 CrossRef CAS PubMed.
- T. H. Park and M. L. Shuler, Biotechnol. Prog., 2003, 19, 243–253 CrossRef CAS PubMed.
- M. Nikkhah, F. Edalat, S. Manoucheri and A. Khademhosseini, Biomaterials, 2012, 33, 5230–5246 CrossRef CAS PubMed.
- H. Jans and Q. Huo, Chem. Soc. Rev., 2012, 41, 2849–2866 RSC.
- E. C. Dreaden, A. M. Alkilany, X. Huang, C. J. Murphy and M. A. El-Sayed, Chem. Soc. Rev., 2012, 41, 2740–2779 RSC.
- R. A. Sperling, P. Rivera Gil, F. Zhang, M. Zanella and W. J. Parak, Chem. Soc. Rev., 2008, 37, 1896–1908 RSC.
- E. Hutter, S. Boridy, S. Labrecque, M. Lalancette-Hébert, J. Kriz, F. M. Winnik and D. Maysinger, ACS Nano, 2010, 4, 2595–2606 CrossRef CAS PubMed.
- B. Pandey, Y. H. Tan, K. Fujikawa, A. V. Demchenko and K. J. Stine, J. Carbohydr. Chem., 2012, 31, 466–503 CrossRef CAS PubMed.
- A. Wittstock, V. Zielasek, J. Biener, C. M. Friend and M. Bäumer, Science, 2010, 327, 319–322 CrossRef CAS PubMed.
- G. Voskerician, M. S. Shive, R. S. Shawgo, H. v. Recum, J. M. Anderson, M. J. Cima and R. Langer, Biomaterials, 2003, 24, 1959–1967 CrossRef CAS PubMed.
- J. Wegener, C. R. Keese and I. Giaever, Exp. Cell Res., 2000, 259, 158–166 CrossRef CAS PubMed.
- B. K. Leung, R. Biran, C. J. Underwood and P. A. Tresco, Biomaterials, 2008, 29, 3289–3297 CrossRef CAS PubMed.
- P. S. Motta and J. W. Judy, IEEE Trans. Biomed. Eng., 2005, 52, 923–933 CrossRef PubMed.
- O. V. Shulga, D. Zhou, A. V. Demchenko and K. J. Stine, Analyst, 2008, 133, 319–322 RSC.
- G. S. Paranjape, L. K. Gouwens, D. C. Osborn and M. R. Nichols, ACS Chem. Neurosci., 2012, 3, 302–311 CrossRef CAS PubMed.
- C. Korzeniewski and D. M. Callewaert, J. Immunol. Methods, 1983, 64, 313–320 CrossRef CAS PubMed.
- J. C. Wataha, C. T. Hanks and Z. Sun, Dent. Mater., 1994, 10, 156–161 CrossRef CAS PubMed.
- N. Ercal, H. Gurer-Orhan and N. Aykin-Burns, Curr. Top. Med. Chem., 2001, 1, 529–539 CrossRef CAS PubMed.
- M. V. Berridge, P. M. Herst and A. S. Tan, Biotechnol. Annu. Rev., 2005, 11, 127–152 CAS.
- U.-K. Hanisch and H. Kettenmann, Nat. Neurosci., 2007, 10, 1387–1394 CrossRef CAS PubMed.
- C. U. A. Kloss, M. Bohatschek, G. W. Kreutzberg and G. Raivich, Exp. Neurol., 2001, 168, 32–46 CrossRef CAS PubMed.
- M. Angeles Muñoz-Fernández and M. Fresno, Prog. Neurobiol., 1998, 56, 307–340 CrossRef.
- M. M. Syed, N. K. Phulwani and T. Kielian, J. Neurochem., 2007, 103, 1461–1471 CrossRef CAS PubMed.
- S. Persheyev, Y. Fan, A. Irving and M. J. Rose, J. Biomed. Mater. Res., Part A, 2011, 99A, 135–140 CrossRef CAS PubMed.
- M.-Y. Wei, L. J. Leon, Y. Lee, D. Parks, L. Carroll and P. Famouri, J. Colloid Interface Sci., 2011, 356, 182–189 CrossRef CAS PubMed.
- M. Hegner, P. Wagner and G. Semenza, Surf. Sci., 1993, 291, 39–46 CrossRef CAS.
- Y. H. Tan, K. Fujikawa, P. Pornsuriyasak, A. J. Alla, N. Vijaya Ganesh, A. V. Demchenko and K. J. Stine, New J. Chem., 2013, 37, 2150–2165 RSC.
- Y. H. Tan, J. A. Davis, K. Fujikawa, N. V. Ganesh, A. V. Demchenko and K. J. Stine, J. Mater. Chem., 2012, 22, 6733–6745 RSC.
Footnotes |
| † Electronic supplementary information (ESI) available. See DOI: 10.1039/c3bm60096c |
| ‡ These two authors contributed equally to this work. |
| This journal is © The Royal Society of Chemistry 2014 |