
Screening and structural characterization of potential α-glucosidase inhibitors from Radix Astragali flavonoids extract by ultrafiltration LC-DAD-ESI-MSn
Wenyue
Jiang
a,
Hong
Kan
a,
Pengdong
Li
a,
Shu
Liu
b and
Zhongying
Liu
*a
aCollege of Pharmacy, Jilin University, Fujin Road 1266, Changchun 130021, Jilin, China. E-mail: liuzy@jlu.edu.cn; Fax: +86 431 85262236; Tel: +86 431 85619704
bChangchun Institute of Applied Chemistry, Chinese Academy of Sciences, Changchun 130022, China
First published on 16th October 2014
Abstract
Inhibition of intestinal α-glucosidase activity is one important mechanism for the management of diabetes mellitus (DM). Identifying plants with α-glucosidase inhibitory activities and screening active compounds (α-glucosidase inhibitors) in them has become a popular field of research in the treatment of DM. In the present study, we used an in vitro assay of ultraviolet spectrophotometry to evaluate the α-glucosidase inhibitory activity of Radix Astragali flavonoids extract (RAFE). Then, ultrafiltration liquid chromatography with photodiode array detection coupled to electrospray ionization tandem mass spectrometry (ultrafiltration LC-DAD-ESI-MSn) was used to screen the active compounds in RAFE. As a result, the concentration (final) of RAFE required for 50% enzyme inhibition (IC50) was calculated as 2.888 mg mL−1. Through ultrafiltration LC-DAD-ESI-MSn analysis, seven compounds were identified as potential active compounds. They were calycosin-7-O-β-D-glucoside, biochanin A, calycosin-7-O-β-D-glucoside-6′′-O-malonate, ononin, calycosin, formononetin-7-O-β-D-glucoside-6′′-O-malonate and formononetin. Then, two of the potential active compounds, biochanin A and formononetin, were evaluated for α-glucosidase inhibitory activity. Their IC50 values were calculated as 0.020 mM and 0.027 mM respectively, while that of the reference drug acarbose was calculated as 0.382 mM.
Introduction
Diabetes mellitus (DM), one of the most serious and chronic metabolic diseases, has dramatically increased in occurrence due to excessive intake of carbohydrates.1 It was proposed that prevention of digestion of carbohydrates after food uptake would in turn cause a decrease in the absorption of glucose and consequently the reduction of postprandial blood glucose level elevation.2,3 Carbohydrate digestion primarily occurs in the small intestine through the action of pancreatic α-amylase, yielding both maltose and isomaltose oligosaccharides. These oligosaccharides and other natural oligosaccharides like sucrose are finally hydrolyzed by intestinal α-glucosidases to release monosaccharides suitable for absorption.4 Inhibitors of α-glucosidases, such as acarbose, can delay digestion of oligosaccharides yielded both from carbohydrates and from natural sources. These inhibitors can prolong the overall carbohydrate digestion time and cause a reduction in the rate of glucose absorption, ultimately blunting the postprandial plasma glucose rise.So far, many studies have been devoted to screening plants with α-glucosidase inhibitory activities and identifying active compounds from them.5–8 Among plants screened for α-glucosidase inhibitory activities, research on Chinese herbal medicine (CHM) has become a topic of interest as a lot of these herbs possess great inhibitory activities and low toxicities. More and more studies have been carried out to find the natural α-glucosidase inhibitory extracts or compounds from CHM.9–11 Among the methods for evaluating α-glucosidase inhibitory activities, ultraviolet spectrophotometry with 4-nitrophenyl-α-D-glucopyranoside (pNPG) as a substrate is widely utilised due to its ease of use, low cost and high throughput.12 For screening active compounds (α-glucosidase inhibitors) in extracts, a high-throughput and effective screening method has been developed in recent years. The method is ultrafiltration combined with liquid chromatography-tandem mass spectrometry (ultrafiltration LC-MSn), which is based on the ligands (active compounds) contained in the extracts bound to the receptor of α-glucosidase.11,13
In this work, we aimed to study the α-glucosidase inhibitory activity and active compounds of a common CHM named Radix Astragali, which has long been favored as an antidiabetic plant for treatment of type 2 diabetes.14,15 As is known, there are many hypoglycemic medicines prepared from Radix Astragali in China, such as “Huangqi” hypoglycemic granules, “Shenqi” hypoglycemic granules and “Zhenqi” hypoglycemic capsules (“qi” is an abbreviation of Radix Astragali in China). However, no report has previously screened α-glucosidase inhibitors from Radix Astragali. In this study, the α-glucosidase inhibitory activity of Radix Astragali was evaluated by ultraviolet spectrophotometry with pNPG as a substrate, and then ultrafiltration LC-MSn was applied to identify potential active compounds in Radix Astragali.
Experimental
Reagents and chemicals
α-Glucosidase (EC 3.2.1.20) and pNPG (EC 223.189-3) were obtained from Sigma Chemical Company (St. Louis, MO, USA); biochanin A and formononetin were obtained from Shanghai Ronghe Medical Technology Development Company (Shanghai, China). Acarbose (tablet) was purchased from Bayer HealthCare Company (Leverkusen, Germany). HPLC grade methanol, acetonitrile, dimethylsulfoxide (DMSO) and formic acid were obtained from TEDIA (Fairfield, OH, USA); D101 macroporous resin was obtained from Tianjin Agricultural Chemical Company (Tianjin, China); water was obtained from a Milli-Q water purification system (Milford, MA, USA); solvents and all other chemicals not mentioned were analytical grade.Materials and sample preparation
Radix Astragali was purchased from Tongrentang drugstore (Changchun, China) and authenticated by Prof. Shumin Wang (Changchun University of Chinese Medicine). Voucher specimens were deposited in our laboratory.As reported, flavonoids possess high inhibitory activities that are related to the number of hydroxyl groups in a molecule of the compound.16 So, in the present study, the inhibitory activity of Radix Astragali flavonoids extract (RAFE) was evaluated, and potential α-glucosidase inhibitors from the extract were screened.
Radix Astragali was ground to 10–20 mesh size and extracted twice by ultrasonication with 20 portions of 70% ethanol over 20 min. After this, the sample was centrifuged at 8000 rpm for 10 min and the supernatant was collected. Then, the collected solution was dried by vacuum and the residue was dissolved by water to a concentration of 0.2 g mL−1 (in terms of starting material). Subsequently, the solution was used to enrich RAFE through a D101 macroporous resin column. The column was firstly eluted with 5 times the column volume (CV) of distilled water to remove carbohydrates. Subsequently, 5 CV 70% ethanol was used to elute flavonoids from the column. The eluent was collected, condensed and lyophilized using a freeze drier. As a result, the yield of RAFE was 2.1% (w/w, the amount of RAFE/Radix Astragali powder mass).
α-Glucosidase inhibitory activity assay
The assay was performed in 96-well plates according to the modified method described by Watanabe.17 Both α-glucosidase and pNPG were dissolved in a 100 mM phosphate buffer (pH 6.8) and passed through a 0.45 μm filter. The samples were dissolved to give solutions of various concentrations in DMSO. Then, 10 μL of the sample solution was mixed with 50 μL α-glucosidase solution (0.2 U mL−1). After incubation for 5 min at 37 °C, 40 μL of pNPG (2 mM) was added as a substrate and incubated for an additional 5 min at 37 °C. The amount of released nitrophenyl product was measured on a Tecan GENios multifunctional microplate reader (Mäanedorf, Switzerland) at 405 nm. The inhibition (%) of the test sample on α-glucosidase could be calculated as| Inhibition (%) = [(AS1 − AS0)/(AC1 − AC0)] × 100 |
Screening of α-glucosidase inhibitors from RAFE by ultrafiltration
The screening procedure was performed according to the modified method of Li.11 RAFE and α-glucosidase were dissolved in a 10 mM ammonium acetate buffer (pH 6.8). RAFE (10 mg mL−1, 10 μL) was incubated for 30 min at 37 °C with α-glucosidase (20 U mL−1, 90 μL). After incubation, the mixture was filtered through a Microcon YM-10 centrifugal filter (Millipore, MA, USA) containing a regenerated cellulose ultrafiltration membrane with a 10![[thin space (1/6-em)]](https://www.rsc.org/images/entities/char_2009.gif) 000 MW cut-off at room temperature. The filter was washed with 100 μL ammonium acetate buffer by centrifugal force at 10000 rpm for 15 min in order to remove the unbound compounds. This process was repeated two times. After this, the bound ligands were released by adding 100 μL of methanol–water (50:50; v/v) (pH 3.3) and centrifuged at 10000 rpm for 15 min. This process was repeated two times. Then, the ultrafiltrated solvent was removed under vacuum, and further, the released ligands for analysis were re-dissolved in 50 μL methanol–water (10:90; v/v). The control experiment was carried out with denatured enzyme.
000 MW cut-off at room temperature. The filter was washed with 100 μL ammonium acetate buffer by centrifugal force at 10000 rpm for 15 min in order to remove the unbound compounds. This process was repeated two times. After this, the bound ligands were released by adding 100 μL of methanol–water (50:50; v/v) (pH 3.3) and centrifuged at 10000 rpm for 15 min. This process was repeated two times. Then, the ultrafiltrated solvent was removed under vacuum, and further, the released ligands for analysis were re-dissolved in 50 μL methanol–water (10:90; v/v). The control experiment was carried out with denatured enzyme.
Structural characterization of α-glucosidase inhibitors from RAFE by LC-DAD-ESI-MSn
After ultrafiltration, the released ligands were identified by LC-DAD-ESI-MSn, which consisted of liquid chromatography with photodiode array detection coupled to an ion trap mass spectrometer with an electrospray ionization source.The LC-DAD analysis was carried out on an ACQUITY UPLC H-Class System (Waters, Milford, MA, USA) using a Kinetex C18 analytical column (2.1 mm × 100 mm, 1.7 μm, 100A, Phenomenex). The injection volume was 5 μL. The column temperature was kept at 35 °C. The mobile phases A and B were acetonitrile and 0.1% aqueous formic acid, respectively. The flow rate was set to 0.4 mL min−1 and the eluting procedure was as follows: t = 0 min, 10% A; t = 0–10 min, 10–30% A; t = 10–12 min, 30–40% A; t = 12–14 min, 40% A; t = 14–15 min, 40–90% A; t = 15–20 min, 90% A.
Mass spectrometric detection was carried out on an LTQ XL linear ion-trap mass spectrometer (Thermo Finnigan, San Jose, CA, USA) in positive and negative ion modes. In positive ion mode, the electrospray voltage was 4.0 kV. The capillary voltage was optimized to 15 V and the tube lens offset to 150 V. The sheath and auxiliary gas flows (both nitrogen) were adjusted to 50 and 2 arbitrary units, respectively. The capillary temperature was 250 °C. The collision energy was set to 25 to 30 V. In negative ion mode, the electrospray voltage was 3.0 kV. The capillary voltage was optimized to −15 V and the tube lens offset to −150 V. Other parameters were the same as in the positive ion mode.
Results and discussion
Evaluation of α-glucosidase inhibitory activity of RAFE
As seen in Fig. 1, a dose-dependent relationship was found between the concentration of RAFE and the α-glucosidase inhibitory activity. The concentration (final) of RAFE required for 50% enzyme inhibition (IC50) was calculated as 2.888 mg mL−1. This assay indicated that one mechanism underlying the hypoglycemic effects of Radix Astragali was the inhibition of α-glucosidase activity.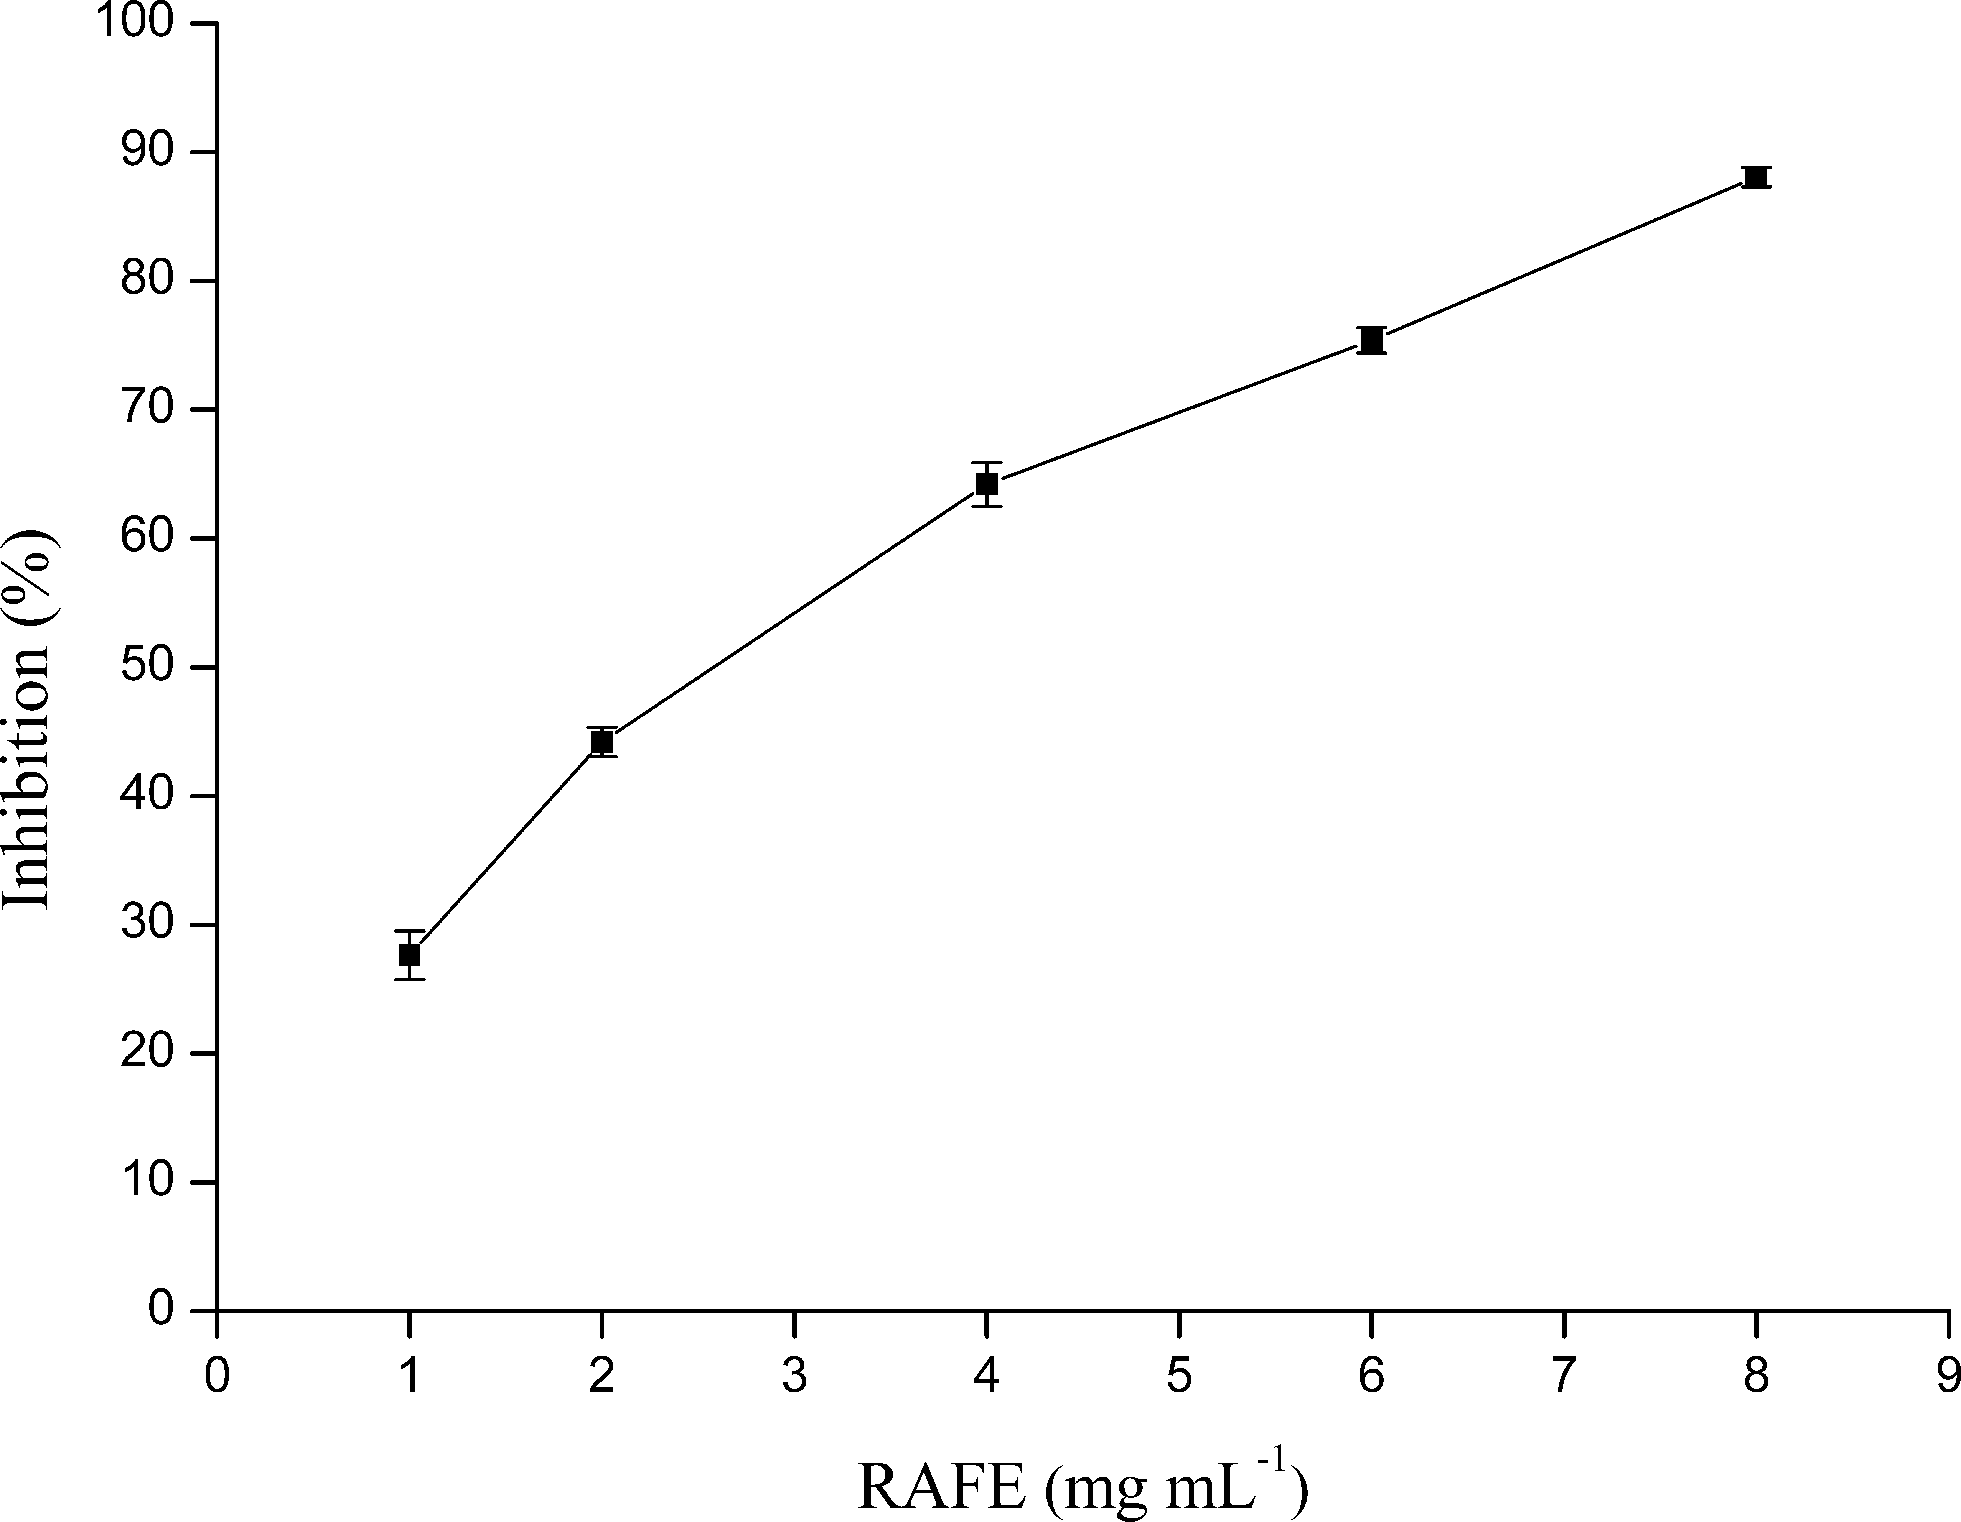 | ||
| Fig. 1 α-Glucosidase inhibitory activity of RAFE. | ||
Development of a LC-DAD method for the separation of RAFE
Before ultrafiltration, a LC-DAD separation method needed to be developed in order to identify the compounds contained in RAFE. In order to achieve satisfactory separation, the gradient elution procedure was optimized. As shown in Fig. 2A, under the optimum separation conditions a total of nine constituents were well-separated within 13 min. Because most constituents in the analyte had highest absorbances between 240 and 280 nm, a wavelength of 250 nm was selected for detection. Later, this LC-DAD separation method coupled with ESI-MSn was used to analyse the ligands of α-glucosidase from RAFE after ultrafiltration.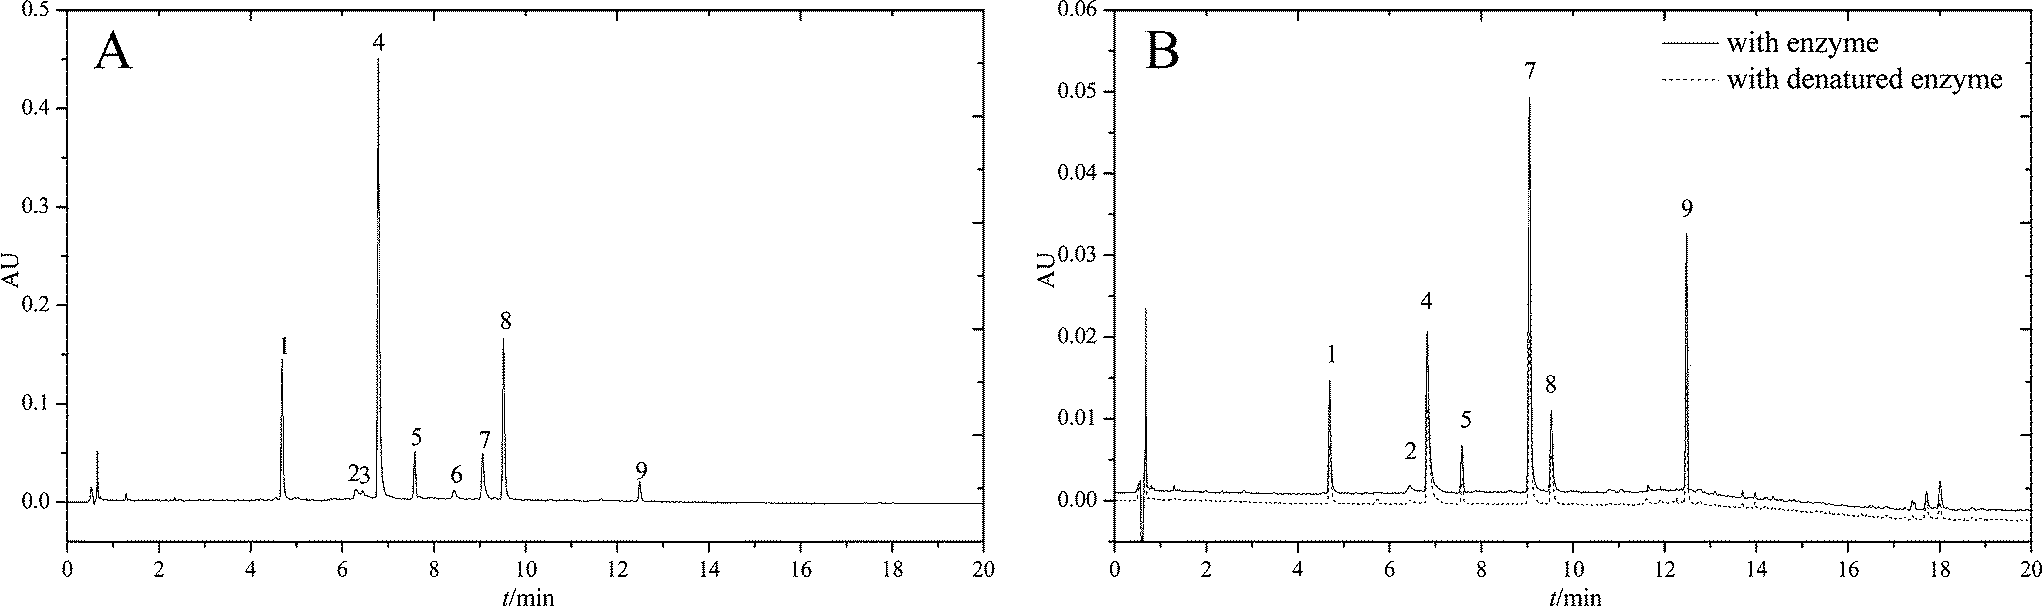 | ||
| Fig. 2 (A) LC-DAD chromatogram of RAFE; (B) LC-DAD chromatograms of RAFE after ultrafiltration. | ||
Screening active compounds (α-glucosidase inhibitors) from RAFE by ultrafiltration LC-DAD-ESI-MSn
As mentioned previously, the ligands specifically bound to α-glucosidase were extracted. The ligands nonspecifically bound to the ultrafiltration membrane were determined by carrying out a control experiment with denatured enzyme. The screening results are shown in Fig. 2B. The LC-chromatograms of the experimental group and control group are shown as the solid curve and the dashed curve, respectively. As shown in Fig. 2B, the peak area of the experimental group was larger than that of the control group. This difference of peak areas between the experimental group and the control group indicated the specific binding to α-glucosidase of compounds in RAFE. As shown, there were seven peaks accounting for such differences in peak areas. These peaks were 1, 2, 4, 5, 7, 8 and 9. As each peak represents a compound, seven components were screened as potential active compounds by ultrafiltration. The LC-retention time (tR), DAD-λmax and ESI-MSnm/z of these seven compounds are summarized in Table 1, and their chemical structures are shown in Fig. 3.| Peak no. | LC-tR (min) | DAD-λmax | MW | M (+) | M (−) | MSn (+) | Identification |
|---|---|---|---|---|---|---|---|
| 1 | 4.7 | 220, 248, 285 | 446 | 447, 285 | 491, 283 | MS2 [447]: 285 | Calycosin-7-O-β-D-glucoside |
| MS3 [447 → 285]: 270, 253, 241, 229, 225, 214, 137 | |||||||
| 2 | 6.2 | 226, 318 | 284 | 285 | 283, 268 | MS2 [285]: 270, 253, 241, 229, 225, 214, 152 | Biochanin A |
| 4 | 6.7 | 220, 248, 285 | 532 | 533, 285 | 283 | MS2 [533]: 285 | Calycosin-7-O-β-D-glucoside-6′′-O-malonate |
| MS3 [533 → 285]: 270, 253, 241, 229, 225, 214, 137 | |||||||
| 5 | 7.5 | 240, 300 | 430 | 431, 269 | 475, 267 | MS2 [431]: 269 | Ononin |
| MS3 [431 → 269]: 254, 237, 225, 213, 209, 198, 136 | |||||||
| 7 | 8.9 | 216, 277 | 284 | 285 | 283, 268 | MS2 [285]: 270, 253, 241, 229, 225, 214, 137 | Calycosin |
| 8 | 9.4 | 220, 248, 290 | 516 | 517, 269 | 267 | MS2 [517]: 269 | Formononetin-7-O-β-D-glucoside-6′′-O-malonate |
| MS3 [517 → 269]: 254, 237, 225, 213, 209, 198, 136 | |||||||
| 9 | 12.4 | 220, 248 | 268 | 269 | 267 | MS2 [269]: 254, 198, 237, 209, 213, 225, 136 | Formononetin |
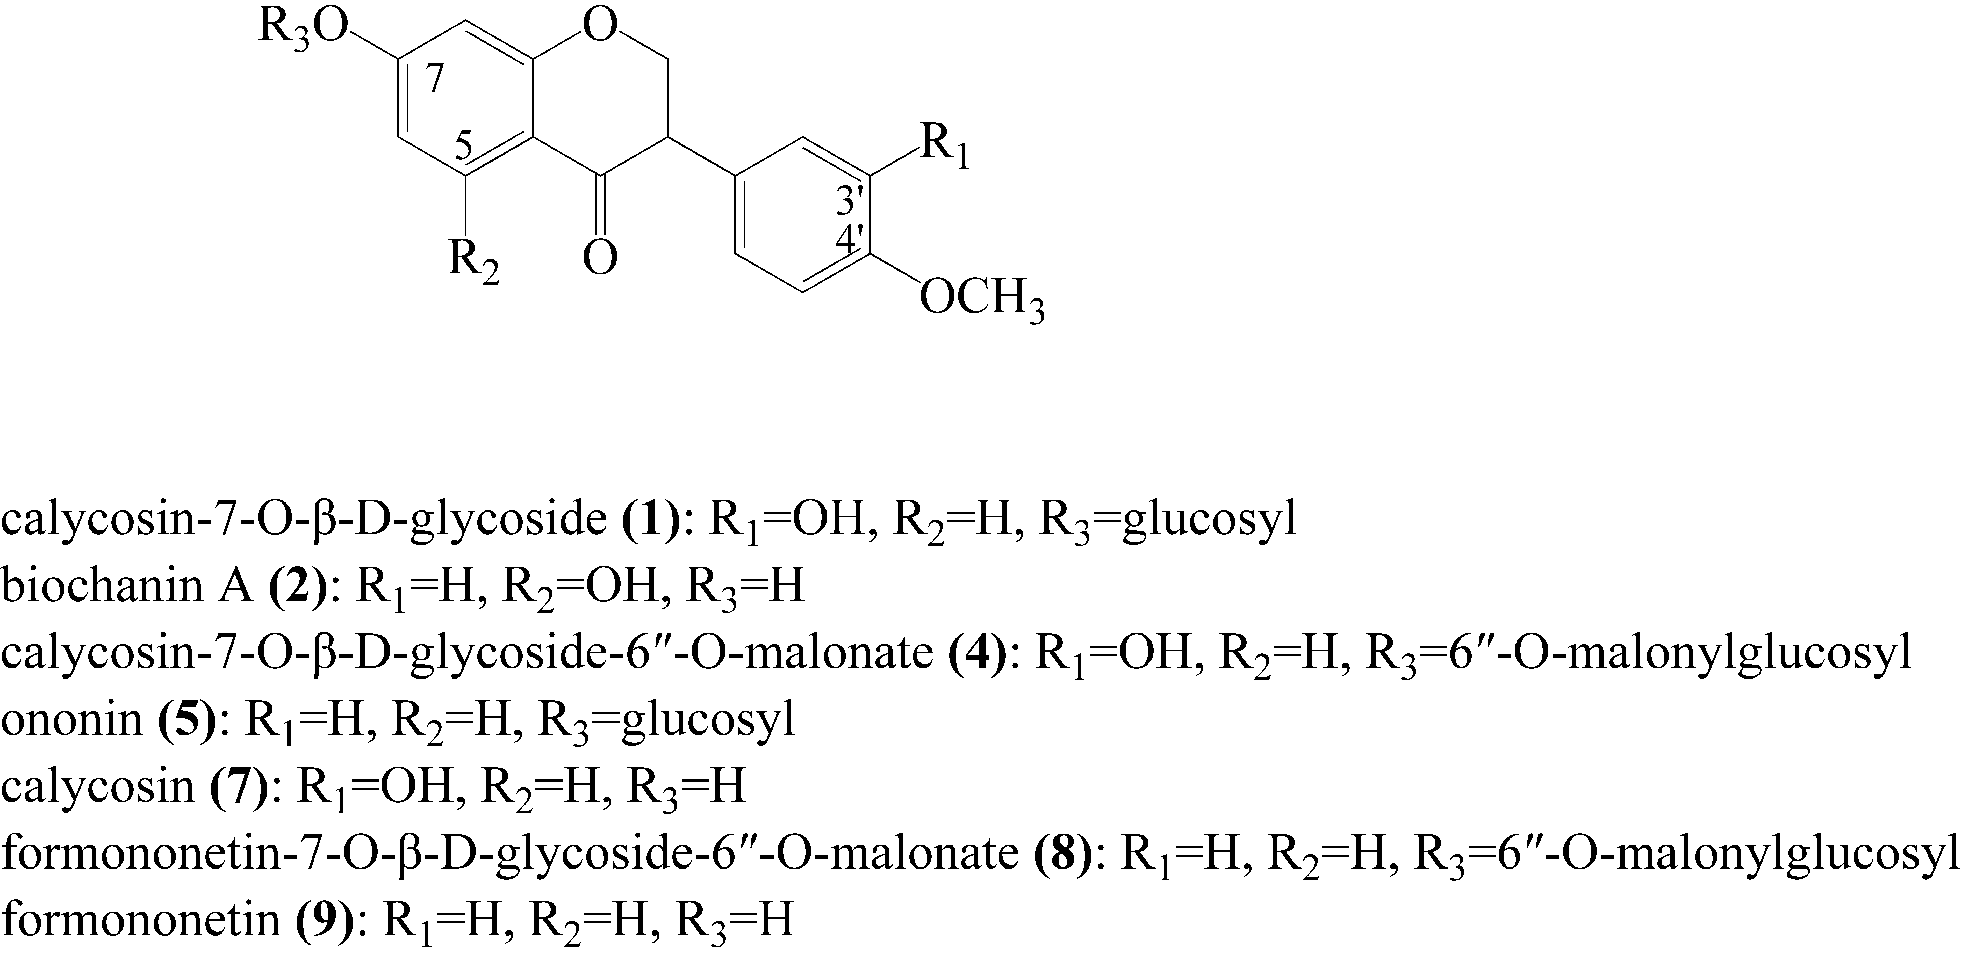 | ||
| Fig. 3 Chemical structures of the seven potential α-glucosidase inhibitors obtained from RAFE. | ||
The DAD spectrum of peak 1 shows that the peaks of the λmax were 220, 248 and 285 nm. In the negative- and positive-ion ESI-MS, quasimolecular ion peaks were observed at m/z 477 [M + H]+ and m/z 491 [M + HCOO]−. In the MS2 data, the m/z 477 gave the product ion at m/z 285 by neutral loss of 162 Da corresponding to the loss of a hexose residue. In the MS3 data, the m/z 285 directly gave the product ions at m/z 270, 253, 241, 229, 225, 214 and 137, and the compound was identified as calycosin. By comparing the reference compounds, the compound of peak 1 was identified as calycosin-7-O-β-D-glucoside.
The DAD spectrum of peak 2 shows that the peaks of the λmax were 226 and 318 nm. In the negative- and positive-ion ESI-MS, quasimolecular ion peaks were observed at m/z 285 [M + H]+ and m/z 283 [M − H]−, so the molar mass of this compound was 284. In the MS2 data, the m/z 285 directly gave the product ions at m/z 270, 253, 241, 229, 225, 214 and 152. By comparing the reference compounds, the compound of peak 2 was identified as biochanin A.
The DAD spectrum of peak 4 shows that the peaks of the λmax were the same as peak 1, i.e., 220, 248 and 285 nm. In the positive-ion ESI-MS, a quasimolecular ion peak was observed at m/z 533 [M + H]+. In the MS2 data, the m/z 533 directly gave the product ion at m/z 285 by expelling a 248 Da neutral fragment corresponding to malonylglucosyl. In the MS3 data, the m/z 285 gave rise to the same product ions as for calycosin. This result indicates that the only difference between peaks 4 and 1 is the substituted group. Thus, the compound of peak 4 was tentatively identified as calycosin-7-O-β-D-glucoside-6′′-O-malonate.
The DAD spectrum of peak 5 shows that the peaks of the λmax were 240 and 300 nm. In the negative- and positive-ion ESI-MS, quasimolecular ion peaks were observed at m/z 431 [M + H]+ and m/z 475 [M + HCOO]−. In the MS2 data, the m/z 431 gave the product ion at m/z 269. In the MS3 data, the m/z 269 gave the product ions at m/z 254, 237, 225, 213, 209, 198 and 136. By comparing the reference compounds, a conclusion could be reached that the compound corresponding to peak 5 was ononin.
The DAD spectrum of peak 7 shows that the peaks of the λmax were 216 and 277 nm. In the negative- and positive-ion ESI-MS, quasimolecular ion peaks were observed at m/z 285 [M + H]+ and m/z 283 [M − H]−, so the molar mass of this compound was 284. In the MS2 data, the m/z 285 directly gave the product ions at m/z 270, 253, 241, 229, 225, 214 and 137. By comparing the reference compounds, the compound of peak 7 was unambiguously identified as calycosin.
The DAD spectrum of peak 8 shows that the peaks of the λmax were 220, 248 and 290 nm. In the positive-ion ESI-MS, an ion peak was observed at m/z 517. In the MS2 data, the m/z 517 generating m/z 269 required the loss of a 248 Da neutral fragment. In the MS3 data, the fragmentation pathway of m/z 269 was the same as that of the m/z 269 for ononin (peak 5). The compound of peak 8 was therefore identified as formononetin-7-O-β-D-glucoside-6′′-O-malonate.
The DAD spectrum of peak 9 shows that the peaks of the λmax were 220 and 248 nm. In the negative- and positive-ion ESI-MS, quasimolecular ion peaks were observed at m/z 269 [M + H]+ and m/z 267 [M − H]−, so the molar mass of this compound was 268. In the MS2 data, the m/z 269 gave the product ions at m/z 254, 237, 225, 213, 209, 198 and 136. By comparing the reference compounds, the compound corresponding to peak 9 was identified as formononetin.
Evaluation of α-glucosidase inhibitory activities of potential active compounds
Two of the potential active compounds from RAFE, biochanin A and formononetin, were evaluated for α-glucosidase inhibitory activity in this study. As seen in Fig. 4, both biochanin A and formononetin were found to exhibit significant α-glucosidase inhibitory activities in a dose-dependent manner, and their inhibitory activities were much better than that of acarbose. By calculation, the IC50 values of biochanin A and formononetin were 0.020 mM and 0.027 mM, respectively, while that of acarbose was 0.382 mM.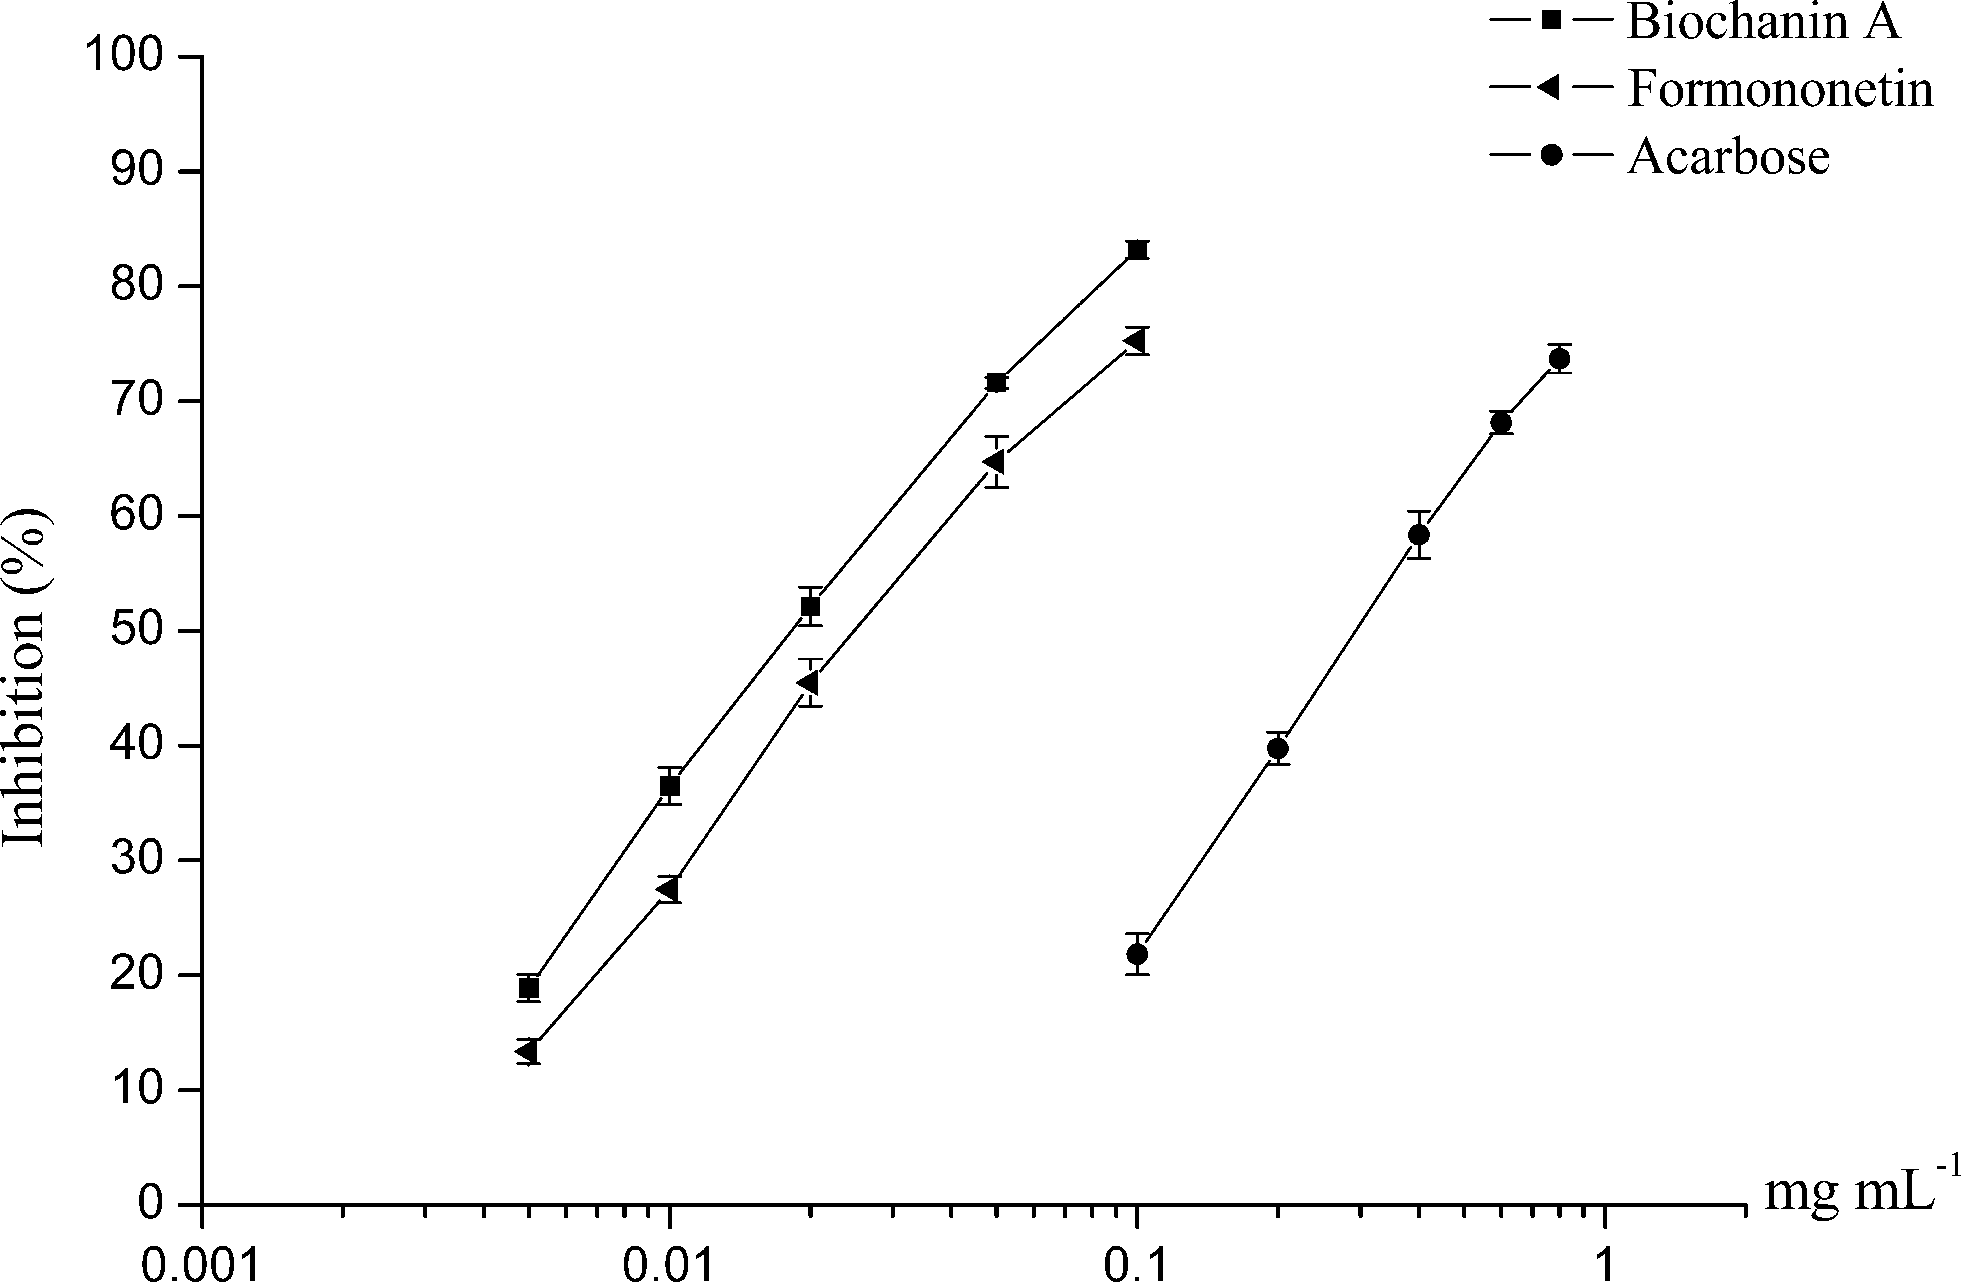 | ||
| Fig. 4 α-Glucosidase inhibitory activities of biochanin A, formononetin and acarbose. | ||
Through this assay, the α-glucosidase inhibitory activities of biochanin A and formononetin were confirmed. The high α-glucosidase inhibitory activities of these compounds indicated that they are the main active compounds in RAFE.
Discussion
Ultraviolet spectrophotometry with pNPG as a substrate is an easy, low-cost, high-throughput and widely used method. However, this method has some flaws. For the procedure used in this study, the determination was carried out at 405 nm. Under this absorption wavelength, many plant extracts have strong absorbance, especially flavonoid extracts. The strong absorbance of the extract itself might lead to the failure of the inhibition assay, as the absorbance of the extract itself exceeds the maximum absorbance limit of the detector (2.5). Therefore, ultraviolet spectrophotometry with pNPG as a substrate needs to be further improved.During screening of α-glucosidase inhibitors in a plant extract, the oligosaccharides should be removed from the extract before ultrafiltration, especially the disaccharides such as maltose, isomaltose and sucrose. This is because the disaccharides in the extract will act as ligands and bind to the acceptor of α-glucosidase, and eventually lead to a false positive result of the α-glucosidase inhibition assay or a false high inhibitory activity of the sample. In addition, the binding between disaccharides and the acceptor would competitively inhibit the binding between the target inhibitors and the acceptor, and eventually lead to the failure of the screening of α-glucosidase inhibitors from plants or CHM extracts. In addition, in the chromatogram, there might be a small difference in the peak areas between the sample (with α-glucosidase) and the control (with denatured α-glucosidase). This might be the main reason for the failure of ultrafiltration experiments.
In this study, seven potential active compounds were screened from RAFE by ultrafiltration LC-DAD-ESI-MSn. It would have been better if all of them had been evaluated for α-glucosidase inhibitory activity. However, unfortunately, we could not obtain standards for all of these compounds. For example, calycosin-7-O-β-D-glucoside-6′′-O-malonate and formononetin-7-O-β-D-glucoside-6′′-O-malonate cannot be obtained commercially. Therefore, in the present study, we chose only two of the potential active compounds, biochanin A and formononetin, which were available in our laboratory, to evaluate α-glucosidase inhibitory activities. In addition, from the structure analysis,16 biochanin A and formononetin might have the highest activities among the seven potential active compounds due to the presence of hydroxyl groups at C-5 and -7.
Conclusions
RAFE showed a dose-dependent relationship between the concentration and the α-glucosidase inhibitory activity, and the IC50 value was calculated as 2.888 mg mL−1 (final concentration). This result indicates that one of the mechanisms for the hypoglycemic effects of Radix Astragali is the inhibition of α-glucosidase activity.Through ultrafiltration LC-DAD-ESI-MSn analysis, seven compounds were identified as potential α-glucosidase inhibitors. These were calycosin-7-O-β-D-glucoside, biochanin A, calycosin-7-O-β-D-glucoside-6′′-O-malonate, ononin, calycosin, formononetin-7-O-β-D-glucoside-6′′-O-malonate and formononetin. Two of the potential active compounds, biochanin A and formononetin, have been confirmed as having α-glucosidase inhibitory activity, and their IC50 values were 0.020 mM and 0.027 mM (final concentration), respectively.
Acknowledgements
This work was financially supported by Jilin Provincial Department of Science and Technology (no. 20130206023YY).References
- American Diabetes Association, Diabetes Care, 2010, 33, S62 CrossRef PubMed.
- G. Derosa and P. Maffioli, Arch. Med. Sci., 2012, 8, 899 CrossRef CAS PubMed.
- S. Kumar, S. Narwal, V. Kumara and O. Prakash, Pharmacogn. Rev., 2011, 5, 19 CrossRef CAS PubMed.
- M. E. Borges, G. A. Silveira and I. Carvalho, Tetrahedron, 2006, 62, 10277 CrossRef PubMed.
- T. J. Ha, J. H. Lee, M. H. Lee, B. W. Lee, H. S. Kwon, C. H. Park, K. B. Shim, H. K. Kima, I. R. Baeka and D. S. Jang, Food Chem., 2012, 135, 1397 CrossRef CAS PubMed.
- O. Kamiyama, F. Sanae, K. Ikeda, Y. Higashi, Y. Minami, N. Asano, I. Adachi and A. Kato, Food Chem., 2010, 122, 1061 CrossRef CAS PubMed.
- F. Tian, B. Li, B. Ji, G. Zhang and Y. Luo, LWT–Food Sci. Technol., 2009, 42, 1289 CrossRef CAS PubMed.
- R. Deng, Recent Pat. Food, Nutr. Agric., 2012, 4, 50 CAS.
- H. M. S. Shihabudeen, D. H. Priscilla and K. Thirumurugan, Nutr. Metab., 2011, 8, 46 Search PubMed.
- L. P. Guo, T. F. Jiang, Z. H. Lv and Y. H. Wang, J. Pharm. Biomed. Anal., 2010, 53, 1250 CrossRef CAS PubMed.
- H. Li, F. Song, J. Xing, R. Tsao, Z. Liu and S. Liu, J. Am. Soc. Mass Spectrom., 2009, 20, 1496 CrossRef CAS PubMed.
- J. S. Kim, T. K. Hyun and M. J. Kim, Food Chem., 2011, 124, 1647 CrossRef CAS PubMed.
- D. Yang, J. Zhao, S. Liu, F. Song and Z. Liu, Anal. Methods, 2014, 6, 3353 RSC.
- R. L. Hoo, J. Y. Wong, C. F. Qiao, A. Xu, H. X. Xu and K. S. Lam, Nutr. Metab., 2010, 7, 67 Search PubMed.
- J. Y. W. Chan, F. C. Lam, P. C. Leung, C. T. Che and K. P. Fung, Phytother. Res., 2009, 23, 658 CrossRef PubMed.
- J. Xiao, G. Kai, K. Yamamoto and X. Chen, Crit. Rev. Food Sci. Nutr., 2013, 53, 818 CrossRef CAS PubMed.
- J. Watanabe, J. Kawabata, H. Kurihara and R. Niki, Biosci., Biotechnol., Biochem., 1997, 61, 177 CrossRef CAS.
| This journal is © The Royal Society of Chemistry 2015 |