Surface plasmon resonance imaging (SPRi) for multiplexed evaluation of bacterial adhesion onto surface coatings†
Pegah N.
Abadian
and
Edgar D.
Goluch
*
Department of Chemical Engineering, Northeastern University, Boston, MA, USA. E-mail: e.goluch@neu.edu; Fax: +1-617-373-2209; Tel: +1-617-373-3500
First published on 27th October 2014
Abstract
Surface plasmon resonance imaging (SPRi) provides continuous, label-free, high-spatial-resolution monitoring of physical changes that occur on surfaces that are up to one square centimeter in area. Here, we utilize SPRi technology to address the challenge of quantitatively evaluating the efficacy of multiple materials to prevent biofilm formation when exposed to flowing fluids. A multiplexed analysis format is particularly important in bacterial attachment studies as adhesion events are very sensitive to their local micro-environment, which are difficult to reproduce and control between experiments. In this study, the effectiveness of bovine serum albumin (BSA), casein, and penicillin/streptomycin surface coatings to prevent Pseudomonas aeruginosa and Staphylococcus aureus adhesion is investigated with SPRi. The coatings were deposited on different sections of a single gold SPRi sensing surface and monitored for 24 hours while being exposed to a continuous flow of growth medium containing bacterial cells. We found that casein most effectively inhibits attachment of cells to the gold surface over a 24 hour period, with an 80% decrease in adhesion versus a bare gold surface for P. aeruginosa and a 60% decrease for S. aureus.
Introduction
As an alternative to current screening methods for antibacterial coatings, which employ multiple static incubation steps,1 we demonstrate the ability to use Surface Plasmon Resonance imaging (SPRi) to monitor bacterial adhesion to a coating, in real time, under continuous flow conditions. There is a clear need for new screening approaches that more closely resemble in vivo situations. For example, while it is widely accepted that silver and copper have antimicrobial properties, literature shows that the efficacy of these coatings is very situation dependent with heart valves, orthopedic implants, central venous catheters, and other medical instruments showing very little benefit.2–4 One potential explanation for the discrepancies is that bacterial cells initiate different biofilm and colonization responses when located in flow environments,5 suggesting that current screening methods are insufficient, particularly in situations where cells and antimicrobial coatings are exposed to flow.We investigated two biofilm-forming opportunistic pathogens, Pseudomonas aeruginosa and Staphylococcus aureus, to demonstrate the utility of SPRi for the evaluation of anti-fouling coatings. More than 60% of all hospital-acquired infections are caused by bacterial biofilms.6–8P. aeruginosa is a model species for monitoring biofilm formation. It is also responsible for serious infections in patients with cystic fibrosis,9–11 severe burns,12 and compromised immune systems.13Staphylococcus aureus is one of the most common pathogens in hospital-acquired bacterial infections, causing endocarditis, osteomyelitis, and abscesses.14,15Staphylococcus bacteria are able to adhere to the surface of indwelling medical devices and form biofilms on multiple types of surfaces, such as plastics and metals.16,17 Once the cells attach to a surface, they begin to produce a biofilm composed of exopolysaccharrides (EPS), peptides, and metabolites around themselves.18–20 The cells inside of a biofilm have been shown to be up to 1000 times more resistant to antibacterial chemicals compared to bacteria in suspension.21–23 This capability makes S. aureus one of the most serious bloodstream-infection-related pathogens, and this particular bacterium is responsible for about 38% of these infections.24 Therefore, inhibiting bacterial attachment on surfaces plays a crucial role in preventing chronic and antibiotic resistant infections.
This is the first time that the efficacy of multiple surface coatings to prevent biofilm formation has been determined by imaging and side-by-side comparison in a single experiment. Bovine serum albumin (BSA) and casein were chosen as surface coatings because of their abundant use in the prevention of non-specific binding to surfaces in analytical and microfluidic devices.25,26 BSA is a 66 kDa molecular weight protein that is hydrophilic when folded, prompting its use as a common blocking agent in many biochemical experiments.27 Casein is the name given to a family of proteins that make up 80% of protein content in cow milk. Both sets of proteins assemble very tightly on gold surfaces to prevent adsorption of other biomolecules. The combination of penicillin with streptomycin is a well-known antibiotic treatment of Gram-positive bacteria. Penicillin belongs to the class of β-lactam antibiotics. Like other antibiotics in this class, it works by inhibiting the synthesis of cell walls in bacteria.28 Streptomycin is a well-known antibiotic for both Gram-negative and Gram-positive infections. The efficacy of a penicillin/streptomycin (10![[thin space (1/6-em)]](https://www.rsc.org/images/entities/char_2009.gif) 000 units of penicillin per mL, 10
000 units of penicillin per mL, 10![[thin space (1/6-em)]](https://www.rsc.org/images/entities/char_2009.gif) 000 µg of streptomycin per mL) cocktail for prevention of P. aeruginosa and S. aureus adsorption was therefore also tested.
000 µg of streptomycin per mL) cocktail for prevention of P. aeruginosa and S. aureus adsorption was therefore also tested.
SPR monitors changes that take place within approximately 200 nm of the gold sensor surface by detecting variations in refractive index that occur when biomaterial displaces the reference fluid near the sensor.29–31 This label-free and real-time technique has been used to quantitatively monitor dynamic cellular changes on surfaces and to detect the adhesion of bacteria.32,33 SPR imaging (SPRi) has the additional capability of acquiring high-resolution pictures of the entire sensor surface every few seconds. SPRi can provide information about biofilm formation on the surface and is able to monitor the surface in real-time as bacteria grow, attach to the gold surface, and form biofilms.34–37
Here, we use SPRi to quantify the prevention of bacterial adhesion. At the beginning of each experiment, an image from the sensor surface is first selected as a reference to identify future changes. The comparison between the reference and subsequent images is known as a difference image. In this study, the collected difference images were used to determine the relative ability of various coatings to prevent bacterial surface adhesion.
Methods
PDMS chamber design and fabrication
A chamber made of polydimethylsiloxane (PDMS) with a volume of 400 µL was prepared and placed on a gold-coated sensor prism (SPRi-Biochip, Horiba Scientific). First, a block of PDMS was made by mixing the base and curing agent in a 10![[thin space (1/6-em)]](https://www.rsc.org/images/entities/char_2009.gif) :
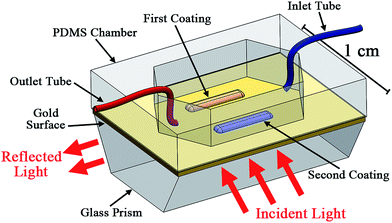
:![[thin space (1/6-em)]](https://www.rsc.org/images/entities/char_2009.gif) 1 ratio (Dow Corning Sylgard 184, Ellsworth Adhesives); the prepared mixture was poured on a polished silicon wafer and cured in an oven at 70 °C for 2 hours. The cured PDMS, approximately 7 mm in height, was peeled from the wafer and cut into rectangular pieces having the same dimensions as the SPR prism surface (2.4 cm × 1.2 cm). Next, a chamber was created in the center of the PDMS piece using a surgical blade. The chamber had the same shape as the sealing gasket normally used in the SPR system. A schematic of this setup is shown in Fig. 1.
1 ratio (Dow Corning Sylgard 184, Ellsworth Adhesives); the prepared mixture was poured on a polished silicon wafer and cured in an oven at 70 °C for 2 hours. The cured PDMS, approximately 7 mm in height, was peeled from the wafer and cut into rectangular pieces having the same dimensions as the SPR prism surface (2.4 cm × 1.2 cm). Next, a chamber was created in the center of the PDMS piece using a surgical blade. The chamber had the same shape as the sealing gasket normally used in the SPR system. A schematic of this setup is shown in Fig. 1.
Coating
The PDMS chamber was first placed on the gold-coated prism surface. Next, one third of the gold-coated sensor surface inside the chamber was coated with 10 µL of casein solution at concentration of 1 mg mL−1 (right side of the sensor). Another third of the gold surface was then coated with 10 µL of BSA at concentration of 2 mg mL−1 (left side of the sensor). Both proteins were dissolved in 25 mM phosphate buffered saline (pH 7). The middle section of the surface was left exposed as bare gold. For evaluating the antibiotic coating, one third of the gold surface was coated with 10 µL of penicillin/streptomycin solution (10![[thin space (1/6-em)]](https://www.rsc.org/images/entities/char_2009.gif) 000 units of penicillin per mL, 10
000 units of penicillin per mL, 10![[thin space (1/6-em)]](https://www.rsc.org/images/entities/char_2009.gif) 000 µg of streptomycin per mL) and another third of the gold surface was coated with 10 µL of BSA (2 mg mL−1). After the solutions were pipetted directly on the sensor surface, the coated prisms were placed in a sealed Petri dish for 3 hours to let the material dry completely and attach to the surface prior to running the experiment. No wash steps were performed prior to exposing the surface to the sample.
000 µg of streptomycin per mL) and another third of the gold surface was coated with 10 µL of BSA (2 mg mL−1). After the solutions were pipetted directly on the sensor surface, the coated prisms were placed in a sealed Petri dish for 3 hours to let the material dry completely and attach to the surface prior to running the experiment. No wash steps were performed prior to exposing the surface to the sample.
Bacterial culture
Cyan-fluorescent protein-labeled P. aeruginosa (CFP-PAO1) was obtained from the laboratory of Dr Veronica Godoy-Carter in the Department of Biology at Northeastern University. S. aureus bacteria were obtained from the American Type Culture Collection (25![[thin space (1/6-em)]](https://www.rsc.org/images/entities/char_2009.gif) 923). Both species were cultured initially on a Lysogeny Broth (LB) agar plates (281210 BD Difco Agar Technical, 244610 BD Difco Luria Bertani Broth, Miller) at 37 °C for 24 hours. Prior to each experiment, the cells were inoculated in 6 mL of LB liquid growth medium and incubated at 37 °C for 18 hours in order for the bacteria to reach stationary growth phase. After this incubation process, the liquid culture was stirred in a vortex mixer to provide an even concentration of cells within the growth medium. The growth medium was then diluted 1
923). Both species were cultured initially on a Lysogeny Broth (LB) agar plates (281210 BD Difco Agar Technical, 244610 BD Difco Luria Bertani Broth, Miller) at 37 °C for 24 hours. Prior to each experiment, the cells were inoculated in 6 mL of LB liquid growth medium and incubated at 37 °C for 18 hours in order for the bacteria to reach stationary growth phase. After this incubation process, the liquid culture was stirred in a vortex mixer to provide an even concentration of cells within the growth medium. The growth medium was then diluted 1![[thin space (1/6-em)]](https://www.rsc.org/images/entities/char_2009.gif) :
:![[thin space (1/6-em)]](https://www.rsc.org/images/entities/char_2009.gif) 100 in fresh LB to an approximate density of 1 × 10⁶ cells per mL prior to loading into the chamber.
100 in fresh LB to an approximate density of 1 × 10⁶ cells per mL prior to loading into the chamber.
SPRi experimental protocol
Before starting the SPRi experiment, 200 µL of the bacterial medium was placed in the PDMS chamber over the sensor surface, and the assembly was inserted in the SPRi system. There was no additional incubation period between loading the bacterial medium on the sensor surface and placement of the gold prism into the SPRi system. For control experiments, 200 µL of sterile LB solution was placed in the chamber. Fresh LB growth medium was then flowed continuously through the bacterial chamber, at a flow rate of 10 µL min−1, during the 24 hour experimental period. All SPRi experiments were performed at room temperature.The instrument used collimated light from an 810 nm LED and the resonance peak was determined by changing the incident light angle at the beginning of each experiment. At the beginning of each experiment, an incident angle was identified, which provided the best contrast and therefore greatest sensitivity (resonance angle). Each experiment was then completed at this identified fixed angle. For these sets of experiments, the resonance angle was between 57.67 and 59.02 degrees. An initial image of the surface was acquired. Difference images were then obtained at regular time intervals to compare the current image of the surface against the initial reference image, and areas on the gold surface where the reflectivity changed were identified.
SPRi analysis
Each experiment was repeated three times and the mean values of the brightness (brightness scale: 0 is black, 255 is white) for each of the coated sections were obtained. For analysis, a rectangular region approximately 0.5 mm wide by 3 mm long was selected in the center of each patterned area in the images. This area was sufficiently small to avoid edge effects at the interfaces between surface coatings. Intensity signals from the pixels in each region were averaged to determine the extent of biofouling on each coating at different time points using mean grey value analysis in Adobe Photoshop CS5. The mean values were then normalized using the reflectivity change of the bare gold section at the end of the experiments. The data was evaluated using a 2-tailed t-test with unequal variance, and statistically significant differences (p < 0.05) between the coatings at each time point are marked.SEM imaging
Samples prepared for scanning electron microscope (SEM) imaging were first dried. The entire prism was then gently submerged in gluteraldehyde to fix the biofilm on the surface, followed by dehydration in increasing concentrations of ethanol (35%, 50%, 75%, 85%, 95%, 100%), and a final wash with cacodylate buffer (0.1 M, pH 7). The prism along with the biofilm was then sputter-coated with a thin layer of Pt/Pd alloy (Cressington Sputter Coater 208HR) and imaged with a Hitachi S-4800 Field Emission SEM.Results and discussion
Biofilm formation on a bare gold surface
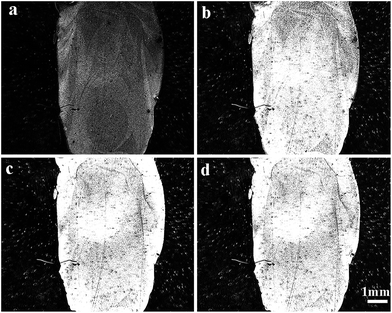
We began by monitoring biofilm formation of S. aureus bacteria on the bare gold surface using the SPR sensor. The results of this experiment provided useful reference data for the studies with more complex surface coatings. Fig. 2 shows the SPRi difference images obtained at different time intervals during the experiment. In the biofilm formation process, bacteria first attached to the gold surface to form colonies. At this stage, the refractive index at the attachment location changed, and this variation was detected with the SPRi sensor. The brightness of each measured 7 µm × 7 µm pixel in the image is proportional to the volume of fluid that is displaced by biomass in the 200 nm space above the surface. The image brightness was saturated within 10 hours of starting the experiment, indicating a robust biofilm that was at least 200 nm thick across the entire sensor surface. Similar results were obtained for P. aeruginosa biofilm growth on the sensor surface.32Both P. aeruginosa and S. aureus species are known to be hydrophobic;38 therefore, the rapid accumulation of bacteria on the surface was expected. While freshly cleaned gold is hydrophilic, handling the surface during the experimental setup in the laboratory rapidly causes it to become hydrophobic.39 A control experiment, with no bacteria in the system, showed no changes in brightness after 24 hours of LB flow.
Casein and BSA
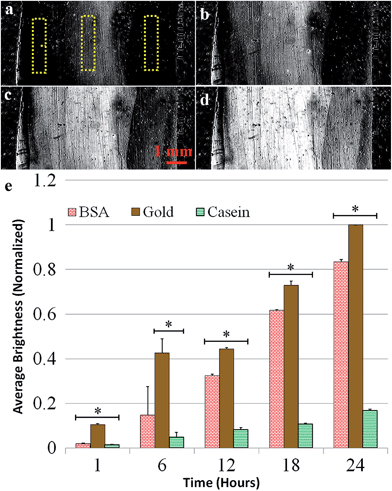
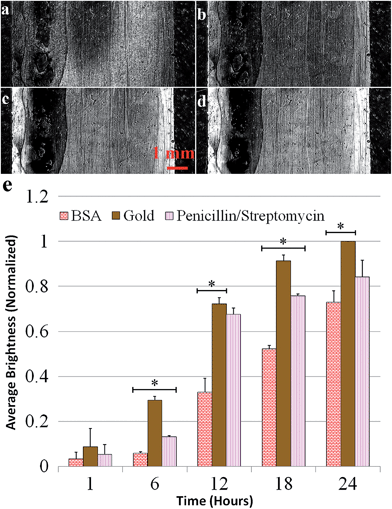
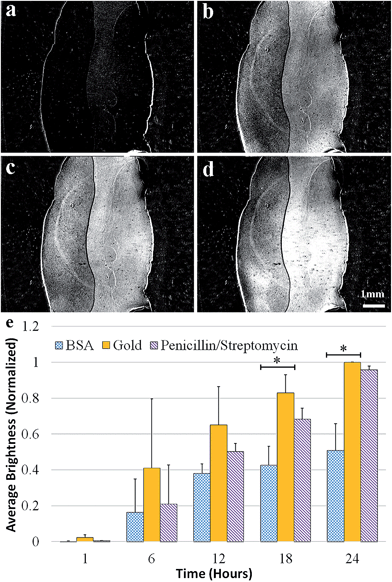
In the next set of experiments, the effects of casein, a well-known family of proteins for preventing biomolecular attachment in microfluidic applications,40 and BSA, a hydrophilic protein frequently used to prevent non-specific biofouling,27,41 were investigated. First, P. aeruginosa adhesion was evaluated on a sensor surface with BSA coated on the left side, casein coated on the right, and bare gold in the middle. The graph in Fig. 3 shows the normalized mean reflectivity for each coating, with error bars representing the standard deviations. After 24 hours of exposure to flow containing P. aeruginosa, the BSA coating had about 15% less biomass and the casein coating had over 80% less biomass than bare gold.Next, BSA and casein were exposed to flow containing planktonic S. aureus cells. Images in Fig. 4a–d show the difference images from one experiment at six-hour intervals and reveal the formation of biofilm on the surface. Fig. 4e shows the results of the data analysis, which was performed the same way as for the P. aeruginosa experiments. After 24 hours, the BSA coating had 20% less biomass and the casein coating had 60% less biomass than bare gold. The increased standard deviation for the results using S. aureus, shown in Fig. 4, is attributed to the greater variability in attachment behavior for this species. S. aureus cells tend to cluster together and attach to surfaces in clumps at the tested flow conditions.
The greater contrast increase for bare gold, shown in Fig. 3 and 4, indicates more biofilm formation in comparison to the two coatings. Fig. 3 and 4 indicate, both qualitatively and quantitatively, that casein prevented biofilm attachment onto the surface. BSA provided a statistically significant decrease in biofouling for P. aeruginosa, but was not effective at preventing S. aureus attachment. Given that bacteria with hydrophobic cellular membranes are generally attracted to hydrophobic surfaces and repelled by hydrophilic surfaces, the results support a conclusion that the casein coating remains hydrophilic throughout the experiment. The BSA was perhaps partially denatured by the gold surface, exposing some of its hydrophobic amino acids to the solution.26,42 We ran a contact angle test and the casein-coated surface wetted significantly more than the BSA-coated side. A drop of water on the casein surface exhibited a contact angle of less than 20° while the contact angle on BSA was ∼45°, indicating that the BSA coating creates a less hydrophilic surface. A control SPRi experiment without the addition of bacteria showed negligible change in brightness for both coatings, indicating that the material was not removed or degraded by the flow, and thus we do not expect cross contamination of the surfaces.
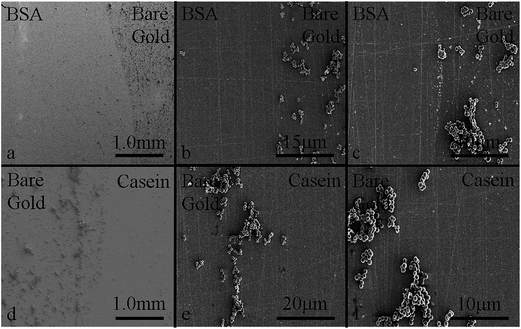
To validate the SPRi results, one of the S. aureus experiments was stopped after six hours and imaged using an SEM. Fig. 5a and d show the borders between the BSA/bare gold and bare gold/casein, respectively, at a low magnification. There is significantly more biomass on the bare gold than on either of the coatings. Fig. 5b and c show two sections of the surface at the border between the BSA and bare gold at a higher magnification. Fig. 5e and f show the border between bare gold and casein. S. aureus cells are attached to the bare gold surface and beginning to form biofilms while the BSA and casein surfaces are still relatively uncontaminated. There were no visible edge effects in the coating materials on the surface, and the cell distribution is uniform across each individual coating. The boundaries between coatings are sharply defined and match the shape of the initial droplets that were placed on the sensor surface prior to drying.
Penicillin/streptomycin and BSA
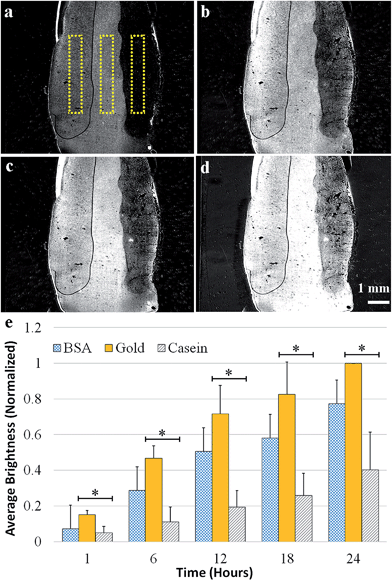
In this set of experiments, we studied the effects of a penicillin/streptomycin antibiotic cocktail as a surface coating for inhibition of P. aeruginosa and S. aureus biofilm formation. The experiments were repeated three times and the data was analyzed the same way as in the BSA/casein experiments.Fig. 6 shows the results of experiments with P. aeruginosa. The antibiotic cocktail was consistently less effective than BSA at preventing bacterial adhesion over the course of 24 hours for both species. Fig. 7a–d shows the SPRi difference images at six-hour intervals for the antibiotic and BSA coatings when they are exposed to S. aureus. For the right side of the chamber, which was coated with penicillin/streptomycin, bacterial adhesion is initially suppressed; however, the coating ceases to be effective after a few hours. After 24 hours, the area with the antibiotic coating is nearly indistinguishable from the bare gold surface. Fig. 7e shows the normalized contrast changes due to bacterial growth on different parts of the surface. The quantitative analysis shows that the difference between the antibiotic coating and the bare gold surface is not statistically different after 24 hours. It is suspected that the bacteria rapidly degraded the antibiotics as only a small dose was present on the surface versus dissolving it in the growth medium continuously.43 The antibiotics on their own did not appear to degrade, as a control SPRi experiment without bacteria showed minimal changes in brightness on the coated surface over 24 hours.
At the conclusion of the experiments, the BSA coating had 25% less biomass than the bare gold region when exposed to P. aeruginosa and 50% less biomass when exposed to S. aureus. The perceived improvement in BSA effectiveness versus the BSA/casein experiments is attributed to a slightly lower initial concentration of bacterial cells. The absolute values for the reflectivity changes on the bare gold surface, for the BSA/casein and BSA/antibiotic experiments after 24 hours, were within 10% of each other. The larger standard deviation for the S. aureus results at the 6 hour time point is the result of minor changes in initial concentration and growth rates between experiments that resulted in changes in the rate at which cells initially attached to the coatings. These variables cannot be controlled with very high precision, and the results highlight the additional issues faced when testing individual coatings in separate experiments.
Penicillin/streptomycin and casein
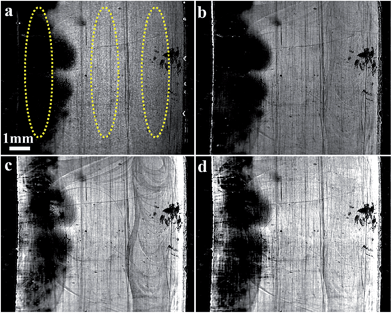
This set of experiments was conducted to directly compare the preventative effect of penicillin/streptomycin antibiotic cocktail and casein coatings on P. aeruginosa biofilm formation. The left side of the surface was coated with casein and the right side was coated with antibiotics while the center of the gold surface was not coated. Bacterial solution was placed in the chamber and the SPRi experiment was run for 24 hours. Fig. 8 show difference images generated at the surface by the SPRi sensor show much lower attachment for the section coated with casein, while the region coated with antibiotic showed almost no effect on preventing the bacterial growth (Fig. 8).Conclusion
This set of experiments demonstrates as a proof-of-concept that SPRi can be used to investigate the effects of different surface coatings on the inhibition of biofilm formation by imaging multiple coatings in a single experiment in real-time. This side-by-side comparison minimized variability between runs and increased throughput. This is important because slight variations in the starting concentration of bacteria and experimental conditions can significantly change the results, making comparisons between experiments difficult.SPRi difference images indicate that bacteria adhere the least to casein-coated gold surfaces, suggesting that casein is a better candidate than BSA as a surface coating for the prevention of P. aeruginosa and S. aureus biofilm formation. The results also show that penicillin/streptomycin solution does not have much long-term effect in the prevention of biofilm formation on a surface, as the surface was nearly indistinguishable from bare gold after 24 hours. The results of one experiment were compared against SEM images to show that the biomass surface coverage is indeed proportional to the intensity change observed with SPRi.
While only three surfaces were tested per run in these experiments, the multiplexing capabilities for coatings can be extended further by using a template to selectively pattern smaller regions on the 1 cm2 sensor area. However, care must be exercised when adjusting the size of the coated region so that there are sufficient interactions with the bacterial cells during the course of the experiment to test the antifouling properties. Further, interactions between coatings can be minimized, if needed, by using a fluidic setup consisting of multiple smaller flow channels that are fed by a single inlet.
Given that the evanescent field of the surface plasmons extends a few hundred nanometers from the surface, it is possible to coat the gold with multiple layers of coatings, creating, for example, functionalized polymer and oxide coatings for analysis. As the next step, we plan to develop standardized testing protocols that will evaluate the effectiveness of antimicrobial surface coatings exposed to varying fluid shear stress and other common pathogens.
Acknowledgements
We thank Dr Thomas J. Webster and George E. Aninwene II in the Webster Nanomedicine Lab for providing us with bacterial cultures and antibiotics, and John J. Jamieson for creating the experimental schematic. This material is based upon work supported in part by the U.S. National Science Foundation under Grant no. 1125535 and a Northeastern University Tier 1 Interdisciplinary Research Seed Grant.References
- O. Sharifahmadian, H. R. Salimijazi, M. H. Fathi, J. Mostaghimi and L. Pershin, Surf. Coat. Technol., 2013, 233, 74–79 CrossRef CAS PubMed.
- A. D. Politano, K. T. Campbell, L. H. Rosenberger and R. G. Sawyer, Surg. Infect., 2013, 14, 8–20 CrossRef PubMed.
- Z. Aziz, S. F. Abu and N. J. Chong, Burns, 2012, 38, 307–318 CrossRef CAS PubMed.
- F. Furno, K. S. Morley, B. Wong, B. L. Sharp, P. L. Arnold, S. M. Howdle, R. Bayston, P. D. Brown, P. D. Winship and H. J. Reid, J. Antimicrob. Chemother., 2004, 54, 1019–1024 CrossRef CAS PubMed.
- S. L. Castro, M. Nelman-Gonzalez, C. A. Nickerson and C. M. Ott, Appl. Environ. Microbiol., 2011, 77, 6368–6378 CrossRef CAS PubMed.
- R. Bloß and G. Kampf, J. Hosp. Infect., 2004, 56(suppl. 2), 44–48 CrossRef PubMed.
- M. Chicurel, Nature, 2000, 408, 284–286 CrossRef CAS PubMed.
- J. W. Costerton, P. S. Stewart and E. P. Greenberg, Science, 1999, 284, 1318–1322 CrossRef CAS.
- J. B. Lyczak, C. L. Cannon and G. B. Pier, Clin. Microbiol. Rev., 2002, 15, 194–222 CrossRef CAS.
- F. Ratjen and G. Doring, Lancet, 2003, 361, 681–689 CrossRef CAS.
- T. W. Lee, K. G. Brownlee, M. Denton, J. M. Littlewood and S. P. Conway, Pediatr. Pulmonol., 2004, 37, 104–110 CrossRef PubMed.
- J. B. Lyczak, C. L. Cannon and G. B. Pier, Microbes Infect., 2000, 2, 1051–1060 CrossRef CAS.
- R. T. Sadikot, T. S. Blackwell, J. W. Christman and A. S. Prince, Am. J. Respir. Crit. Care Med., 2005, 171, 1209–1223 CrossRef PubMed.
- J. N. Sheagren, N. Engl. J. Med., 1984, 310, 1368–1373 CrossRef CAS PubMed.
- F. Martineau, F. J. Picard, P. H. Roy, M. Ouellette and M. G. Bergeron, J. Clin. Microbiol., 1998, 36, 618–623 CAS.
- T. Zmantar, K. Chaieb, H. Miladi, K. Mahdouani and A. Bakhrouf, Ann. Microbiol., 2006, 56, 349–352 CrossRef CAS.
- M. A. Pfaller, R. N. Jones, G. V. Doern, H. S. Sader, K. C. Kugler and M. L. Beach, Diagn. Microbiol. Infect. Dis., 1999, 33, 283–297 CrossRef CAS.
- Y. Fang, Z. Shen, L. Li, Y. Cao, L. Y. Gu, Q. Gu, X. Q. Zhong, C. H. Yu and Y. M. Li, World J. Gastroenterol., 2010, 16, 1019–1024 CrossRef.
- C. E. Zobell and D. Q. Anderson, Biol. Bull., 1936, 71, 324–342 CrossRef.
- K. Vickery, A. Pajkos and Y. Cossart, Am. J. Infect. Control, 2004, 32, 170–176 CrossRef PubMed.
- W. L. Cochran, G. A. McFeters and P. S. Stewart, J. Appl. Microbiol., 2000, 88, 22–30 CrossRef CAS.
- P. Gilbert and A. J. McBain, Am. J. Infect. Control, 2001, 29, 252–255 CrossRef CAS PubMed.
- C. Ntsama-Essomba, S. Bouttier, M. Ramaldes, F. Dubois-Brissonnet and J. Fourniat, Vet. Res., 1997, 28, 353–363 CAS.
- N. L. P. Iorio, A. Lopes, R. P. Schuenck, A. G. Barcellos, A. N. Olendzki, G. L. Lopez and K. R. N. dos Santos, Microbiol. Immunol., 2011, 55, 28–33 CrossRef CAS PubMed.
- E. Eteshola and D. Leckband, Sens. Actuators, B, 2001, 72, 129–133 CrossRef CAS.
- K. Reimhult, K. Petersson and A. Krozer, Langmuir, 2008, 24, 8695–8700 CrossRef CAS PubMed.
- P. Ying, G. Jin and Z. Tao, Colloids Surf., B, 2004, 33, 259–263 CrossRef CAS PubMed.
- J. Sun, L. K. Schnackenberg, S. Khare, X. Yang, J. Greenhaw, W. Salminen, D. L. Mendrick and R. D. Beger, J. Chromatogr. B: Anal. Technol. Biomed. Life Sci., 2013, 932, 134–143 CrossRef CAS PubMed.
- Y. Yanase, T. Hiragun, S. Kaneko, H. J. Gould, M. W. Greaves and M. Hide, Biosens. Bioelectron., 2010, 26, 674–681 CrossRef CAS PubMed.
- L. Malic, T. Veres and M. Tabrizian, Biosens. Bioelectron., 2011, 26, 2053–2059 CrossRef CAS PubMed.
- S. Paul, P. Vadgama and A. K. Ray, IET Nanobiotechnol., 2009, 3, 71–80 CrossRef CAS PubMed.
- P. N. Abadian, C. P. Kelley and E. D. Goluch, Anal. Chem., 2014, 86, 2799–2812 CrossRef CAS PubMed.
- M. J. Linman, A. Abbas and Q. Cheng, Analyst, 2010, 135, 2759–2767 RSC.
- G. E. Aninwene, P. N. Abadian, V. Ravi, E. N. Taylor, D. M. Hall, A. Mei, G. D. Jay, E. D. Goluch and T. J. Webster, J. Biomed. Mater. Res., Part A, 2014 DOI:10.1002/jbm.a.35195.
- P. N. Abadian, N. Tandogan, J. J. Jamieson and E. D. Goluch, Biomicrofluidics, 2014, 8, 021804 CrossRef PubMed.
- P. N. Abadian, N. Tandogan, T. A. Webster and E. D. Goluch, microTAS, 2012, 2012, 413–415 Search PubMed.
- S. Bouguelia, Y. Roupioz, S. Slimani, L. Mondani, M. G. Casabona, C. Durmort, T. Vernet, R. Calemczuk and T. Livache, Lab Chip, 2013, 13, 4024–4032 RSC.
- F. Reifsteck, S. Wee and B. J. Wilkinson, J. Med. Microbiol., 1987, 24, 65–73 CrossRef CAS PubMed.
- T. Smith, J. Colloid Interface Sci., 1980, 75, 51–55 CrossRef CAS.
- J. A. Roman and V. C. Sgarbieri, Int. J. Food Sci. Technol., 2006, 41, 609–617 CrossRef CAS PubMed.
- A. Pascual, A. Fleer, N. A. C. Westerdaal and J. Verhoef, Eur. J. Clin. Microbiol., 1986, 5, 518–522 CAS.
- Y. L. Jeyachandran, E. Mielczarski, B. Rai and J. A. Mielczarski, Langmuir, 2009, 25, 11614–11620 CrossRef CAS PubMed.
- J. A. Yurchenco, M. W. Hopper and G. H. Warren, Can. J. Microbiol., 1966, 12, 35–42 CrossRef CAS PubMed.
Footnote |
| † Electronic supplementary information (ESI) available: Coating stability and bacterial cell viability testing. See DOI: 10.1039/c4ay02094d |
| This journal is © The Royal Society of Chemistry 2015 |

