DOI:
10.1039/C3AY41697F
(Communication)
Anal. Methods, 2014,
6, 62-66
A highly sensitive and selective aptasensor based on fluorescence polarization for the rapid determination of oncoprotein vascular endothelial growth factor (VEGF)
Received
2nd October 2013
, Accepted 1st November 2013
First published on 4th November 2013
Abstract
Vascular endothelial growth factor (VEGF) discrimination in blood is useful for the early diagnosis, staging, and monitoring of cancers. However, effective and efficient methods are needed to improve the diagnosis and assessment of cancer. Here, we report a DNA aptasensor based on fluorescence polarization for the detection of vascular endothelial growth factor (VEGF), a predominant biomarker of cancer angiogenesis. An anti-VEGF DNA aptamer, labeled by a single fluorescent dye at its extremity, was employed as a model functional nucleic acid probe. The DNA conformational change generated by the VEGF binding was able to induce a significant increase in the fluorescence polarization signal. In the absence of VEGF, fluorescently labeled aptamer is in a flexible single strand state, and will have a low P value of the system. Upon the addition of VEGF, it binds with its aptamer, forming a G-quadruplex aptamer–VEGF complex upon its association with the protein. This leads to a significant increase of P value, which provides the quantitative basis of the detection of VEGF. The sensor is prepared in aqueous solution, without separation and washing, and essentially reagentless. We envision that our developed aptasensor holds utilities for point-of-care cancer prognostics by incorporating simplicity in detection, low-cost for test, and required small sample volumes.
Introduction
Proteins are ubiquitous and essential for life. Detection of proteins has always been a critical and challenging task. With the increasing demands of proteomic strategies for cancer diagnosis and therapeutic analysis, development of the sensitive and facile detection of cancer-related proteins, especially oncoproteins in tumors, attracts increasing attention in the biomedical fields.1 Oncoproteins, coded by pro-oncogene to regulate cell growth and differentiation, play an important role in cancer growth and are often found over-expressed or mutated in a malignant tumor.2 The clinical analysis of oncoproteins is particularly important to early cancer diagnostic and proteomics research, which will also promote the understanding of cancer disease-related biological processes.3 Methods for the analysis of proteins have become indispensable tools in new disease-marker discovery and their function studies. Ultimately, assays that allow rapid, simple, sensitive, selective, and cost-effective detection of proteins discovered are of significant importance for the understanding, diagnosis, treatment, and prevention of many diseases.
Aptamers are nucleic acid-based molecules that can be selected to bind essentially to any molecule of choice.4 Compared with antibodies, aptamers possess more advantages over antibodies such as chemical synthesis, selection through the SELEX (systematic evolution of ligands by exponential enrichment) process, easy modification, high stability, target versatility, being easy-to-stock, and resistant to denaturation and degradation.5,6 These properties make aptamers a promising class of agents for biomolecule detection.7–9 Aptamers are single-stranded DNA or RNA molecules, which have become increasingly important tools for detection of DNA,10,11 small molecules12–14 and protein15–19 because of their capability to bind target molecules with high affinity and specificity. Single-stranded DNA can fold to induce the conformational ordering upon binding interactions or intramolecular hydrogen.20,21 In particular, the nucleic acid sequences with G-rich are able to fold into G-quadruplex, which provides an opportunity to design and develop a selective and sensitive sensor for the detection of target molecules.22
Vascular endothelial growth factor (VEGF) is a key regulator of both physiologic and pathologic angiogenesis. As its name suggests, VEGF stimulates vascular endothelial cell growth, survival, and proliferation.23 VEGF is an important biomarker for different diseases and clinical disorders. VEGF is a signaling protein that has been used as a serum biomarker for a number of human diseases, including cancer, rheumatoid arthritis, psoriasis and proliferating retinopathy. The over-expression or down-regulation of VEGF is associated with different diseases. For example, the fast growth of tumor cells and metastasis results in hypoxia-induced over-expression of VEGF which, in turn, triggers tumor blood-vessel formation for the supply of nutrients and oxygen to the cancer cells. Abnormal levels of VEGF were suggested to promote neuron degeneration by limiting neural tissue perfusion, and low levels of VEGF are associated with neurological disorders, brain injuries, and Parkinson's disease.24 Specifically, elevated levels of VEGF were observed for patients with Alzheimer's disease. Not surprisingly, VEGF finds growing interest as a therapeutic target, and its analytical detection has important implications as a biomarker for different clinical disorders or as a biomarker that follows therapeutic treatments.
Fluorescent methods have attracted most attention in the development of aptasensors owing to their non-destructiveness, rapidness, sensitivity and reproducibility. Fluorescence polarization (FP) occurs when fluorescent molecules are excited by linearly polarized light, resulting in polarized emission from the excited molecules. The extent of FP of a molecule depends on the relative values of the fluorescence lifetime and the rotational correlation time, which is proportional to the molecular volume when the temperature and viscosity of the medium are kept constant.25 If a molecule is small it will rotate faster and hence will have a smaller P value. Conversely, larger molecules will have larger P values because of their slow rotation. In particular, fluorescence polarization is not only determined by the molecular weight but also by conformation and local rotation of the fluorescence dye.26,27 Fluorescence polarization based on recognition reaction is a method that requires no separation of the reagent blank from the test media. Thus, fluorescence polarization can be used for homogeneous analysis and has the element for automation with high-throughput capability, providing a powerful tool for drug discovery, biochemical research, clinical diagnoses, and food analyses.
Experimental section
Chemicals and reagents
Oligonucleotide sequences used in this work were synthesized by Sangon Biotech Co., Ltd (Shanghai, China), and purified using high performance liquid chromatography. And the sequence of the oligonucleotide fluorescently tagged with 6-carboxyfluorescein (6-FAM): 5′-(6-FAM)-CCG TCT TCC AGA CAA GAG TGC AGG G-3′. Tris was obtained from Sinopharm Chemical Reagent Co. Ltd (Shanghai, China). Human serum albumin (HSA), thrombin (Tb) and Bovine Serum Albumin (BSA) were purchased from Sigma-Aldrich (St. Louis, Mo, USA). Milli-Q water (18.2 MΩ cm) was used throughout this study. All other reagents used in this work were of analytical grade. VEGF mentioned in this system refers to VEGF165, unless otherwise stated.
Apparatus and measurements
FP signals were measured with a time-resolved fluorescence spectrometer (HORIBA JOBIN JVON, France). The FP was monitored at 520 nm with the excitation of 494 nm at room temperature. And slits for both the excitation and emission were set at 8 nm. The optical path length of a quartz fluorescence cell was 1.0 cm.
Fluorescence polarization assay
The oligonucleotide was used as provided and diluted in 100 mM phosphate buffer solution, pH 7, and stored at 4 °C to give a stock solution of 100 μM. The working aptamer solutions were obtained by adequate dilution of the stock solution in phosphate buffer. Appropriate concentrations of aptamer solutions (10 nM) and different concentrations of VEGF solutions (in 25 mM Tris–HCl, pH 7.4, 150 mM NaCl, 50 mM KCl) were mixed. And then the mixed solutions were diluted with Tris–HCl buffer to 1000 μL. The above prepared solutions were vortexed to mix all reagents and then incubated for 30 min at room temperature before FP determination. All concentrations mentioned in this work refer to the final concentration of analyte in the samples. All experiments were repeated thrice and each sample was measured five times.
Results and discussion
Sensing mechanism
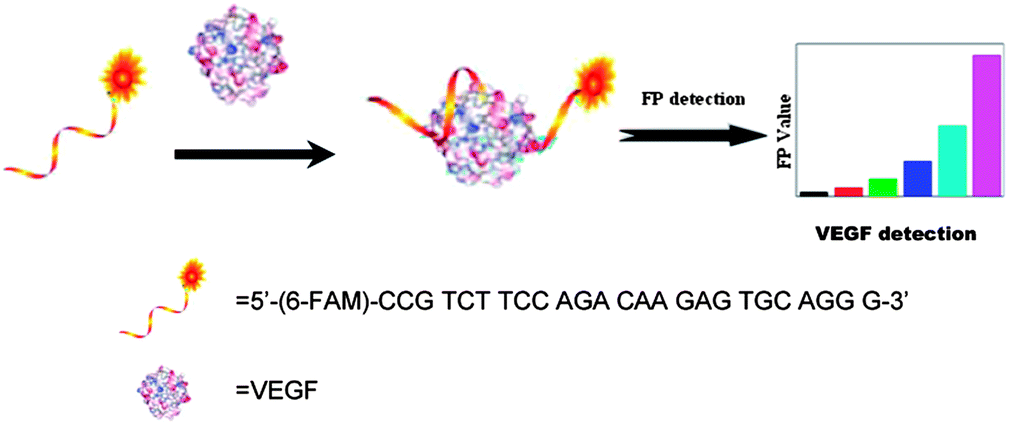
Fig. 1 outlines the sensing platform. A fluorescein (FAM) labeled SSO is used as a fluorescence probe for VEGF. In the absence of VEGF, the SSO is in a flexible single strand state. Upon addition of VEGF, target specific DNA aptamers that fold into a G-quadruplex structure were used as a target recognition unit. The anti-VEGF aptamer forms a G-quadruplex upon its association with the protein, which results in the increase of the P values. Therefore, the VEGF concentrations can be quantified by monitoring the change in the P value.
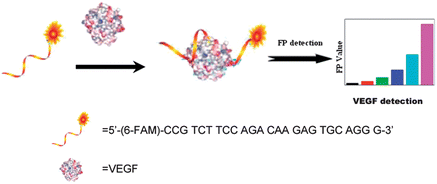 |
| | Fig. 1 Schematic demonstration of the fluorescence polarization aptasensor and the detection mechanism for VEGF. | |
The anti-VEGF aptamer forms a G-quadruplex upon its association with the protein.4 The aptamer against the VEGF165 revealed an affinity constant of ca. 2 × 10⁻⁹ M, with dissociation constants corresponding to 1.4 × 10⁻⁹ M.
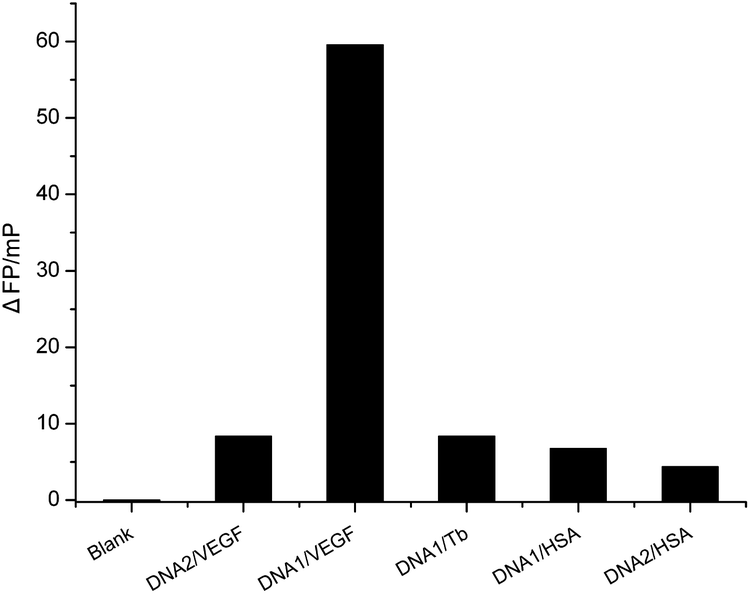
To demonstrate the proof-of-principle, the proposed FP aptasensor was employed for the detection of VEGF by using anti-VEGF aptamer DNA1 coupled with a random FAM-labeled oligonucleotide DNA2 (5′-FAM-TTG CGG AGG AAG GT-3′). We performed the aptamer assay by incubating a mixture of FAM-labeled anti-VEGF aptamer DNA1 probe (10.0 nM) and DNA2 probe (10.0 nM) with VEGF or other non-specific proteins for 30 min at room temperature, and measured the P value. Only the anti-VEGF aptamer assay leads to a significant increase of the P value upon the addition of VEGF (Fig. 2). However, control experiments performed under identical conditions but in the absence of VEGF, DNA2 probe with VEGF, DNA1 and DNA2 probes with other non-specific proteins did not show any obvious change of the FP value.
 |
| | Fig. 2 Fluorescence polarization changes of the anti-VEGF aptamer (DNA1) with a random DNA sequence (DNA2) upon addition of VEGF at a concentration of 5.0 nM or other non-specific proteins at a concentration of 5.0 nM. A blank (DNA1 without VEGF) was used as a control reference. | |
Optimization of incubating time
To study the feasibility of the VEGF sensing system, a key variable (incubating time) for measuring VEGF were optimized to obtain better analysis performance. Fig. 3 shows the time-dependent fluorescence polarization changes with VEGF at a concentration of 2.0 × 10⁻⁹ M. A time-dependent increase in the FP change is observed, consistent with the formation of the aptamer–VEGF complex. The time-dependent FP changes reach a saturation value after 30 min and represent the kinetics of formation of the equilibrium state of the aptamer–VEGF complex. Accordingly, the aptamer solutions were mixed with different concentrations of VEGF, and allowed to equilibrate for a fixed time-interval of 30 min, to yield good results. So we employed 30 min as the incubation time.
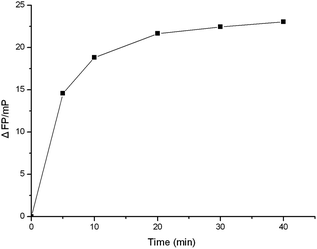 |
| | Fig. 3 Fluorescence polarization changes of the FAM-labeled aptamer by VEGF as a function of time. FAM–aptamer concentration: 10 nM; VEGF concentration: 2.0 nM. | |
Analytical performance of the aptasensor
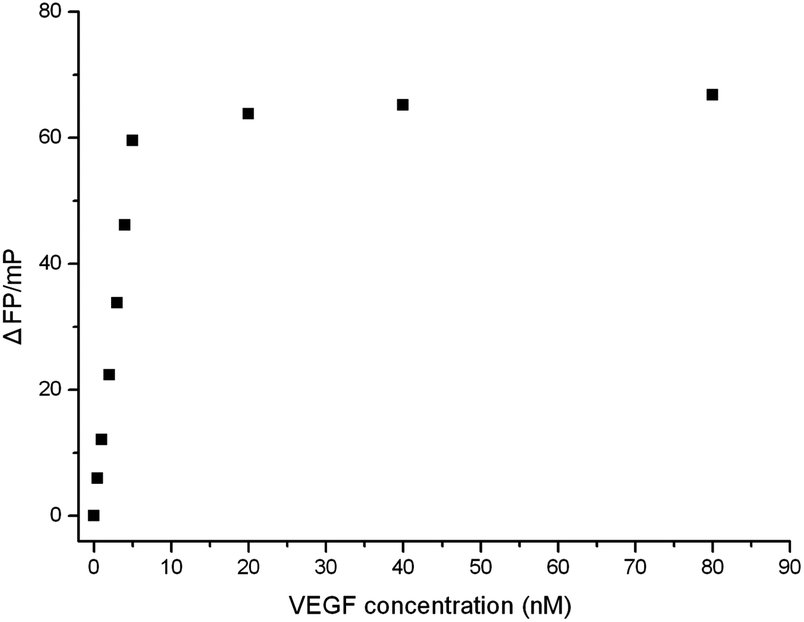
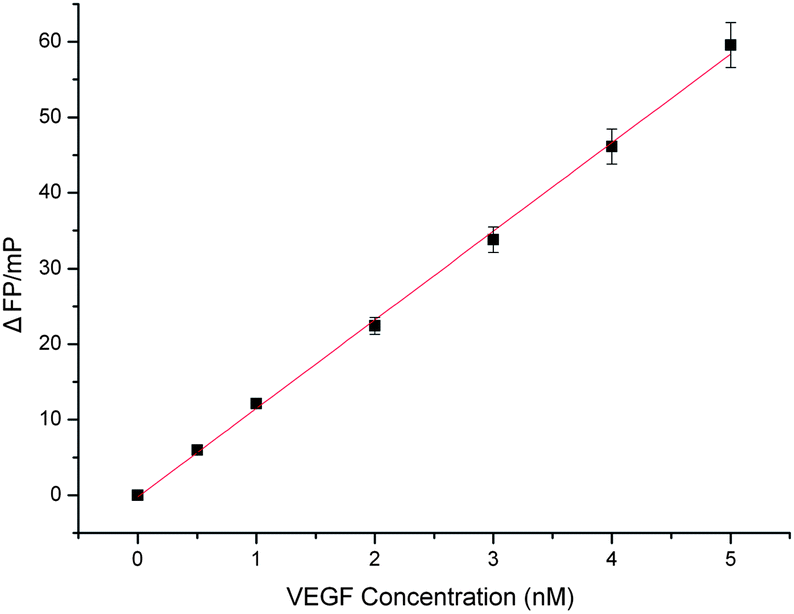
In order to investigate the sensitivity of the proposed method for target protein, the different concentrations of VEGF solutions were tested. The results are shown in Fig. 4. As the concentration of VEGF increased, the P values also increased. The typical response curve (Fig. 4) showed that the fluorescence polarization change (ΔFP) increased with increasing amount of VEGF until a plateau was reached. There was a good linear relationship between the fluorescence polarization change (ΔFP) and VEGF concentration at the low VEGF concentration in the range from 0.32 to 5.0 nM (Fig. 5). The regression equation is ΔFP = −0.21734 + 11.714C, R2 = 0.9983, where ΔFP and C are the change of fluorescence polarization and VEGF concentration (nM), respectively. On the basis of the measurement of the standard deviation of the blank solution of the FAM-labeled anti-VEGF aptamer in the absence of VEGF, the limit of detection (LOD; 3σ) was experimentally determined to be 0.32 nM,28,29 which was comparable to that of the other reported aptamer-based VEGF detection method.
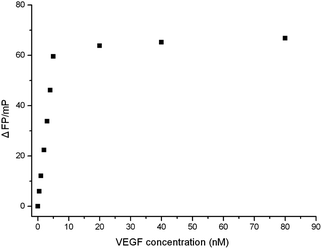 |
| | Fig. 4 Plots of fluorescence polarization changes as a function of VEGF concentrations. FAM–aptamer concentration: 10 nM; incubation time: 30 min. | |
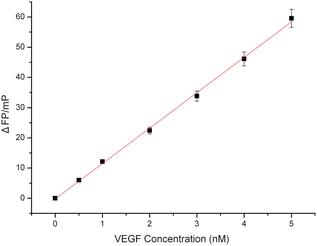 |
| | Fig. 5 The calibration curve of fluorescence polarization changes as a function of VEGF concentrations from 5.0 × 10⁻¹⁰ to 5.0 × 10⁻⁹ M. FAM–aptamer concentration: 10 nM; incubation time: 30 min. | |
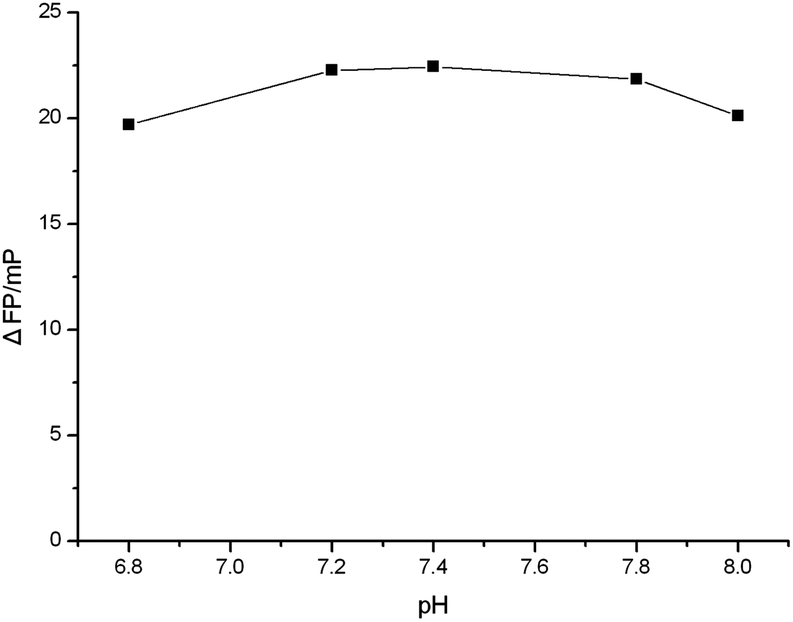
Effect of pH on the detection of VEGF
The effect of pH on the binding of the FAM–aptamer to VEGF was studied. With pH changes in the range 6.8–8.0, the fluorescence polarization change did change obviously (Fig. 6), which indicated that the pH did have a significant effect on the binding of the FAM–aptamer to VEGF. The fluorescence polarization change (ΔFP) increased when the pH value increased in the range of 6.8–7.4, which may be due to the different extents of protonation of the base pair of DNA. Then the fluorescence polarization change (ΔFP) decreased gradually when the pH was higher than 7.4. Thus, 25 mM Tris–HCl buffer (pH 7.4, 150 mM NaCl, 50 mM KCl) was used as the reaction buffer.
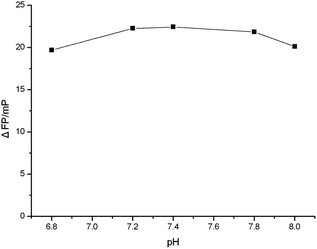 |
| | Fig. 6 Effect of the buffer pH from 6.8 to 8.0 on the fluorescence polarization change of the FAM-labeled aptamer by VEGF. FAM–aptamer concentration: 10 nM; VEGF concentration: 2.0 nM; incubation time: 30 min. | |
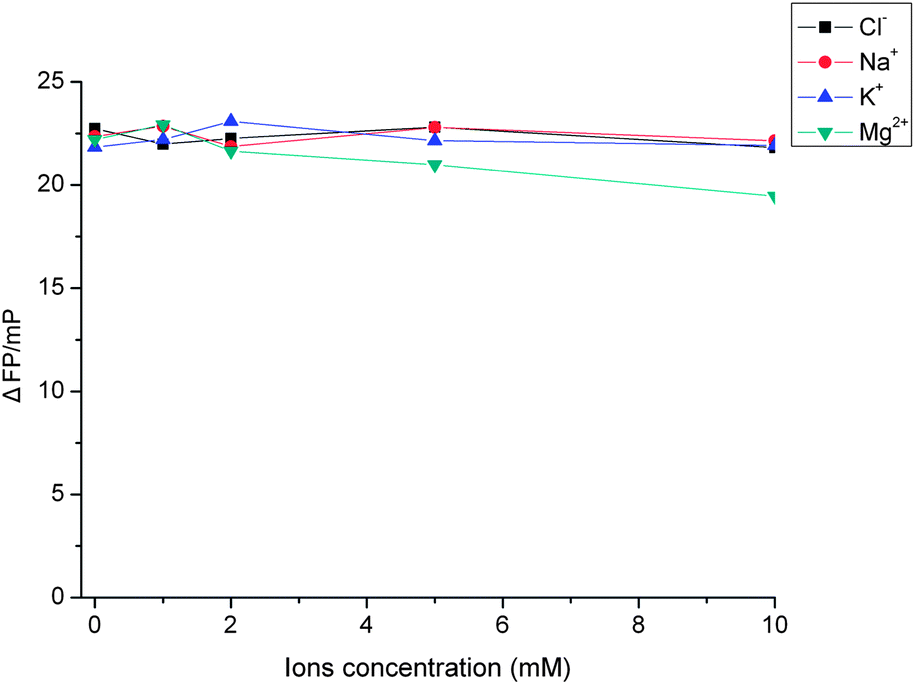
Effect of ionic strength on the detection of VEGF
The effect of ionic strength on the binding of the FAM–aptamer and VEGF was studied. As shown in Fig. 7, with an increasing amount of Cl−, Na+ and K+, the fluorescence polarization did not change obviously, which indicated that the increasing Cl−, Na+, and K+ concentrations did not have a significant effect on the detection of VEGF. But with an increasing amount of Mg2+, the fluorescence polarization decreased significantly. These results agree with some previous observations that divalent ions like Mg2+ have a stronger impact on the binding strength of aptamers to proteins, and this phenomenon is due mainly to the fact that Mg2+ has a greater affinity for the phosphate groups on the DNA backbone than does VEGF.3 In our strategy, we used a very low Mg2+ concentration (2 mM) which is not expected to have much effect on the sensitivity.
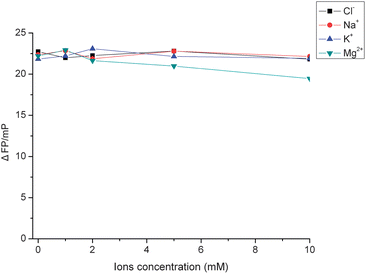 |
| | Fig. 7 Effect of ionic strength on the fluorescence polarization change of the FAM-labeled aptamer by VEGF. FAM–aptamer concentration: 10 nM; VEGF concentration: 2.0 nM; incubation time: 30 min. | |
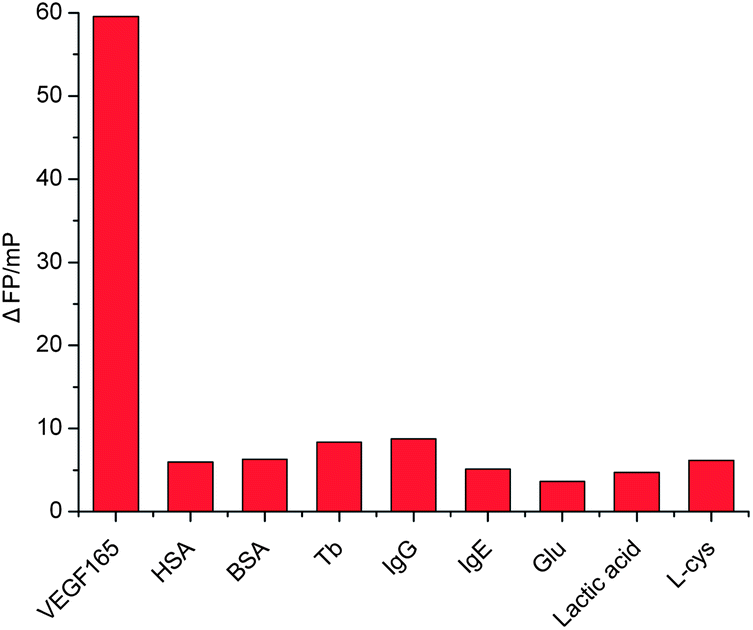
Selectivity of the VEGF aptasensor
We further demonstrate that this fluorescence polarization aptamer assay is highly selective toward VEGF. The aptasensor was challenged with nonspecific biomolecules such as human serum albumin (HSA), thrombin (Tb), bovine serum albumin (BSA), immunoglobulin G (IgG), immunoglobulin E (IgE), glutamic acid (Glu), lactic acid, L-cysteine (L-cys), as well as with the analyte of interest, VEGF. Fig. 8 depicts the SSO FP-based assay upon incubation with 8 interference components of high concentration (0.5 μM) and VEGF (5 nM). The results indicated that no significant fluorescence polarization change was observed in the presence of nonspecific biomolecules. Clearly, VEGF can be easily differentiated when all the other interference components are present with a 100-fold higher concentration.
 |
| | Fig. 8 Fluorescence polarization changes of the aptamer toward VEGF and other non-specific biomolecules. FAM–aptamer concentration: 10 nM; VEGF concentration: 5.0 nM; other non-specific component concentration: 500 nM; incubation time: 30 min. | |
Real sample analysis
To investigate whether the method was applicable to real samples, we tested spiked serum samples with different VEGF concentrations and the results are presented in Table 1. We achieved recoveries of around 101.5% for spiked samples by the present approach. As shown in Table 1, the recoveries were between 95.8% and 107.5% when using this method, which shows a satisfactory result. These results imply that this method has a promising feature for analytical applications in complex biological samples.
Table 1 Results for the determination of VEGF165 in human serum samples
| Serum sample |
Added (nM) |
Found (nM) |
RSD (%, n = 4) |
Recoveries (%) |
| 1 |
1 |
1.054 |
2.9 |
105.4 |
| 2 |
0.8 |
0.766 |
3.7 |
95.8 |
| 3 |
0.4 |
0.389 |
4.2 |
97.3 |
| 4 |
0.2 |
0.215 |
4.6 |
107.5 |
Conclusions
We report, for the first time, an aptasensor based on fluorescence polarization for rapid and sensitive detection of VEGF, a prominent biomarker associated with various disease states. Since the fluorescence polarization signaling mechanism is linked to a target-induced conformational change of the aptamer probe, the sensor is thus highly resistive to nonspecific binding of matrix contaminants. In comparison, the present method is much simpler, easier to use, and less expensive as it only requires attaching a single fluorescent dye to an aptamer extremity. In addition, the ratiometric nature of the FP technique allows reduction of some drawbacks of the fluorescence intensity-based assays, such as bleaching and non-uniform emission of the fluorophore. Lastly, we have also demonstrated that this approach is well-suited to be implemented as a cost-effective, single-use biosensor for disease diagnosis and therapy monitoring.
Notes and references
- H. Kitano, Science, 2002, 295, 1662–1664 CrossRef CAS PubMed.
- X. H. Fang, Z. H. Cao, T. Beck and W. H. Tan, Anal. Chem., 2001, 73, 5752–5757 CrossRef CAS.
- J. F. Liang, R. Wei, S. He, Y. K. Liu, L. Guo and L. D. Li, Analyst, 2013, 138, 1726–1732 RSC.
- C. Tuerk and L. Gold, Science, 1990, 249, 505–510 Search PubMed; A. D. Ellington and J. W. Szostak, Nature, 1990, 346, 818–822 CrossRef CAS PubMed.
- S. Song, L. Wang, J. Li, J. Zhao and C. Fan, TrAC, Trends Anal. Chem., 2008, 27, 108–117 CrossRef CAS PubMed.
- T. G. Drummond, M. G. Hill and J. K. Barton, Nat. Biotechnol., 2003, 21, 1192–1199 CrossRef CAS PubMed.
- A. B. Iliuk, L. H. Hu and W. A. Tao, Anal. Chem., 2011, 83, 4440–4452 CrossRef CAS PubMed.
- K. Sefah, J. A. Phillips, X. L. Xiong, L. Meng, D. V. Simaeys, H. Chen, J. Martin and W. H. Tan, Analyst, 2009, 134, 1765–1775 RSC.
- X. Su, X. J. Xiao, C. Zhang and M. P. Zhao, Appl. Spectrosc., 2012, 66, 1249–1261 CrossRef CAS PubMed.
- M. Zhang, Y. M. Guan and B. C. Ye, Chem. Commun., 2011, 47, 3478–3480 RSC.
- R. Freeman, X. Q. Liu and I. Willner, J. Am. Chem. Soc., 2011, 133, 11597–11604 CrossRef CAS PubMed.
- D. L. Liao, H. P. Jiao, B. Wang, Q. Lin and C. Yu, Analyst, 2012, 137, 978–982 RSC.
- D. D. Nie, H. Y. Wu, Q. S. Zheng, L. Q. Guo, P. R. Ye, Y. L. Hao, Y. N. Li, F. F. Fu and Y. H. Guo, Chem. Commun., 2012, 48, 1150–1152 RSC.
- A. E. Radi and C. K. O'Sullivan, Chem. Commun., 2006, 3432–3434 RSC.
- Z. Z. Zhang and C. Y. Zhang, Anal. Chem., 2012, 84, 1623–1629 CrossRef CAS PubMed.
- X. Y. Zhang, Z. L. Zhao, H. C. Mei, Y. P. Qiao, Q. L. Liu, W. X. Luo, T. Xia and X. H. Fang, Analyst, 2011, 136, 4764–4769 RSC.
- X. L. Luo, I. Lee, J. Y. Huang, M. H. Yun and X. T. Cui, Chem. Commun., 2011, 47, 6368–6370 RSC.
- B. Wang and C. Yu, Angew. Chem., Int. Ed., 2010, 49, 1485–1488 CrossRef CAS PubMed.
- D. Rotem, L. Jayasinghe, M. Salichou and H. Bayley, J. Am. Chem. Soc., 2012, 134, 2781–2787 CrossRef CAS PubMed.
- J. T. Davis, Angew. Chem., Int. Ed., 2004, 43, 668–698 CrossRef CAS PubMed.
- F. He, Y. Tang, S. Wang, Y. Li and D. Zhu, J. Am. Chem. Soc., 2005, 127, 14286–14287 Search PubMed.
- J. A. Walmsley and J. F. Burnett, Biochemistry, 1999, 38, 14063–14068 CrossRef CAS PubMed.
- S. Zhao, W. W. Yang and R. Y. Lai, Biosens. Bioelectron., 2011, 26, 2442–2447 CrossRef CAS PubMed.
- R. Freeman, J. Girsh, A. F.-J. Jou, J.-A. A. Ho, T. Hug, J. Dernedde and I. Willner, Anal. Chem., 2012, 84, 6192–6198 CrossRef CAS PubMed.
- J. Ruta, S. Perrier, C. Ravelet, J. Fize and E. Peyrin, Anal. Chem., 2009, 81, 7468–7473 CrossRef CAS PubMed.
- H. L. Wang, M. L. Lu, M.-S. Tang, B. V. Houten, J. B. Alexander Ross, M. Weinfeld and X. Chris Le, Proc. Natl. Acad. Sci. U. S. A., 2009, 106, 12849–12854 CrossRef CAS PubMed.
- D. P. Zhang, M. L. Lu and H. L. Wang, J. Am. Chem. Soc., 2011, 133, 9188–9191 CrossRef CAS PubMed.
- S. J. Zhen, L. Q. Chen, S. J. Xiao, Y. F. Li, P. P. Hu, L. Zhan, L. Peng, E. Q. Song and C. Z. Huang, Anal. Chem., 2010, 82, 8432–8437 CrossRef CAS PubMed.
- C. S. Zhou, Y. X. Jiang, S. Hou, B. C. Ma, X. H. Fang and M. L. Li, Anal. Bioanal. Chem., 2006, 384, 1175–1180 CrossRef CAS PubMed.
|
| This journal is © The Royal Society of Chemistry 2014 |
Click here to see how this site uses Cookies. View our privacy policy here.