DOI:
10.1039/C3AY41567H
(Paper)
Anal. Methods, 2014,
6, 102-106
Exact matching strategies for generalised sequential standard addition calibration
Received
9th September 2013
, Accepted 1st November 2013
First published on 4th November 2013
Abstract
A novel strategy for calibration using an exact matching form of generalised sequential standard addition is presented. The method has advantages for high throughput techniques using auto-sampling where the best repeatability for removal and delivery of solutions is obtained when a single volume setting is considered throughout. The mathematical characteristics of the procedure have been fully described and the benefits of taking large sample portions, because of the ability to then perform repeat analytical measurements, has been assessed. The method has been demonstrated using synthetic samples of mercury in dichromate of the type resulting from sampling from a stationary source. When a large number of repeated measurements were performed the precision determined was observed to be poorer than predicted theoretically; this is ascribed to drift in the analytical system over extended timescales.
1. Introduction
Calibration is an essential part of quantification in analytical chemistry for all but primary methods.1 A working curve approach is usually preferred because in most cases the precision obtained by interpolation of unknown measurements between fixed reference points is better than using extrapolation techniques. Extrapolation techniques for calibration, such as standard addition, are usually required when the matrix of the sample differs from that of the calibration standards and the analytical technique employed is sensitive to the matrix.2 Both working curve calibration and conventional (or fixed volume) standard addition calibration (C-SAC) involve the preparation of a number of solutions in separate containers. Sequential (or variable volume) standard addition calibration (S-SAC) uses only one container, and relies on adding the calibration standard into the same container as the unknown sample.3 The simplicity of S-SAC lends itself to use in automated and high-throughput applications. In fact, it is such an efficient method that it is often used as a quantification strategy even when the analytical technique is matrix insensitive. Until recently the use of S-SAC was limited to non-destructive analytical techniques (such as stripping voltammetry or spectroscopic methods). However, the recent solution of the generalised S-SAC condition has shown that S-SAC using one point addition may be used for destructive analytical techniques.4 We present here the first practical use of this calibration technique for the measurement, by cold vapour atomic fluorescence spectrometry, of mercury collected from stationary source emissions in impinger solutions. In a further innovation we employ an ‘exact matching’ strategy where the volume of sample (destructively) analysed is the same as the volume of standard solution added post-analysis. This strategy is favourable because solution movement on such automated analytical systems via peristaltic pumps produce volume flow rates that are highly repeatable at a given pump speed but may not be linear across different pump speeds. Furthermore, because changes in pump speed may occur as the pump starts and stops, fixed pumping times are preferable to avoid the possibility that changes may have a variable effect on the total volume delivered as the pumping time varies. Therefore the use of one pump speed for a fixed time is ideal as the volume delivered may be calibrated easily and when used throughout the subsequent analyses can dramatically reduce the uncertainty associated with variability in the volume of solution analysed.
2. Experimental
All experimentation was conducted in an air conditioned laboratory (20 ± 2 °C). Ultra-pure analytical grade reagents were used throughout (Fisher, UK) and solutions were made up in thoroughly cleaned polypropylene-ware with deionised water (18.2 MΩ cm, MilliQ, Millipore). The calibration technique described in this paper has been experimentally tested using a synthetic sample of mercury at (0.100 ± 0.001) ng mL−1 dissolved in dichromate impinger solutions (0.04 g g−1 K2Cr2O7 in 0.2 g g−1 HNO3) as would be obtained from sampling according to EN 13211.5 The analysis was performed using NPL's ISO 17025 accredited in-house method based on the requirements on EN 13211 and in turn those of EN 1483,6 using reductive desorption with SnCl2 (0.02 g g−1 SnCl2 in 0.1 g g−1 HCl) and a stream of argon (99.999%, BOC) bubbled through the solution and then measurement with cold vapour atomic fluorescence spectroscopy (PS Analytical, Millennium Merlin). Quantification was performed using a standard of mercury in 0.05 g g−1 HCl at a concentration of (1.00 ± 0.01) ng mL−1. The standard was prepared traceably to NIST SRM 3133 to within 1% (relative) accuracy. However, because the measurements presented in this study are relative and use the same calibration solution for quantification throughout, the absolute accuracy of the measurement is not important. All measurements were blank corrected, although the blank levels observed were never greater than 1% (relative) of the total analytical signal. A blank solution of 0.05 g g−1 HCl was analysed twice between each sample measurement in order to avoid memory effects. The method used has been validated down to very low concentrations using certified reference material BCR-579 (Hg in coastal seawater, certified at 1.9 ng kg−1) and at expected sample concentrations by comparative analysis to established ICP-MS techniques using real samples obtained from a waste incineration plant in the south of the United Kingdom.
3. Results and discussion
3.1 Theoretical considerations
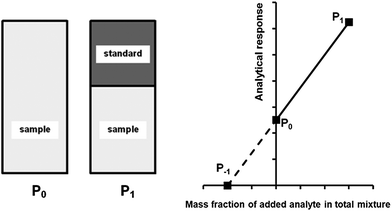
A generalised one-point standard addition methodology is considered which, as described by Thompson and Ellison,7 can be more precise than the use of multiple standard additions. Further, in this study we examine the exact matching case of the generalised sequential standard addition case summarised in Fig. 1. Consider that a sample of known mass but unknown analyte content is placed in a vessel. A portion of sample is then removed or consumed during an analysis step from which an analyser response is obtained, yielding P0 in Fig. 1. A known mass of a standard solution of known analyte content is then added to the portion of the unknown sample remaining following the initial analysis, complete mixing is assumed, and a further measurement is made, yielding P1. An extrapolation of the line joining points P0 and P1 to its intercept with the x-axis is then performed, yielding P−1. Hence, the fully generalised case where the analytical process consumes sample during analysis yields the coordinates of the three points in Fig. 1, assuming an analyser sensitivity of unity, as:| |  | (2) |
| |  | (3) |
where: ms is the mass of the unknown sample, ma is the mass of the standard solution added, mj is the mass of the portion of the unknown sample removed for analysis, xs is the fractional content of target analyte in the unknown sample, xa is the fractional content of target analyte in the standard solution, xs(meas) is the fractional content of target analyte in the unknown sample determined directly by extrapolation, prior to correction.
m
j is considered to represent the mass of sample removed or consumed during analysis and not returned to the analysis vessel. (When mj = 0 this represents the previously described form of S-SAC where sample is not consumed by the analysis procedure4). We now consider the special exact matching case where ma = mj. Whilst this does not affect P0 or P−1, this yields the novel result:
| |  | (4) |
 |
| | Fig. 1 Generalised diagrammatic description of one-point exact-matching sequential standard addition calibration. The left hand side of the diagram shows the representative composition of the samples measured to obtain points P0 and P1 on the graph on the right hand side. The right hand side shows analyser response against the mass fraction of added analyte in the total mixture. P0 represents the analysis of the unknown sample. P1 represents the analysis of the unknown sample, minus the quantity of sample removed at P0, plus an addition of standard. The calibration relationship generated between these two points (solid line) is extrapolated to its intercept with the x-axis (broken line) at P−1 whose x-coordinate is related to the content of analyte in the unknown sample. | |
In this special case of generalised S-SAC the solutions measured at each stage have a constant mass: a property usually only associated with C-SAC strategies. As with the generalised S-SAC strategy3 the real fractional content of analyte in the unknown is given by:
| |  | (5) |
which accounts for the systematic bias of extrapolation associated with the gradient,
![[V with combining dot above]](https://www.rsc.org/images/entities/i_char_0056_0307.gif)
, varying as:
| |  | (6) |
The precision of the extrapolation of the calibration relationship to its intercept with the x-axis, σ, relative to the precision of measurement points in the y-direction, σy, is given by:3
| |  | (7) |
where
n is the number of measurement points,
ȳ and
![[x with combining macron]](https://www.rsc.org/images/entities/i_char_0078_0304.gif)
are the average values of the
y- and
x-components, respectively, over all points and
xn is the value of the
x-component at point
Pn. If we consider that
ma/
ms =
k and
xa/
xs =
r, and further normalise the masses to
xs,
eqn (2) and
(4) reduce to:
which, substituting into
eqn (7), yields:
| |  | (10) |
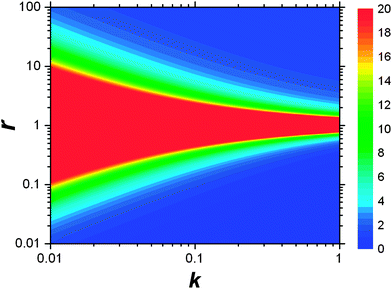
This result allows the dependence of σ/σy on r and k to be explored, which is shown in Fig. 2. It is clear that for small k it is necessary for r to be large (or small, should we wish to consider standard dilution) in order to achieve acceptably low values for σ/σy. However, as k increases, acceptably low values for σ/σy may be achieved with much smaller values of r. Although the composition of samples to be measured is unknown by definition, in most cases it is expected that r > 20 and so acceptable precisions are obtained for k > 0.2. As previously discussed the precision becomes very large as r → 1 because the gradient becomes very shallow (see eqn (6)) resulting in very lengthy and low precision extrapolations. Under these circumstances it may be preferable to perform a quantification calculation based only on analytical intensities – the conditions under which this is preferable are described elsewhere.8 Furthermore, as previously noted,4 when k = 1, representing a situation where the entire sample is used for analysis prior to any standard being added, the measurement points and extrapolation precision reduce to:
| |  | (13) |
 |
| | Fig. 2 Dependency of σ/σy on k and r. Values of σ/σy vary as indicated by the key at the side of the chart, from maximum values of infinity when r = 1, to minimum values of 0.01 in the bottom right-hand corner and 1.02 in the top right-hand corner. The colour at the middle of the chart indicates all values of σ/σy ≥ 20. | |
This limiting case represents the minimum σ/σy that may be achieved for any given r. Moreover when k = 1, σ/σy is only dependent on r, as a direct consequence of P1 depending only on r and not on k. In this situation, rather than performing a S-SAC extrapolation and subsequent correction, the sample content is of course more simply given directly by xs = xaIs/Ia (where Is and Ia are the analyser responses for measurements corresponding to P0 and P1, respectively). This limiting case represents, in effect, a (blank corrected) one-point working curve calibration method and not a standard addition methodology.
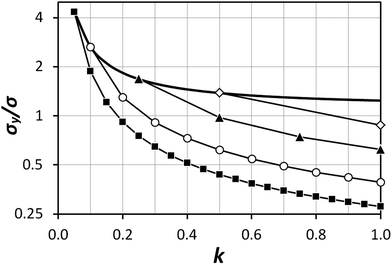
The exact matching case of S-SAC displays another interesting characteristic: it may be possible to perform repeat analyses on the mass, mj, of sample removed. Assuming we are operating in a heteroscedastic regime (well above the detection limit and above the influence of the blank content) this means that an additional  decrease in precision may be obtained by calculating the standard error of the mean from N repeat analyses performed on the mass of sample mj. The number of possible repeat analyses is a function of the minimum mass required for analysis and the total mass removed at each stage of the procedure. The additional
  benefit for a variety of minimum sample analysis sizes is shown in Fig. 3 showing the significant improvements in precision that can be obtained with multiple repeat measurements at high values of k.
 |
| | Fig. 3 Dependency of σ/σy on k, when r = 10, for a variety of minimum sample analysis sizes providing a consequential  benefit of repeat analysis over and above the base case (solid line) considering no repeat measurements. The markers indicate possible individual situations for minimum sample analysis sizes of: 0.05k (solid squares – allowing a maximum of 20 repeat measurements when k = 1), 0.1k (empty circles – maximum of 10 repeat measurements), 0.25k (solid triangles – maximum of four repeat measurements), and 0.5k (empty diamonds – maximum of 2 repeat measurements). benefit of repeat analysis over and above the base case (solid line) considering no repeat measurements. The markers indicate possible individual situations for minimum sample analysis sizes of: 0.05k (solid squares – allowing a maximum of 20 repeat measurements when k = 1), 0.1k (empty circles – maximum of 10 repeat measurements), 0.25k (solid triangles – maximum of four repeat measurements), and 0.5k (empty diamonds – maximum of 2 repeat measurements). | |
3.2 Experimental demonstration
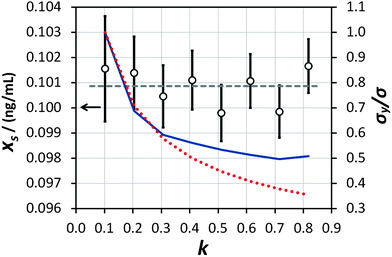
This procedure has been demonstrated on the sample described in the experimental section with (using mass concentration and mass units) xs = 0.01 ng mL−1, xa = 0.1 ng mL−1, ms = 10 g, and a minimum analytical mass of 1.022 g. In reality the maximum value of mj was approximately 8.5 g because the auto-sampler probe did not reach deeply enough into the sample vessel to remove the remaining solution, allowing a maximum of eight repeat measurements and letting k vary between 0.102 and 0.816 in steps of 0.102. The results of the trial are shown in Fig. 4. The ensemble of analysis results obtained at the various values of k are self-consistent with the uncertainty of the measurement, although there is some suggestion of a greater scatter of results at higher k. The average value obtained, 0.1009 ng mL−1, also agrees with the concentration of mercury in the synthetic solution of (0.100 ± 0.001) ng mL−1, within the uncertainty of the measurement. This provides good confidence that the average value of analytical determination does not depend on k, as expected. It is also observed that the value of σ/σy decreases with increasing k, but that the predicted values (from eqn (10) and including also the  benefit) and the observed values, which initially show very good agreement with theoretical prediction, begin to diverge above about k = 0.3. Indeed the observed values of σ/σy appear to experience a noise floor at about half of the value observed at k = 0.102. This strongly suggests that the analytical process is subject to drift on timescales required for in excess of three repeat analytical measurements (approximately seven measurements in all once the blank washes between samples are considered). This observation needs to be considered in future when strategies to implement this analysis procedure and calculate uncertainty budgets are promulgated, and should be more accurately assessed using Allan variance techniques.9
 |
| | Fig. 4 Results of the measurement of the ‘unknown sample’ (empty circles, left-hand axis) at various values of k and with analogously varying numbers of repeat measurements. The horizontal dashed line represents the average of the eight determinations. The uncertainty bars represent the expanded uncertainty (including the precision of extrapolation and the standard error of the mean of repeat measurements) giving a level of confidence of approximately 95%. The expected (red dotted line) and actually obtained (blue solid line) values of σ/σy, normalised to the value obtained at k = 0.102, are shown on the right-hand axis. | |
4. Conclusions
The exact matching form of the generalised sequential standard addition calibration method has been shown to yield acceptable precisions of extrapolation for situations where the calibration standard is at least 20 times more concentrated than the sample such that r > 20 and when at least 20% of the sample is consumed during analysis and replaced with standard. The difficulty in applying these guidelines in reality is the lack of prior knowledge of the exact sample composition in advance, and the lack of opportunity to tailor the calibration standard concentration following an approximate measurement of the sample composition because of the high throughput nature of these analyses. Just like in other forms of sequential standard addition calibration it is best practice to use much higher concentration standards that are actually required (for instance in excess of 100 times the concentration of the sample) in order to err on the side of higher precision. The demonstration of this method on a real sample shows that no systematic bias in extrapolation occurs across the range of sample sizes analysed. However, there was some evidence of drift in the test analytical system which meant that the precisions predicted from the mathematical description of the techniques were not achieved in practice. It is clear that such practical considerations must be properly determined for each measurement system and account of these will have to be taken along with the theoretical description when defining the optimum analysis strategy. The presence of drift in the test system does emphasise the utility of single point calibration strategies, of the type described here, where sample and sample-standard mixtures can be measured alternately and in close temporal proximity to each other, thereby minimising the effects of drift.
Acknowledgements
The research leading to these results has received funding from the European Union on the basis of decision no. 912/2009/EC. The funding by the UK Department for Business Innovation and Skills and the National Measurement System's Chemical and Biological Metrology Programme is gratefully acknowledged. The penultimate author was supported by a National Research Foundation of Korea (NRF) grant funded by the Ministry of Education, Science and Technology (MEST) (no. 2009-0093848).
References
-
J. C. Miller and J. N. Miller, Statistics for Analytical Chemistry, Ellis Horwood Ltd., Chichester, 1993, 3rd edn Search PubMed.
- A.-L. Hauswaldt, O. Rienitz, R. Jahrling, N. Fischer, D. Schiel, G. Labarraque and B. Magnusson, Uncertainty of standard addition experiments: a novel approach to include the uncertainty associated with the standard in the model equation, Accredit. Qual. Assur., 2012, 17, 129–138 CrossRef.
- R. J. C. Brown, M. R. Roberts and M. J. T. Milton, Systematic error arising from ‘sequential’ standard addition calibrations: quantification and correction, Anal. Chim. Acta, 2007, 587, 158–163 CrossRef CAS PubMed.
- R. J. C. Brown and T. P. S. Gilham, On the generalised case of sequential standard addition calibration, Chemom. Intell. Lab. Syst., 2012, 110, 97–101 CrossRef CAS PubMed.
-
European Committee for Standardisation, EN 13211:2001, Air quality – stationary source emissions. Manual method of determination of the concentration of total mercury, CEN, Brussels, 2001 Search PubMed.
-
European Committee for Standardisation, EN 1483:2007, Water quality – determination of mercury – method using atomic absorption spectrometry, CEN, Brussels, 2007 Search PubMed.
- S. L. R. Ellison and M. Thompson, Standard additions: myth and reality, Analyst, 2008, 133, 992–997 RSC.
- R. J. C. Brown and T. P. S. Gilham, Comparison of quantification strategies for one-point standard addition calibration: the homoscedastic case, Anal. Chim. Acta, 2012, 716, 108–111 CrossRef CAS PubMed.
- R. J. C. Brown and D. J. L. Brett, Microelectrode voltammetry as a high accuracy method for determination of diffusion coefficients, Microchim. Acta, 2009, 164, 337–344 CrossRef CAS.
|
| This journal is © The Royal Society of Chemistry 2014 |
Click here to see how this site uses Cookies. View our privacy policy here. 


![[V with combining dot above]](https://www.rsc.org/images/entities/i_char_0056_0307.gif) , varying as:
, varying as:

![[x with combining macron]](https://www.rsc.org/images/entities/i_char_0078_0304.gif) are the average values of the y- and x-components, respectively, over all points and xn is the value of the x-component at point Pn. If we consider that ma/ms = k and xa/xs = r, and further normalise the masses to xs, eqn (2) and (4) reduce to:
are the average values of the y- and x-components, respectively, over all points and xn is the value of the x-component at point Pn. If we consider that ma/ms = k and xa/xs = r, and further normalise the masses to xs, eqn (2) and (4) reduce to:

 decrease in precision may be obtained by calculating the standard error of the mean from N repeat analyses performed on the mass of sample mj. The number of possible repeat analyses is a function of the minimum mass required for analysis and the total mass removed at each stage of the procedure. The additional
  benefit for a variety of minimum sample analysis sizes is shown in Fig. 3 showing the significant improvements in precision that can be obtained with multiple repeat measurements at high values of k.
 benefit) and the observed values, which initially show very good agreement with theoretical prediction, begin to diverge above about k = 0.3. Indeed the observed values of σ/σy appear to experience a noise floor at about half of the value observed at k = 0.102. This strongly suggests that the analytical process is subject to drift on timescales required for in excess of three repeat analytical measurements (approximately seven measurements in all once the blank washes between samples are considered). This observation needs to be considered in future when strategies to implement this analysis procedure and calculate uncertainty budgets are promulgated, and should be more accurately assessed using Allan variance techniques.9


