A graphene-coated magnetic nanocomposite for the enrichment of fourteen pesticides in tomato and rape samples prior to their determination by gas chromatography-mass spectrometry
Lu
Wang
,
Xiaohuan
Zang
,
Qingyun
Chang
,
Chun
Wang
and
Zhi
Wang
*
College of Science, Agricultural University of Hebei, Baoding 071001, Hebei, China. E-mail: wangzhi@hebau.edu.cn; zhiwang2013@aliyun.com; Fax: +86-312-7521513; Tel: +86-312-7521513
First published on 29th October 2013
Abstract
A graphene-based magnetic nanocomposite (Fe3O4@SiO2–G) was synthesized and used as the adsorbent for the extraction of fourteen pesticides in tomato and rape samples prior to their gas chromatography-mass spectrometry (GC-MS) detection. Various experimental parameters affecting the extraction efficiencies, such as the amount of Fe3O4@SiO2–G, extraction time, the pH and salt concentration of the sample solution and desorption conditions were investigated. Under optimized experimental conditions, good linearity existed in the range of 1.0–100.0 ng g−1 for all the analytes with the correlation coefficients (r) ranging from 0.9972 to 0.9996. The limits of detection (S/N = 3) of the method for the compounds were between 0.005 and 0.030 ng g−1 for the vegetable samples. Good reproducibilities were obtained with the relative standard deviations (RSDs) below 12.5% (n = 5). The recoveries of the method were in the range between 83.2% and 110.3%.
Introduction
Pesticides are widely used in farming to control crop pests and reduce weeds, thereby improving the crop yield and ensuring the quality of crop production. However, the widespread use of the pesticides in agriculture could cause extensive pollution to the environment and pose potential risk to human health. In recent years, organophosphorus (OPs), pyrethroid (PYR), triazole and other pesticides have been widely used and therefore their residues may be present in our environment, including water, soil, agricultural products and food. Due to their persistence in soil and water as well as their toxicity,1–5 they have caused serious concerns about their potential harmful effects on ecosystems and have been classified as persistent organic pollutants.6 Therefore, developing a fast, simple and sensitive method to monitor the pesticide residues in fruits and vegetables is very desirable.Sample preparation for the effective extraction of the analytes from a sample matrix is a necessary and important step in the whole analytical process. In recent years, magnetic solid-phase extraction (MSPE) as a relatively new mode of solid-phase extraction (SPE) has received much attention in sample pretreatment.7–11 MSPE is based on the use of magnetic or magnetizable adsorbents with high adsorption ability and superparamagnetism. Unlike the traditional SPE, the magnetic adsorbents do not need to be packed into a SPE cartridge but are dispersed in a sample solution or suspension. The adsorbent can be readily isolated from the sample solution with a magnet and the column blocking problems during extraction can be avoided. In addition, it can facilitate the mass transfer of the analytes by drastically increasing the contact area between the solid adsorbent and sample solution, thus reducing the extraction time.7
In MSPE, an appropriate magnetic adsorbent is crucial for the efficient extraction of the analytes. Magnetic nano-sorbents have been proved to be especially effective as a result of their high specific surface area and highly active surface sites.12 Carbon nanostructured materials, due to their large surface area and excellent adsorption capacity, have been successfully used as the MSPE adsorbent for the extraction of some organic compounds.13
Graphene oxide (GO), also called graphite oxide sheet, is a two dimensional nanomaterial prepared from chemical oxidation of natural graphite.14 GO can be well-dispersed in water due to its abundant hydrophilic groups, such as hydroxyl, epoxide and carboxylic groups, on its surface.15 Furthermore, GO has emerged as a precursor offering the potential of cost-effective and large-scale production of graphene-based materials.16 Graphene (G), an atomically thin honeycomb lattice of carbon atoms, has received a tremendous amount of research attention in recent years because of its large surface area (theoretical value of 2360 m2 g−1), chemical stability and high electrical conductivity. In contrast, G is an electron-rich, hydrophobic nanomaterial with a large delocalized π-electron system.17 This endows G with a strong affinity for carbon-based ring structures, which could possibly allow its use as a good adsorbent.18,19 In recent years, G has been used as the adsorbent in solid-phase extraction (SPE),20 solid-phase microextraction (SPME),21 matrix solid-phase dispersion (MSPD),22 micro-solid-phase extraction (μ-SPE)23 and magnetic solid-phase extraction (MSPE).24
The introduction of magnetic properties into G could combine the high adsorption capacity of G with the separation convenience of the magnetic materials. A few magnetic G-based materials have been prepared for the removal or enrichment of some contaminants from different samples. For example, Wu et al. prepared a G-based magnetic nanocomposite by the in situ chemical coprecipitation method and used it for the extraction of carbamate pesticides from environmental water samples.25 A Fe3O4/graphene oxide (GO) nanocomposite has been synthesized by an electrostatic self-assembly approach and used for the preconcentration of polycyclic aromatic hydrocarbons from environmental samples.26 Shi et al. have fabricated magnetic G by a simple hydrothermal reaction and used it for the adsorption of small molecules.27 However, there have been some problems when these composites were used as adsorbents. The Fe3O4 nanoparticles (NPs) were attached to a G layer only by physical adsorption or electrostatic interaction, and they may be easily leached out from the G sheets during application.28 The magnetic Fe3O4 particles were exposed and might be oxidized and therefore could lose their magnetism under harsh experimental conditions and repeated use.29 To solve the above problems, a suitable protective coating on a magnetic core could be used and G could be confined on the surface of the magnetic microspheres. Liu et al. have assembled G on the amino-functional silica-coated Fe3O4 core–shell NPs to realize the enrichment of some proteins/peptides.30 Our group has fabricated a silica-coated magnetic G composite using surface grafting by G (Fe3O4@SiO2–G) via a chemical bonding method.31 The results indicated that the G bonded on the surface of the magnetic microspheres endows the material with a high adsorption capacity and it is more stable because the silica shell could provide good protection for the Fe3O4 core.31
So far, the reported G-based magnetic adsorbents have been mainly applied to the extraction of some analytes from water samples,32–34 and the reports about their use for more complex sample matrices have been very few. In this paper, Fe3O4@SiO2–G, which was fabricated in our lab by the chemical bonding of G onto the surface of silica-coated Fe3O4 NPs,31,33 was further explored for the extraction of the fourteen pesticides (diazinon, fenitrothion, chlorpyrifos, parathion, procymidone, ditalimfos, hexaconazole, myclobutanil, kresoxim-methyl, tebuconazole, fenpropathrin, cyhalothrin, cypermethrin, and fenvalerate) in tomato and rape samples. After the preconcentration with the adsorbent, the analytes were analyzed by gas chromatography-mass spectrometry (GC-MS). Several experimental parameters that could affect the extraction efficiencies such as the amount of Fe3O4@SiO2–G, extraction time, sample solution pH, salt concentration, and desorption conditions were studied. The results indicated that the developed method was simple and effective for the determination of the pesticides in the vegetables with good sensitivity and reproducibility.
Experimental
Reagents and materials
The magnetic adsorbent Fe3O4@SiO2–G was synthesized according to our previously reported method.31,33 Acetonitrile, acetone, methanol, hydrochloric acid (HCl), sodium hydroxide (NaOH) and all other reagents were purchased from Beijing Chemical Reagents Company (Beijing, China). The water used throughout the work was double-distilled on a SZ-93 automatic double-distiller purchased from Shanghai Yarong Biochemistry Instrumental Factory (Shanghai, China).Pesticide standards (diazinon, fenitrothion, chlorpyrifos, parathion, procymidone, ditalimfos, hexaconazole, myclobutanil, kresoxim-methyl, tebuconazole, fenpropathrin, cyhalothrin, cypermethrin, and fenvalerate) were purchased from the Agricultural Environmental Protection Institution of Tianjin (Tianjin, China). A mixture stock solution containing each of the fourteen pesticides at 50.0 μg mL−1 was prepared in acetone. All the standard solutions were stored at 4 °C and protected from light.
The tomato and rape samples used throughout the study were bought from the local market (Baoding, China).
Instruments
A Shimadzu 2010 gas chromatograph equipped with a MS-QP2010 series mass elective detector (Shimadzu, Kyoto, Japan) was used for the analysis of the pesticides. The separation steps were completed on an Rxi-5sil MS fused silica capillary column (USA, 30 m × 0.25 mm i.d. with a stationary phase thickness of 0.25 μm of 5% diphenyl–95% dimethyl-polysiloxane). The temperature program was set as follows: the initial column temperature at 150 °C, then at the rate of 10 °C min−1 to 203 °C, at 0.7 °C min−1 to 210 °C, at 12 °C min−1 to 290 °C, and then held for 3 min. The temperature of the injection port was 270 °C and a 1.0 μL volume was injected for GC-MS analysis with injection being kept in splitless mode for 1 min and then changed to split mode. The detector was operated with electron impact ionization (EI, 70 eV) with an ion source temperature of 200 °C and an interface temperature of 250 °C. Ultra pure helium (99.9995%) was used as the carrier gas at a flow rate of 0.97 mL min−1 corresponding to a constant linear velocity of 37.5 cm s−1.The MS was operated in the total ion current (TIC) mode, scanning from m/z 50 to 400 for the determination of the analytes. To gain the highest possible selectivity and sensitivity, the data acquisition was performed in the selected ion monitoring (SIM) mode. One quantification and three identification ions were selected for each compound. The peak areas were calculated based on the sum of the quantification and identification ions. Table 1 lists the retention times, selected quantification and identification ions of the fourteen pesticides studied.35–37
| Pesticides | Retention time (min) | Quantification ion (m/z) | Identification ions (m/z) | ||
|---|---|---|---|---|---|
| Diazinon | 6.167 | 179 | 304 | 152 | 199 |
| Fenitrothion | 8.233 | 277 | 260 | 125 | 109 |
| Chlorpyrifos | 8.733 | 314 | 316 | 97 | 197 |
| Parathion | 9.000 | 291 | 139 | 109 | 97 |
| Procymidone | 10.825 | 283 | 285 | 96 | 67 |
| Ditalimfos | 12.100 | 130 | 243 | 299 | 209 |
| Hexaconazole | 12.717 | 83 | 214 | 216 | 231 |
| Myclobutanil | 13.508 | 179 | 82 | 150 | 152 |
| Kresoxim-methyl | 13.850 | 206 | 131 | 116 | 132 |
| Tebuconazole | 18.192 | 125 | 250 | 70 | 83 |
| Fenpropathrin | 19.667 | 97 | 265 | 181 | 125 |
| Cyhalothrin | 20.575 | 181 | 449 | 208 | 141 |
| 20.800 | 197 | 449 | 208 | 141 | |
| Cypermethrin | 22.743 | 163 | 165 | 181 | 91 |
| 22.942 | 163 | 165 | 181 | 91 | |
| Fenvalerate | 23.942 | 125 | 167 | 225 | 152 |
| 24.255 | 125 | 167 | 225 | 152 | |
Preliminary extraction from vegetable samples
Approximately 500 g of the vegetable samples (tomato and rape) were cut into small pieces and homogenized in a food homogenizer. After that, a 20 g aliquot of the sample was accurately weighed and put into a 50 mL PTFE centrifuge tube with screw caps and then centrifuged at 4000 rpm for 5 min. Then, the supernatant was filtered through a 0.45 μm membrane and collected. The resultant sedimented phase was further extracted by vortexing it in 1 mL of acetonitrile. After centrifugation, the supernatant was filtered through a 0.45 μm membrane and combined to the first supernatant. This washing procedure for the sedimented phase with acetonitrile was repeated another two times, and all the supernatants were combined to the previous one in a 30 mL graduated centrifuge tube. Then, the pH of the final combined supernatant was adjusted to about 7, to which, double-distilled water was added to the mark. The obtained sample solution was then subjected to the following MSPE procedure.MSPE procedure
First, 25 mg Fe3O4@SiO2–G was rinsed with 5 mL acetone and 5 mL double-distiller water, respectively, and then added to 30 mL of the sample solution. Then, the mixture was shaken on a slow-moving platform shaker for 20 min to extract the analytes. Subsequently, the Fe3O4@SiO2–G was isolated from the solution by placing a magnet at the bottom of the flask and the supernatant was poured away. The residual solution and Fe3O4@SiO2–G were totally transferred to a 10 mL centrifuge tube. The Fe3O4@SiO2–G was aggregated again by positioning a magnet outside of the tube wall so that the residual solution could be completely removed using a pipette. The isolated Fe3O4@SiO2–G was then vortexed with 1 mL acetone for 1 min to desorb the analytes. After positioning a magnet to the outside of the centrifuge tube, the supernatant acetone was collected. This desorption procedure was repeated another two more times. The acetone solutions were combined together and transferred to a 10 mL conical centrifuge tube and then dried under a mild stream of nitrogen. The residue was redissolved with 50 μL acetone, and 1 μL the resultant solution was injected into the GC-MS system for analysis.Results and discussion
Characterization of the magnetic graphene NPs
The magnetic adsorbent Fe3O4@SiO2–G was synthesized according to our previously reported method.31,33 As can be seen from the typical TEM image of the obtained Fe3O4@SiO2–G in Fig. 1, the average size of the Fe3O4@SiO2–G NPs was estimated to be about 15–40 nm. Some NPs were slightly aggregated due to the close to the saturation loading degree.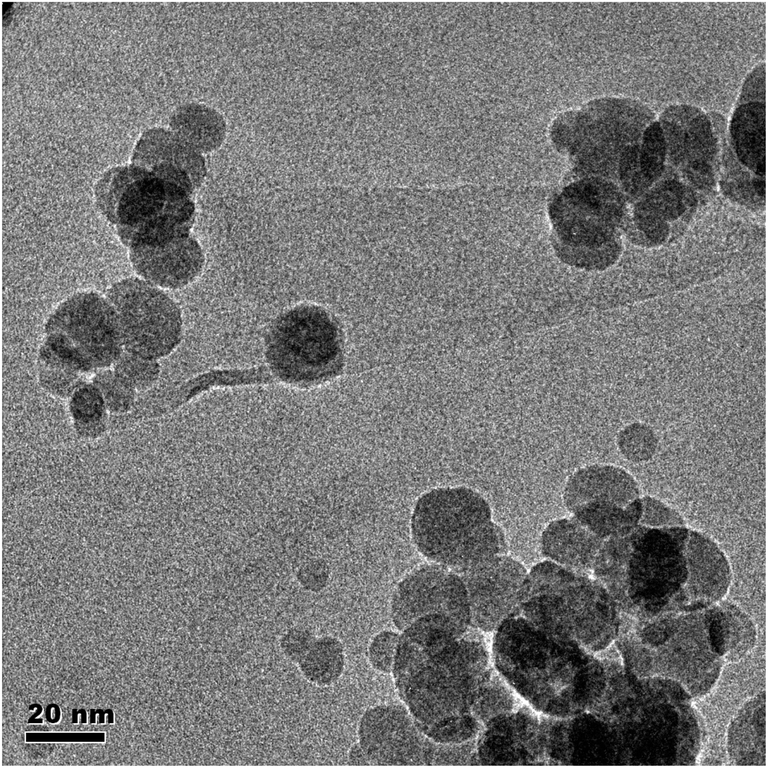 | ||
| Fig. 1 Typical TEM image of the Fe3O4@SiO2–G composite. | ||
Effect of the amount of the Fe3O4@SiO2–G on the MSPE
To study the effect of the amount of the magnetic adsorbent Fe3O4@SiO2–G on the extraction, its amount was changed from 5 to 40 mg in a 30 mL aqueous solution spiked with 100 ng mL−1 of each of the pesticides. As shown in Fig. 2(A), the peak areas of the analytes were first increased with increased amount of the adsorbent from 5 to 25 mg and then no significant signal increase was observed by using more than 25 mg of the adsorbent. Hence, 25 mg of Fe3O4@SiO2–G was selected.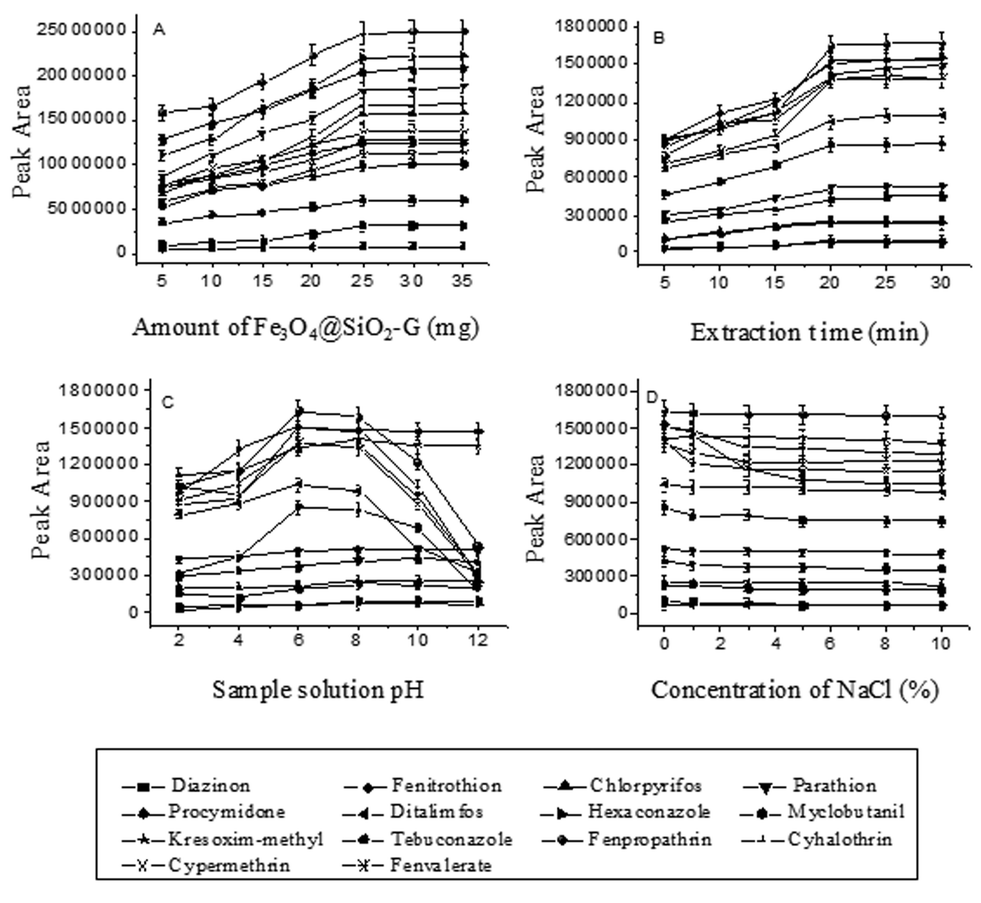 | ||
| Fig. 2 Effect of extraction conditions on MSPE efficiency of the fourteen pesticides. (A) Effect of the amount of Fe3O4@SiO2–G; (B) effect of extraction time; (C) effect of the sample solution pH; (D) effect of salt concentration. | ||
Effect of extraction time
In the MSPE process, extraction time is one of the main factors that could influence the extraction. The effect of the extraction time on the MSPE efficiency of the analytes was investigated in the range from 5 to 40 min with 30 mL aqueous solution spiked with 5.0 ng mL−1 of each of the pesticides being used as the sample. It can be seen from Fig. 2(B) that the peak areas increased first with the increase of the extraction time from 5 to 20 min, and then remained almost constant when the extraction time was longer than 20 min, indicating that the extraction equilibrium could be achieved in a short time. Accordingly, the extraction time was chosen to be 20 min.Effect of sample solution pH
Sample solution pH influences not only the surface charge of the adsorbent but also the physicochemical properties of the analytes in the adsorption process. An appropriate pH possibly could improve the adsorption efficiency of the specific analyte on the adsorbent. In the current work, the influence of the sample solution pH on the extraction efficiency was studied over the pH range from 2.0 to 12.0, which was adjusted by the addition of either 0.1 mol L−1 hydrochloric acid or 0.1 mol L−1 sodium hydroxide solution into the sample solution. Fig. 2(C) displays that the sample solution pH has different influence on different kinds of analytes; the peak areas of the most of the fourteen pesticides increased by increasing the aqueous solution pH from 2.0 to 6.0, and then had no significant changes when the pH of the solution was changed from 6 to 8. When the pH was further increased from 8.0 to 12.0, the peak areas of the PYRs and triazoles decreased rapidly while the others remained unchanged. The reason for this could be that the PYRs and triazoles tend to hydrolyze under an alkaline condition (pH > 8),38 and are relatively stable under neutral conditions. Moreover, the adsorbent is also stable under this pH condition. Accordingly, the pH of the sample solution was adjusted to about 7.Effect of salt addition
In most cases, the addition of salt can decrease the solubility of organic analytes and increase the distribution constant. But on the other hand, it can also increase the viscosity of the solution, which will reduce the extraction capability and the diffusion coefficient. In this study, for the investigation of the influence of ionic strength on the extraction efficiency of the pesticides by Fe3O4@SiO2–G, addition of different concentrations of NaCl (0%, 1.0%, 3.0%, 5.0%, 8.0% and 10.0%, w/v) into the aqueous solution was tested when other experimental conditions were kept constant. Fig. 2(D) shows that the addition of the salt had no significant effect on the extraction efficiency of the pesticides except for hexaconazole. Therefore, no addition of salt to the sample solution was adopted for the experiment.Selection of desorption conditions
An appropriate selection of the desorption solvent is vital for an effective desorption of the adsorbed analytes from the adsorbent. In this study, acetone, methanol and acetonitrile were selected and tested for the desorption of the pesticides from the Fe3O4@SiO2–G adsorbent. As shown in Fig. 3(A), the desorption power of acetone was a little stronger than either acetonitrile or methanol. In addition, acetone (boiling point (b.p.) 56 °C) is more volatile than acetonitrile (b.p. 81 °C) or methanol (b.p. 65 °C), which would be more favorable for its subsequent evaporation process. Therefore, acetone was chosen as the desorption solvent.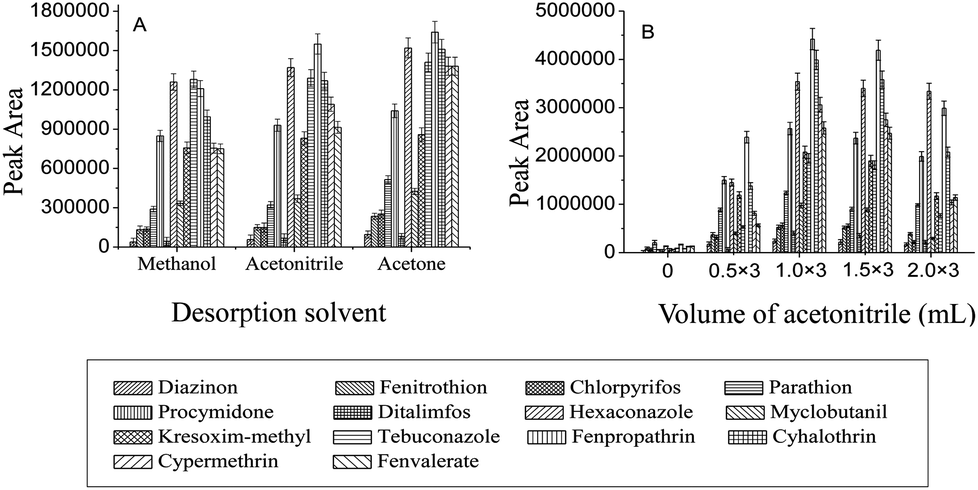 | ||
| Fig. 3 (A) Effect of the desorption solvent on the MSPE efficiency. (B) Effect of the volume of acetonitrile on the extraction of the vegetable sediment. | ||
The effect of desorption mode on the desorption efficiency was also investigated. It was found that after desorption with acetone three times (each time with 1 mL acetone), the extracted pesticides could be completely desorbed from Fe3O4@SiO2–G. To maximize the detection sensitivity, the desorption solution was first evaporated to dryness under a mild stream of nitrogen and then redissolved in 50 μL acetone. Finally, 1 μL of the resultant solution was injected into the GC-MS system for analysis.
Reusability of the adsorbent
In order to investigate the reusability of the Fe3O4@SiO2–G adsorbent, it was first washed with 5 mL acetone two times and then with 5 mL water after desorption. Then, the adsorbent was reused for the next MSPE of the pesticides. In such a way, no carry-over on the adsorbent was found for the analysis. The results showed that the Fe3O4@SiO2–G adsorbent can be reused at least 20 times without significant loss of the adsorption capacity.Selection of extraction solvent for vegetable sediment
In the sample preparation process of the vegetables, after their homogenization and centrifugation, some proportions of the analytes went into the supernatant, but a significant part of them still remained in the sediment.31 Therefore, to achieve a good extraction recovery from the vegetables, a further solvent extraction of the analytes from the sedimented phase of the vegetables was necessary. In this work, acetonitrile, ethanol, methanol and acetone were tried as the extraction solvents. Based on the experimental results, acetonitrile was better than others and therefore was selected as the extraction solvent. The influence of the volume of acetonitrile (three extractions with each volume) on the extraction efficiency of the analytes from the sediment was also investigated. As shown in Fig. 3(B), the highest extraction efficiency for the pesticides from the tomato sample was achieved when the sediment was extracted with 1 mL acetonitrile three times (1 mL × 3). Therefore, the extraction with 1 mL acetonitrile three times (1 mL × 3) was selected.Method performance
For the evaluation of the performance of the developed MSPE coupled with the GC-MS method for the analysis of the pesticides, the linearity, limits of detection (LODs) and reproducibilities of the method were investigated. Pesticide-free vegetable (tomato and rape) samples were used as blanks for the establishment of the matrix-matched standard calibration curves. An appropriate amount of the mixture standard solution of the fourteen pesticides was added into the blank homogenised tomato and rape samples, respectively. A series of standard samples containing each of the pesticides at seven concentrations of 1.0, 5.0, 10.0, 30.0, 50.0, 70.0 and 100.0 ng g−1 were prepared for the establishment of the calibration curve. For each level, five replicate whole analyses were performed and the peak areas of the analytes were used as the quantification signals. The calibration curves of the fourteen pesticides were constructed by plotting their respective peak areas versus their concentrations of the analytes. The analytical performance data for the pesticides are summarized in Table 2. Good linearity was observed in the range of 1.0–100.0 ng g−1 for all the fourteen pesticides with the correlation coefficients (r) ranging from 0.9972 to 0.9996. Based on a signal to noise ratio of 3, the LODs for the compounds were estimated to be between 0.005 and 0.030 ng g−1.| Pesticides | Linear range (ng g−1) | Correlation coefficient | LODs (ng g−1) | Intraday RSDs (%) (n = 5) | Interday RSDs (%) (n = 5) | |||||
|---|---|---|---|---|---|---|---|---|---|---|
| Tomato | Rape | Tomato | Rape | Tomato | Rape | Tomato | Rape | Tomato | Rape | |
| Diazinon | 1.0–100.0 | 1.0–100.0 | 0.9996 | 0.9978 | 0.030 | 0.030 | 7.0 | 6.1 | 8.1 | 9.3 |
| Fenitrothion | 1.0–100.0 | 5.0–100.0 | 0.9992 | 0.9983 | 0.010 | 0.030 | 6.5 | 11.6 | 7.7 | 12.3 |
| Chlorpyrifos | 1.0–100.0 | 1.0–100.0 | 0.9986 | 0.9981 | 0.008 | 0.010 | 7.6 | 6.6 | 8.4 | 7.2 |
| Parathion | 1.0–100.0 | 1.0–100.0 | 0.9977 | 0.9984 | 0.010 | 0.010 | 8.0 | 9.2 | 8.5 | 10.8 |
| Procymidone | 1.0–100.0 | 1.0–100.0 | 0.9987 | 0.9975 | 0.008 | 0.010 | 9.4 | 8.2 | 11.5 | 9.2 |
| Ditalimfos | 1.0–100.0 | 1.0–100.0 | 0.9991 | 0.9981 | 0.008 | 0.010 | 6.5 | 6.5 | 7.7 | 8.4 |
| Hexaconazole | 1.0–100.0 | 1.0–100.0 | 0.9985 | 0.9983 | 0.005 | 0.005 | 4.4 | 7.4 | 6.3 | 9.4 |
| Myclobutanil | 1.0–100.0 | 1.0–100.0 | 0.9990 | 0.9991 | 0.008 | 0.010 | 6.9 | 9.6 | 8.7 | 11.5 |
| Kresoxim-methyl | 1.0–100.0 | 1.0–100.0 | 0.9987 | 0.9987 | 0.008 | 0.010 | 7.3 | 8.3 | 8.8 | 9.4 |
| Tebuconazole | 1.0–100.0 | 1.0–100.0 | 0.9991 | 0.9984 | 0.008 | 0.010 | 8.1 | 10.2 | 9.9 | 12.5 |
| Fenpropathrin | 1.0–100.0 | 1.0–100.0 | 0.9985 | 0.9980 | 0.005 | 0.005 | 5.9 | 7.8 | 7.3 | 8.4 |
| Cyhalothrin | 1.0–100.0 | 1.0–100.0 | 0.9983 | 0.9985 | 0.005 | 0.005 | 10.6 | 5.6 | 12.1 | 7.8 |
| Cypermethrin | 1.0–100.0 | 1.0–100.0 | 0.9978 | 0.9984 | 0.005 | 0.008 | 6.0 | 7.4 | 8.3 | 9.6 |
| Fenvalerate | 1.0–100.0 | 1.0–100.0 | 0.9972 | 0.9983 | 0.005 | 0.008 | 5.8 | 9.5 | 7.7 | 11.9 |
The within laboratory reproducibilities of the developed MSPE method were evaluated in terms of intraday and interday precisions by the extraction and determination of the analytes from the spiked tomato and rape samples at 10.0 ng g−1 of each of the pesticides in the same day and on three consecutive days. The results, expressed as the relative standard deviations (RSDs) of peak areas, are presented in Table 2. As can be observed, an acceptable precision was obtained with intraday RSD values below 11.6% and interday RSD values within 12.5%. These results indicated that the developed method is sensitive and repeatable.
Analysis of tomato and rape samples
The developed MSPE in combination with the GC-MS method was applied to the determination of the pesticides in tomato and rape samples. As a result, no residues of the pesticides were detected in the rape sample and 1.75 ng g−1 of ditalimfos and 1.23 ng g−1 of hexaconazole were found in the tomato sample. The recoveries of the method for the pesticides were studied by analyzing the spiked samples at three concentrations (5.0, 10.0 and 70.0 ng g−1). For each concentration level, five replicate experiments were performed. The relevant data are listed in Table 3 and the results indicated that the recoveries of the method for the pesticides were in the range from 83.2% to 110.3% with RSDs between 4.3% and 13.0%. Fig. 4 illustrates the total ion chromatograms obtained in SIM mode for the tomato sample before and after being spiked at 70.0 ng g−1 of each of the pesticides.| Pesticides | Spiked (ng g−1) | Tomato sample (n = 5) | Rape sample (n = 5) | ||||
|---|---|---|---|---|---|---|---|
| Measured (ng g−1) | R (%) | RSDs (%) | Measured (ng g−1) | R (%) | RSDs (%) | ||
| a nd: not detected. b R: recovery of the method. | |||||||
| Diazinon | 0.0 | nda | nda | ||||
| 5.0 | 4.17 | 83.4 | 8.9 | 4.31 | 86.2 | 13.0 | |
| 10.0 | 8.61 | 86.1 | 7.6 | 8.82 | 88.2 | 8.5 | |
| 70.0 | 68.51 | 97.9 | 5.2 | 65.87 | 94.1 | 5.4 | |
| Fenitrothion | 0.0 | nda | nda | ||||
| 5.0 | 4.28 | 85.6 | 7.5 | 4.49 | 89.8 | 10.2 | |
| 10.0 | 8.70 | 87.0 | 6.5 | 9.83 | 98.3 | 7.3 | |
| 70.0 | 72.54 | 103.6 | 5.2 | 76.37 | 109.1 | 8.3 | |
| Chlorpyrifos | 0.0 | nda | nda | ||||
| 5.0 | 4.32 | 86.4 | 8.5 | 4.38 | 87.6 | 7.1 | |
| 10.0 | 8.56 | 85.6 | 5.8 | 9.01 | 90.1 | 5.3 | |
| 70.0 | 69.50 | 99.3 | 7.1 | 67.23 | 96.0 | 8.3 | |
| Parathion | 0.0 | nda | nda | ||||
| 5.0 | 4.56 | 91.2 | 8.7 | 4.27 | 85.4 | 9.4 | |
| 10.0 | 9.00 | 90.0 | 8.7 | 8.75 | 87.5 | 5.5 | |
| 70.0 | 68.88 | 98.4 | 6.3 | 73.70 | 105.3 | 7.8 | |
| Procymidone | 0.0 | nda | nda | ||||
| 5.0 | 4.67 | 93.4 | 10.5 | 4.43 | 88.6 | 9.3 | |
| 10.0 | 9.83 | 98.3 | 7.1 | 8.83 | 88.3 | 8.0 | |
| 70.0 | 77.21 | 110.3 | 4.8 | 66.92 | 95.6 | 10.5 | |
| Ditalimfos | 0.0 | 1.75 | nda | ||||
| 5.0 | 5.98 | 84.6 | 7.6 | 4.50 | 90.0 | 7.7 | |
| 10.0 | 10.79 | 90.4 | 6.8 | 9.16 | 91.6 | 6.9 | |
| 70.0 | 69.72 | 97.1 | 7.5 | 66.57 | 95.1 | 6.3 | |
| Hexaconazole | 0.0 | 1.23 | nda | ||||
| 5.0 | 5.89 | 93.2 | 6.9 | 4.72 | 94.4 | 8.3 | |
| 10.0 | 10.80 | 95.7 | 5.3 | 9.39 | 93.9 | 6.9 | |
| 70.0 | 74.03 | 104.0 | 7.3 | 69.00 | 98.5 | 5.6 | |
| Myclobutanil | 0.0 | nda | nda | ||||
| 5.0 | 4.48 | 89.6 | 7.5 | 4.51 | 90.2 | 12.6 | |
| 10.0 | 9.45 | 94.5 | 4.3 | 9.43 | 94.3 | 11.0 | |
| 70.0 | 66.82 | 95.5 | 6.8 | 67.24 | 96.1 | 5.2 | |
| Kresoxim-methyl | 0.0 | nda | nda | ||||
| 5.0 | 4.74 | 94.8 | 8.4 | 4.45 | 89.0 | 7.3 | |
| 10.0 | 9.68 | 96.8 | 6.6 | 9.14 | 91.4 | 6.1 | |
| 70.0 | 73.57 | 105.1 | 5.6 | 74.24 | 106.1 | 8.3 | |
| Tebuconazole | 0.0 | nda | nda | ||||
| 5.0 | 4.16 | 83.2 | 9.4 | 4.74 | 94.8 | 10.0 | |
| 10.0 | 8.95 | 89.5 | 6.8 | 9.94 | 99.4 | 5.9 | |
| 70.0 | 73.90 | 105.6 | 9.1 | 73.33 | 104.8 | 7.6 | |
| Fenpropathrin | 0.0 | nda | nda | ||||
| 5.0 | 4.50 | 90.0 | 7.8 | 4.28 | 85.6 | 8.6 | |
| 10.0 | 9.49 | 94.9 | 7.6 | 8.97 | 89.7 | 4.4 | |
| 70.0 | 67.60 | 96.6 | 4.6 | 67.93 | 97.0 | 9.2 | |
| Cyhalothrin | 0.0 | nda | nda | ||||
| 5.0 | 4.78 | 95.6 | 10.3 | 4.43 | 88.6 | 7.1 | |
| 10.0 | 9.52 | 95.2 | 5.5 | 9.05 | 90.5 | 6.2 | |
| 70.0 | 72.62 | 103.7 | 8.1 | 70.49 | 100.7 | 8.8 | |
| Cypermethrin | 0.0 | nda | nda | ||||
| 5.0 | 4.71 | 94.2 | 7.5 | 4.32 | 86.4 | 8.8 | |
| 10.0 | 9.76 | 97.6 | 6.7 | 8.89 | 88.9 | 8.6 | |
| 70.0 | 72.90 | 104.1 | 4.6 | 67.45 | 96.4 | 6.1 | |
| Fenvalerate | 0.0 | nda | nda | ||||
| 5.0 | 4.36 | 87.2 | 7.9 | 4.28 | 85.6 | 11.7 | |
| 10.0 | 8.69 | 86.9 | 5.2 | 9.09 | 90.9 | 6.9 | |
| 70.0 | 69.02 | 98.6 | 7.1 | 66.00 | 94.3 | 5.6 | |
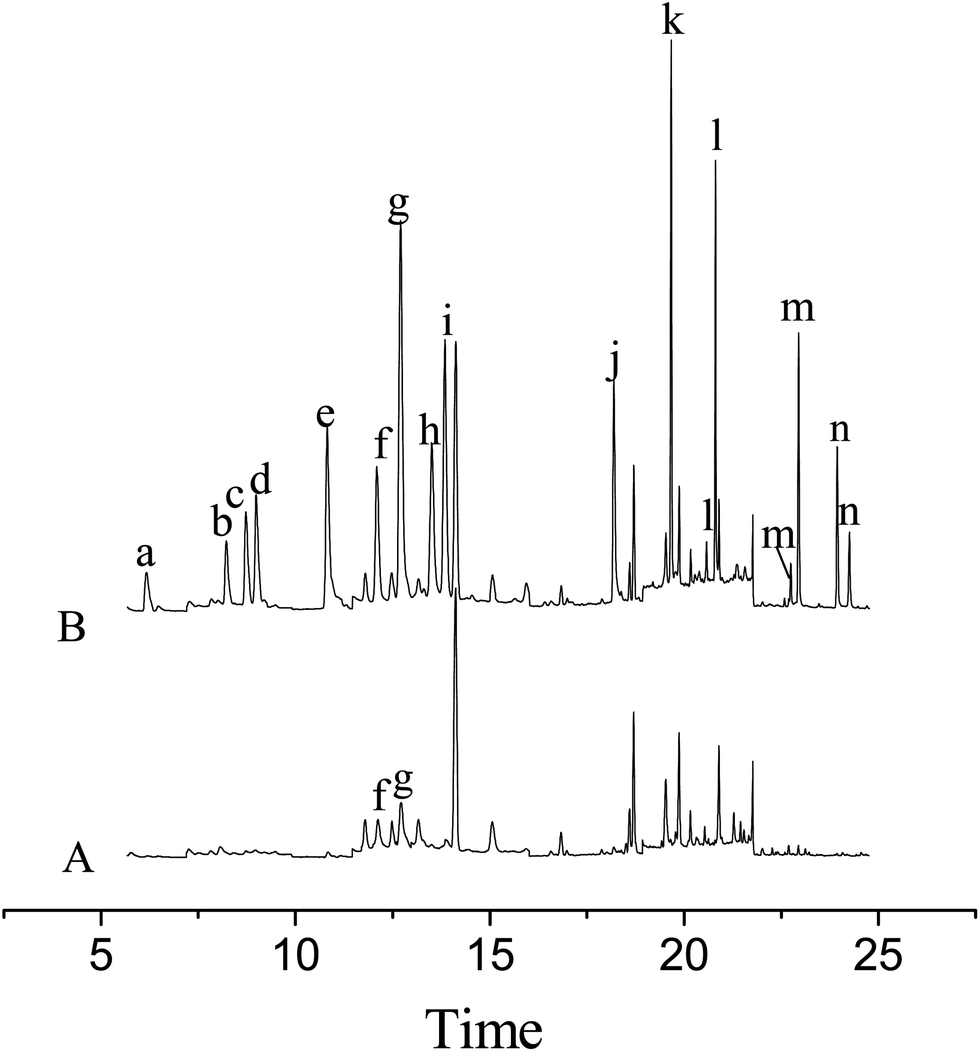 | ||
| Fig. 4 Ion chromatograms obtained by GC-MS in SIM acquisition mode of the blank tomato sample (A) and the tomato sample spiked with the fourteen pesticides at each of 70.0 ng g−1 (B). Peak identification: (a) diazinon, (b) fenitrothion, (c) chlorpyrifos, (d) parathion, (e) procymidone, (f) ditalimfos, (g) hexaconazole, (h) myclobutanil, (i) kresoxim-methyl, (j) tebuconazole, (k) fenpropathrin, (l) cyhalothrin, (m) cypermethrin and (n) fenvalerate. | ||
Comparison of the current MSPE method with other reported methods
The performance of the developed MSPE method was compared with other previously reported methods such as molecularly imprinted polymer coupled with SPE,39 SPME,40 dispersive solid phase extraction (DSPE),41 MSPD,42 hollow fiber liquid-phase microextraction (HF-LPME)43 and dispersive liquid–liquid microextraction (DLLME)44 from a point of view of linearity, LODs, RSDs and extraction time. As listed in Table 4, the MSPE method has lower LODs compared with other reported methods, and also the method requires a shorter extraction time compared to all of the other methods except for DSPE. Moreover, this method has a comparable reproducibility with those of the other methods. A remarkable advantage of the current MSPE method is that the separation process is easier and faster without the need for additional centrifugation or filtration procedures.| Methods | Instrument | Samples | Linearity (ng g−1) | LODs (ng g−1) | RSDs (%) | Extraction time (min) | Ref. |
|---|---|---|---|---|---|---|---|
| a GC-FPD: gas chromatography-flame photometric detection. | |||||||
| SPE | GC-MS | Berry fruit | 50–500 | 6–50 | 1–19 | — | 39 |
| SPME | GC-MS | Mangoes | 33.3–333.3 | 1.0–3.3 | 3.1–12.3 | 30 | 40 |
| DSPE | GC-MS | Peanut oil | 5–200 | 0.7–1.6 | <8.48 | 10 | 41 |
| MSPD | GC-MS | Chicken egg | 10–2000 | 3–15 | 0.1–18 | — | 42 |
| HF-LPME | GC-MS | Fish tissue | 20–500 | 2.1–4.5 | 4.8–18.1 | 30 | 43 |
| DLLME | GC-FPDa | Tea | — | 0.03–1.00 | 3.0–7.8 | 45 | 44 |
| MSPE | GC-MS | Tomato, rape | 1–100 | 0.005–0.030 | <12.5 | 20 | This method |
Conclusions
In the present study, an effective MSPE of the fourteen pesticides in tomato and rape samples was realized by using a new magnetic adsorbent of G grafted silica-coated Fe3O4 (Fe3O4@SiO2–G). The developed MSPE coupled with GC-MS provided a simple and sensitive alternative approach for the determination of the analytes in vegetable samples. With the protection of the silica shell for the Fe3O4 core, Fe3O4@SiO2–G remained stable during the extraction. Fe3O4@SiO2–G promised to be a good MSPE adsorbent of choice for the enrichment of some other environmental pollutants and its further practical applications should be explored.Acknowledgements
Financial support for this study from the National Natural Science Foundation of China (no. 31171698), the Scientific and Technological Research Foundation of Department of Education of Hebei Province (ZH2012012) and Hebei Province Science and Technology Support Program (no. 12396908D) is gratefully acknowledged.References
- R. C. Calhelha, J. V. Andrade, I. C. Ferreira and L. M. Estevinho, Food Microbiol., 2006, 23, 393–398 CrossRef CAS PubMed.
- M. Canal-Raffin, B. l'Azou, J. Jorly and A. Hurtier, Toxicology, 2008, 249, 160–166 CrossRef CAS PubMed.
- P. B. Fai and A. Grant, Chemosphere, 2009, 74, 1165–1170 CrossRef CAS PubMed.
- C. E. A. M. Degenhardt, A. Verweij and H. P. Benschop, Int. J. Environ. Anal. Chem., 1987, 30, 15–28 CrossRef CAS.
- S. K. Mak, G. M. Shan, H. J. Lee, T. Watanabe, D. W. Stoutamire, S. J. Gee and B. D. Hammock, Anal. Chim. Acta, 2005, 534, 109–120 CrossRef CAS PubMed.
- I. Oller, S. Malato, J. A. Sánchez-Pérez, M. I. Maldonado and R. Gassó, Catal. Today, 2007, 129, 69–78 CrossRef CAS PubMed.
- Q. Gao, D. Luo, J. Ding and Y. Q. Feng, J. Chromatogr., A, 2010, 1217, 5602–5609 CrossRef CAS PubMed.
- L. Sun, X. Sun, X. B. Du, Y. S. Yue, L. G. Chen, H. Y. Xu, Q. L. Zeng, H. Wang and L. Ding, Anal. Chim. Acta, 2010, 665, 185–192 CrossRef CAS PubMed.
- Q. Gao, D. Luo, M. Bai, Z. W. Chen and Y. Q. Feng, J. Agric. Food Chem., 2011, 59, 8543–8549 CrossRef CAS PubMed.
- I. I. Sukhanova, M. A. Dikunets, E. D. Viryus and G. M. Rodchenkov, J. Anal. Chem., 2011, 66, 807–814 CrossRef CAS.
- X. L. Zhang, H. Y. Niu, Y. Y. Pan, Y. L. Shi and Y. Q. Cai, J. Colloid Interface Sci., 2011, 362, 107–112 CrossRef CAS PubMed.
- A. G. Howard, J. Environ. Monit., 2010, 12, 135–142 RSC.
- Y. B. Luo, Q. W. Yu, B. F. Yuan and Y. Q. Feng, Talanta, 2012, 90, 123–131 CrossRef CAS PubMed.
- X. Hu, Y. Liu, H. Wang, A. Chen, G. Zeng, S. Liu, Y. Guo, X. Hu, T. Li, Y. Wang, L. Zhou and S. Liu, Sep. Purif. Technol., 2013, 108, 189–195 CrossRef CAS PubMed.
- O. Akhavan, Carbon, 2011, 49, 11–18 CrossRef CAS PubMed.
- S. Park and R. S. Ruoff, Nat. Nanotechnol., 2009, 4, 217–224 CrossRef CAS PubMed.
- Q. Su, S. P. Pang, V. Alijani, C. Li, X. L. Feng and K. Mullen, Adv. Mater., 2009, 21, 3191–3195 CrossRef CAS.
- J. Yan, T. Wei, W. Qiao, B. Shao, Q. Zhao, L. Zhang and Z. Fan, Electrochim. Acta, 2010, 55, 6973–6978 CrossRef CAS PubMed.
- Y. Zhu, S. Murali, W. Cai, X. Li, J. W. Suk, J. R. Potts and R. S. Ruoff, Adv. Mater., 2010, 22, 3906–3924 CrossRef CAS PubMed.
- K. J. Huang, S. Yu, J. Li, Z. W. Wu and C. Y. Wei, Microchim. Acta, 2012, 176, 327–335 CrossRef CAS.
- Q. Wu, C. Feng, G. Zhao, C. Wang and Z. Wang, J. Sep. Sci., 2012, 35, 193–199 CrossRef CAS PubMed.
- Q. Liu, J. Shi, J. Sun, T. Wang, L. Zeng, N. Zhu and G. Jiang, Anal. Chim. Acta, 2011, 708, 61–68 CrossRef CAS PubMed.
- H. Zhang, W. P. Low and H. K. Lee, J. Chromatogr., A, 2012, 1233, 16–21 CrossRef CAS PubMed.
- G. Zhao, S. Song, C. Wang, Q. Wu and Z. Wang, Anal. Chim. Acta, 2011, 708, 155–159 CrossRef CAS PubMed.
- Q. Wu, G. Zhao, C. Feng, C. Wang and Z. Wang, J. Chromatogr., A, 2011, 1218, 7936–7942 CrossRef CAS PubMed.
- Q. Han, Z. Wang, J. Xia, S. Chen, X. Zhang and M. Ding, Talanta, 2012, 101, 388–395 CrossRef CAS PubMed.
- C. Shi, J. Meng and C. Deng, Chem. Commun., 2012, 48, 2418–2420 RSC.
- F. He, J. Fan, D. Ma, L. Zhang, C. Leung and H. L. Chan, Carbon, 2010, 48, 3139–3144 CrossRef CAS PubMed.
- W. Hang, W. Yang, Q. Xi and X. Chen, Mater. Lett., 2012, 82, 224–226 CrossRef PubMed.
- Q. Liu, J. Shi, M. Cheng, G. Li, D. Cao and G. Jiang, Chem. Commun., 2012, 48, 1874–1876 RSC.
- W. Wang, Q. Wu, C. Wang and Z. Wang, Talanta, 2013, 109, 133–140 CrossRef CAS PubMed.
- Y. Luo, Z. Shi, Q. Gao and Y. Feng, J. Chromatogr., A, 2011, 1218, 1353–1358 CrossRef CAS PubMed.
- W. Wang, R. Ma, Q. Wu, C. Wang and Z. Wang, J. Chromatogr., A, 2013, 1293, 20–27 CrossRef CAS PubMed.
- L. Fan, C. Luo, M. Sun, X. Li and H. Qiu, Colloids Surf., B, 2013, 103, 523–529 CrossRef CAS PubMed.
- F. M. Rodrigues, P. R. R. Mesquita, L. S. De Oliveira, F. S. De Oliveira, A. Menezes Filho, P. A. P. Pereira and J. B. De Andrade, Microchem. J., 2011, 98, 56–61 CrossRef CAS PubMed.
- J. You, D. Wang and M. J. Lydy, Talanta, 2010, 81, 136–141 CrossRef CAS PubMed.
- E. Matisová, S. Hrouzková and J. De Zeeuw, J. Chromatogr., A, 2005, 1090, 126–132 CrossRef PubMed.
- X. Yu, Y. Sun, C. Jiang, X. Sun, Y. Gao, Y. Wang, H. Zhang and D. Song, Talanta, 2012, 98, 257–264 CrossRef CAS PubMed.
- X. Yang, H. Zhang, Y. Liu, J. Wang, Y. C. Zhang, A. J. Dong, H. T. Zhao, C. H. Sun and J. Cui, Food Chem., 2011, 127, 855–865 CrossRef CAS PubMed.
- A. Menezes Filho, F. N. Dos Santos and P. A. De Paula Pereira, Talanta, 2010, 81, 346–354 CrossRef CAS PubMed.
- R. Su, X. Xu, X. Wang, D. Li, X. Li, H. Zhang and A. Yu, J. Chromatogr., B: Anal. Technol. Biomed. Life Sci., 2011, 879, 3423–3428 CrossRef CAS PubMed.
- M. R. R. Souza, C. O. Moreira, T. G. De Lima, A. Aquino and H. S. Dórea, Microchem. J., 2013, 110, 395–401 CrossRef CAS PubMed.
- X. Sun, F. Zhu, J. Xi, T. Lu, H. Liu, Y. Tong and G. Ouyang, Mar. Pollut. Bull., 2011, 63, 102–107 CrossRef CAS PubMed.
- S. Moinfar and M. R. M. Hosseini, J. Hazard. Mater., 2009, 169, 907–911 CrossRef CAS PubMed.
| This journal is © The Royal Society of Chemistry 2014 |