Size separation of biomolecules and bioparticles using micro/nanofabricated structures
Jie
Xuan
and
Milton L.
Lee
*
Brigham Young University, Department of Chemistry and Biochemistry, Provo, UT 84602, USA. E-mail: milton_lee@byu.edu; Tel: +1-801-422-2135
First published on 28th November 2013
Abstract
Reports of novel micro/nanostructures designed to separate biomacromolecules and bioparticles are increasing in number, and these studies have greatly advanced our understanding of nanoscale fluidics and nanoparticle behavior in confined channels. This review is aimed at summarizing previous developments in micro/nanofabricated systems for nanoparticle separations. These are discussed in three groups based on architecture, namely, micro/nanopillar array structures, nanoplane gap structures and artificial nanoporous membranes.
 Jie Xuan | Dr. Jie Xuan studied chemistry as an undergraduate student at Nankai University, Tianjin, PRC and obtained a PhD in Analytical Chemistry at Brigham Young University, Provo, UT, USA in August 2013, working in the research group of Professor Milton Lee. Her dissertation was entitled “Size-Based Separation of Bioparticles Using Planar Nanofluidic Devices.” She is currently a postdoctoral fellow in the pathology department at the Houston Methodist Hospital in Houston, TX, USA. Her research interests include nanofluidic technologies and development of point-of-care devices for clinical applications. |
 Milton L. Lee | Milton L. Lee received a B.A. Degree in Chemistry from the University of Utah in 1971 and a Ph.D. in Analytical Chemistry from Indiana University in 1975. Dr Lee spent one year (1975–76) at the Massachusetts Institute of Technology as a Postdoctoral Research Associate before accepting a faculty position in the Department of Chemistry and Biochemistry at Brigham Young University, where he is the H. Tracy Hall Professor of Chemistry. Dr Lee is best known for his research in capillary separation techniques and mass spectrometry detection. He is an author or co author of over 550 scientific publications, and has given over 500 technical presentations on various aspects of his research. He has received a number of national and international awards including the American Chemical Society Award in Chromatography (1988), Martin Gold Medal (1996), American Chemical Society Award in Chemical Instrumentation (1998), Eastern Analytical Symposium Award for Outstanding Achievements in Fields of Analytical Chemistry (2008), Pittsburgh Analytical Chemistry Award, (2008), and the American Chemical Society Award in Separations Science and Technology (2012). Dr Lee has mentored over 65 M.S. and Ph.D. students. Professor Lee is also an entrepreneur and has been involved in transferring technology from his university research laboratory to the private sector. He co-founded three analytical instrument companies, the most recent of which is Torion Technologies, which markets hand-portable gas chromatography-mass spectrometry detection systems for first responders. He is listed as a co-inventor on 20 issued patents. |
1 Introduction
Conventional techniques such as gel electrophoresis, size exclusion chromatography (SEC), hydrodynamic chromatography (HDC) and field flow fractionation (FFF)1 are widely used for separating biomolecules and bioparticles based on size. However, these methods usually involve bulky instruments, require long analysis times and often rely on size standards to facilitate data interpretation. With advances in microfabrication technologies, the traditional high-performance techniques of liquid chromatography (LC) and capillary electrophoresis (CE) are being miniaturized for efficient, high speed separations.2 Advantages of miniaturization are low reagent consumption and fast analysis. As separation technologies move from microfluidics to nanofluidics, device dimensions begin to have a significant influence on the behavior of the system.3,4 By definition, nanofluidics rely on structures that have at least one dimension between 1 nm and 100 nm, which is of the same order of magnitude as the sizes of biomacromolecules such as DNA and proteins. Consequently, size separation becomes a suitable application for nanofluidics. As the channel dimensions approach the particle size, unique phenomena and separation mechanisms are being discovered. For example, due to the large surface-to-volume ratio, it has been shown that fluid transport in nanochannels is different from common understanding at the macroscale.5–8 Well-defined micro/nanostructures can be precisely designed and fabricated with sub-10 nm resolution.9–12 Downscaling of device dimensions not only enhances the realization of “lab-on-a-chip” application, where sample injection, analysis, detection and signal processing are integrated onto a single chip,13–16 but more importantly, the deterministic networks of micro/nanostructures provide insights into separation processes, such that better speed and resolution can be achieved.In the early 1990s, the group of Austin17 pioneered the use of microfabricated post arrays (0.15 μm-high posts, 1 μm diameter and 2 μm center-to-center spacing) to replace the gel matrix for DNA analysis. Since then, a variety of micro/nanofluidic structures have been developed that utilize different separation mechanisms. The goals of this review are to summarize these designs (described here in three categories according to architecture, i.e., micro/nanopillar array structures, nanoplane gap structures and artificial nanoporous membranes) and to discuss their separation mechanisms and applications.
2 Micro/nanofabricated pillar array structures
2.1 Miniaturized DNA electrophoresis
Agarose gel electrophoresis is one the most common techniques used to determine the sizes of DNA. It is essentially a sieving process in which DNA molecules migrate through a cross-linked network by an electrophoretic force. Both the size and conformation of the DNA affect how fast it moves inside the gel. Under a uniform electric field, small molecules migrate more quickly than larger ones at rates that are inversely proportional to their sizes. This relationship between size and migration rate is only accurate for DNA molecules smaller than 40 kbp.20 For longer DNA, the efficiency of agarose gel electrophoresis decreases substantially due to orientation of the reptation tube21 and irreversible trapping of DNA in the gel fibers,22 especially at the entrance of the gel.23 In 1984, Schwartz and Cantor24 introduced the method of macroscopic pulsed-field gel electrophoresis (PFGE), which was used for separating long DNA. Theoretical and experimental efforts showed that the non-local Monte Carlo model quantitatively characterizes the reorientation process.25–27 However, irreversible trapping is still a problem in PFGE22 and it takes hours to days to separate long DNA. To address the challenging problem of separating long DNA and to further understand the sieving mechanism, miniaturized systems were developed with the hope to eventually replace their macroscopic counterparts.
Depending on the relationship between average pore size (a) and radius of gyration (Rg) of DNA molecules, DNA electrophoretic behavior can be classified into three regimes: Ogston sieving, entropic trapping and reptation. When a > Rg, DNA molecules are fractionated by Ogston sieving. Their mobilities can be described by the Ogston–Morris–Rodbard–Chrambach model.28–30 When a ≈ Rg, the separation regime is entropic trapping because DNA molecules can freely coil into large pores, whereas there is an entropic cost for them to enter smaller pores. When a < Rg, the DNA molecules migrate by “reptation” i.e., a reptile-like, snaking action through the pores.
Duke et al.31 demonstrated the first example of performing pulsed-field electrophoresis in a post array. Miniaturization of pulsed-field electrophoresis for separating DNA was conducted in a two-dimensional array of circular micropillars, taking advantage of a switchback mechanism first suggested by Southern et al.32 In strong fields (E ∼ 10 V cm−1), DNA molecules are stretched into a linear form when the fields are aligned along one of the axes of the array. Different results were observed when acute and obtuse angles between the fields were used. When pulsing using acute angles, all molecules zigzagged through the array at approximately the same speed, and no fractionation was observed. However, when the fields alternated through obtuse angles, molecules backtracked along the previous path led by their tail ends. Since longer molecules retraced longer paths than shorter ones, fractionation according to molecular weight took place (Fig. 1). Based on the crystal structure of the posts, the design was referred to as a hexagonal array. Using this geometry, λ DNA (48.5 kbp) and T4 DNA (165.6 kbp) were separated in ∼10 s, several orders of magnitude faster than by using conventional techniques.33 It is worth mentioning that the device adopted entropic trapping34 in low dc fields for sample injection, which helped to concentrate and launch the sample in a narrow zone.
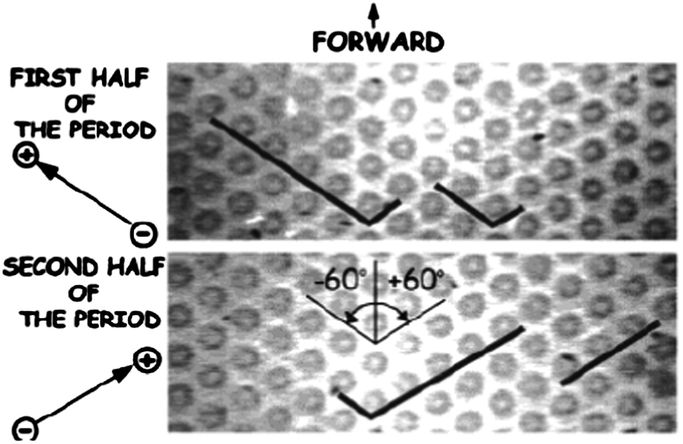 | ||
| Fig. 1 Pulsed-field electrophoresis of different-sized DNA in a hexagonal array. The fields were alternated along the channels formed at 120° by the posts in the array. Longer molecules spent most time retracing the path and, as a result, did not proceed forward whereas shorter molecules moved forward unhindered, thereby achieving separation (reprinted with permission from ref. 33. Copyright 2001 American Chemical Society). | ||
In another study combining entropic trapping and a pulsed-electric field, DNA molecules were inserted into a densely packed (80 nm diameter, 135 nm spacing) nanopillar array (an entropically unfavorable region) and separated according to size by the fact that shorter molecules moved fully inside the region, while longer molecules straddled across the interface.35 When the field was switched off, the longer molecules were observed to recoil entirely out of the array to increase their configurational entropy while shorter molecules remained within the pillar array, thereby becoming separated. The same nanostructure used in the entropic recoil separation was first used for DNA mobility characterization in a constant field.36 It should be pointed out that entropic recoil suffers from substantial band broadening due to the stochastic injection of DNA into the array35 and, therefore, is not an ideal sieving mechanism.
Pulsed-field electrophoresis of DNA in a hexagonal array can be tuned via three factors: pulse duration (frequency), field strength and post size. In the previous examples, the pulse times and field strengths remained the same throughout one separation. As a result, all molecules moved in the direction as defined by the net electric field. If asymmetric fields of varying frequency were used, DNA molecules could be sorted in different directions according to size, resembling the separation of white light in a prism. Therefore, such a device was named a DNA prism. The prism (2 μm diameter, 2 μm spacing and 2 μm tall) separated 61–209 kbp DNA molecules in 15 s with a resolution of ∼13% (Fig. 2).37 The authors discovered that separation depended on pulse duration, the correlation between which was recently studied by Chen and Dorfman.38 Similarly, using a self-assembled colloidal nanoarray (330 nm silica beads), Zeng showed separation of four DNA fragments in the range of 2–50 kbp.39 This work furthered the understanding of size and frequency dependency of separations using a DNA prism, and presented guidance for choosing proper conditions to separate DNA of certain sizes.
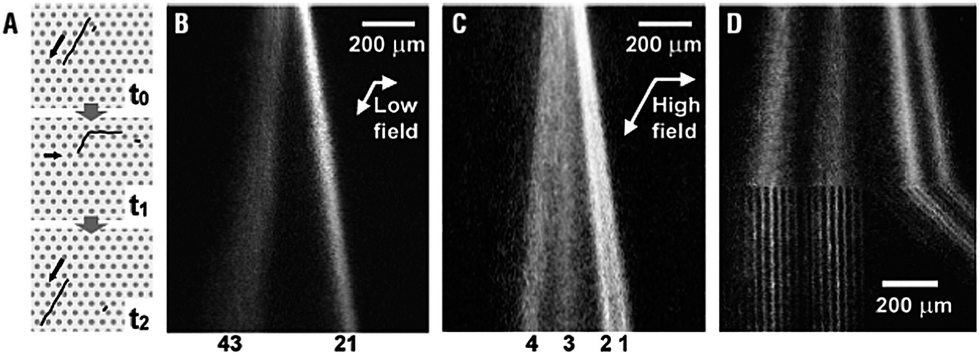 | ||
| Fig. 2 (A) Schematic diagram showing the behavior of small and large DNA molecules in a DNA prism under asymmetric fields. At t0, small and large molecules move at the same speed in a high field. Then at t1, their migration directions are reversed along a low field rotated at 120°. When the original field is reapplied at t2, the large molecule resumes its previous path while the small molecule starts a new path. (B–D) Fluorescence images of continuous DNA separation under different field strengths and frequencies. Four DNA species were used, including (1) 61 kb, (2) 114 kb, (3) 158 kb and (4) 209 kb. (B) DNA separation into only two bands under a low field. (C) Fully resolved DNA separation using a high field. (D) DNA sample fractions collected through different channels into different reservoirs (reprinted by permission from Macmillan Publishers Ltd: Nat. Biotechnol.ref. 37, copyright 2002). | ||
Clogging and hooking onto the posts are two common problems associated with using nanopillars for pulsed-field electrophoresis of DNA. Also, DNA molecules do not always stay uniformly extended in a hexagonal array and, thus, do not always retrace the same paths. More studies are required to address these issues.
Nanopillar structures inside a microchannel have proven their performance as novel sieving matrices. Unlike conventional DNA electrophoresis, where long DNA can only be separated in an alternating field, quartz-made nanopillar (500 nm diameter, 1 μm spacing) channels were used to fractionate 48.5 and 165.6 kbp DNA in a 380 μm-long region in 10 s using 100 V cm−1 (Fig. 3).41 It was confirmed that smaller molecules moved faster than larger ones, indicating that the nanopillars worked as a sieving matrix. Interestingly, it was discovered that efficient separations could be achieved by adjusting the nanopillar diameter and spacing based on the gyration radii of the DNA molecules. Many other factors, such as nanopillar geometry and array patterns, affect the performance of nanopillar chips. Simulations and experimental results showed that suppression of electroosmosis was a crucial factor in achieving high resolution.42 For fixed pillar diameter and spacing, two different distributions of nanopillars, tilted and square, were studied.43 Conformational changes in the DNA were observed in arrays with a square distribution, however, no separation was achieved. Nanopillars with a tilted distribution worked effectively as sieves for size separation of DNA. It was claimed that reptile behavior of DNA44,45 in nanopillar arrays was an important factor for successful separation. However, experimental work by Viory and coworkers46,47 and Dorfman and coworkers48,49 showed that post arrays separate DNA without reptation. Nanopillar arrays with a hexagonal configuration embedded in a microchannel were reported for long DNA separation in microchip capillary electrophoresis.50–52 A novel nanofence array provided the same resolving power of a hexagonal nanopost array by ensuring efficient collision between the molecules and the posts, and further improvement in resolution was expected.53
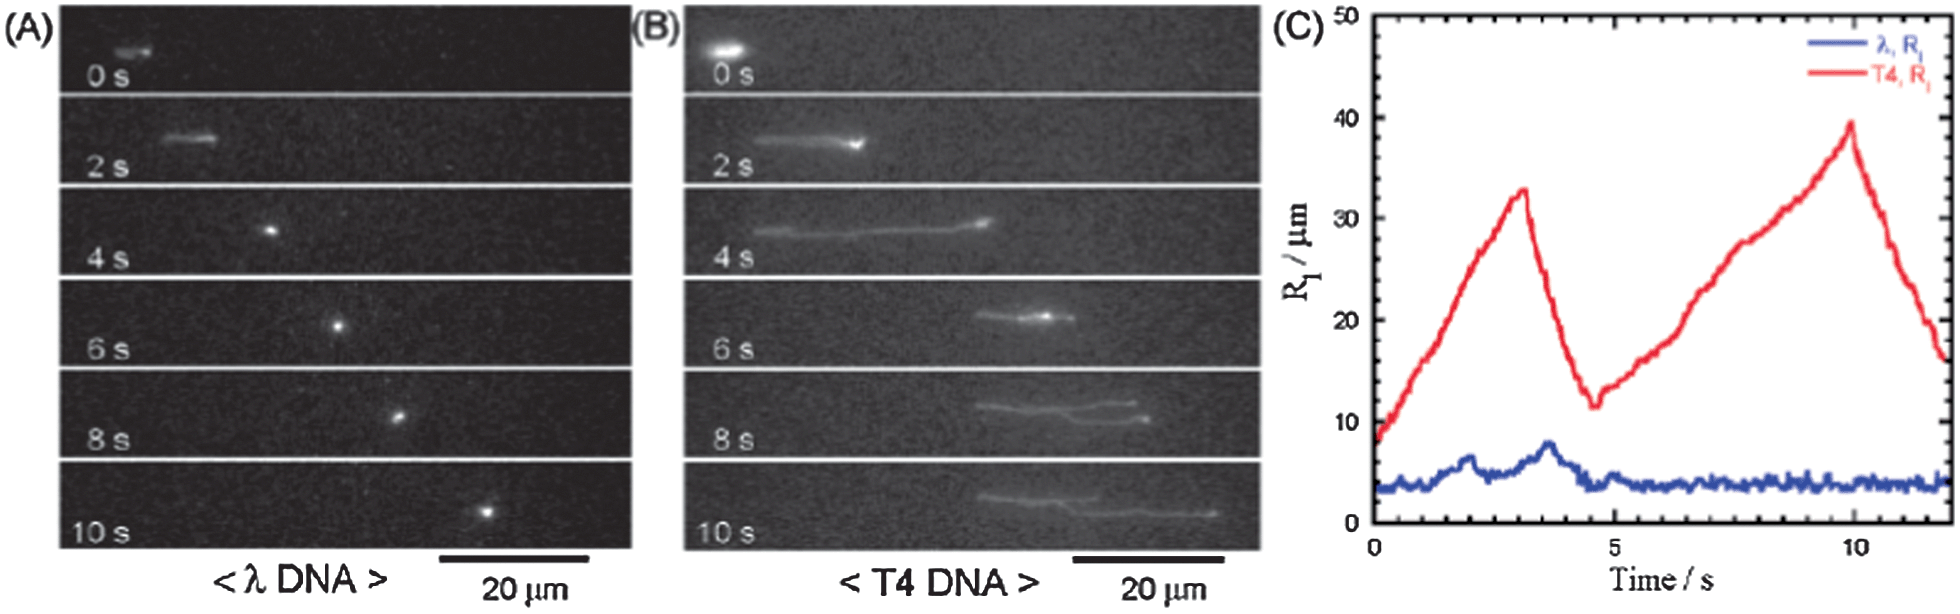 | ||
| Fig. 3 Fluorescence micrographs showing the migration of single (A) λ DNA and (B) T4 DNA in a 500 nm-spaced nanopillar channel at 7 V cm−1. (C) Plot of the horizontal DNA radii (Rl) versus time, which indicates that T4 DNA formed a U-shape while λ DNA retained a spherical conformation (reprinted with permission from ref. 41. Copyright 2004 American Chemical Society). | ||
A variety of simulations and experimental studies have been conducted on the separation mechanisms in micro/nanopillar arrays.54–59 An excellent discussion of these various models is given in a review by Dorfman.60 The general theory is that, in a post array, when the spacing between the obstacles is smaller than Rg, DNA separation takes place by biased reptation.21 When the spacing is larger than Rg, the separation is affected by the collisions between the molecules and the posts, which induce conformational changes.57–59
2.2 Diffusion sorting (Brownian ratchets)
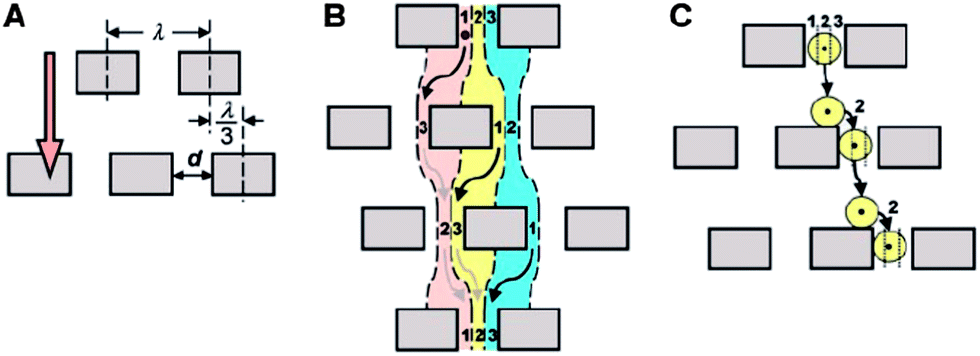
Brownian motion is the random movement of particles in a solution. By taking advantage of the fact that molecules diffuse laterally as they migrate, Duke and Austin61 and Ertas62 proposed that a regular lattice of asymmetric obstacles can be constructed to permit Brownian motion essentially in only one direction, guiding the diffusing molecules in specific directions depending on their diffusion coefficients (Fig. 4). Since small molecules diffuse faster than large molecules, a mixture of particles can be sorted based on size.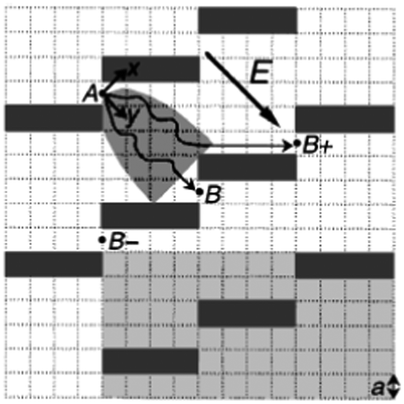 | ||
| Fig. 4 Schematic diagram showing how diffusion sorting works in a sieve consisting of a regular lattice of rectangular obstacles. Molecules are driven by an electric field. A molecule which passes gap A visits the parabolic shaded area and subsequently goes to B or B+. Small, fast-diffusing molecules have a higher probability of reaching B+ than large molecules (reprinted with permission from ref. 61. Copyright 1998 by The American Physical Society). | ||
There are two types of Brownian ratchets: thermal (also referred to as one-dimensional time-dependent) ratchets and steric (also referred to as two-dimensional geometrical) ratchets. In a thermal ratchet, the particles are subjected to a time-varying asymmetric potential. When the potential is switched on, the particles are driven by electrophoretic force or pressure;63 whereas, when the potential is switched off, the particles diffuse freely. This approach has been demonstrated as an effective method to separate particles according to size.64–66 On the other hand, in a steric ratchet (developed by Duke and Austin, and Ertas), particles are driven by a time-independent potential and constrained by a two-dimensional asymmetric array of obstacles. The advantages of this system are that particles of different shapes or sizes move in different directions and can be collected at specific locations for downstream analysis, and the separation can be operated in a continuous mode. The theory proposed by Duke and Austin predicts that the fractional resolution is a function of the number of obstacles, N (typically on the order of 104), and a dimensionless variable, D/νa, where D is the particle diffusion coefficient, ν is the electrophoretic drift velocity and a is the barrier gap size. It was suggested that, for a particular array geometry (rectangular obstacles set at an angle of 45° to the direction of the applied potential), good resolution could be obtained in the range of 0.02 < D/νa < 0.3. Experiments showed that ∼100 kbp DNA molecules67,68 and phospholipids69 could be fractionated in such devices. However, there was a discrepancy between the theoretical and experimental D/νa values. Later, it was discovered70 that particles much smaller than the barrier gap were poorly fractionated. An array with a gap size of 1 μm failed to deflect DNA molecules ten times smaller (411 bp, 117 nm). Effective fractionation in asymmetric arrays requires the molecular size to be comparable to the barrier gap size.
One of the limitations of the Brownian ratchet technique is that it is an inherently slow process because it relies on diffusion, and only a low flow rate (2 μm s−1) can be used. Furthermore, particles must be injected at the same point, so the overall throughput is low. In order to reduce the analysis time and improve the performance of a ratchet with a given array geometry, the electrophoretic flow direction was tilted at a small angle relative to the array axis (Fig. 5), which resulted in higher fractionation speed because more diffusing molecules were ratcheted at each step in the array. Using a 12 mm-long array, DNA molecules of 48.5 and 164 kbp were separated with resolution and speed improvements of 3 and 10 times, respectively.71
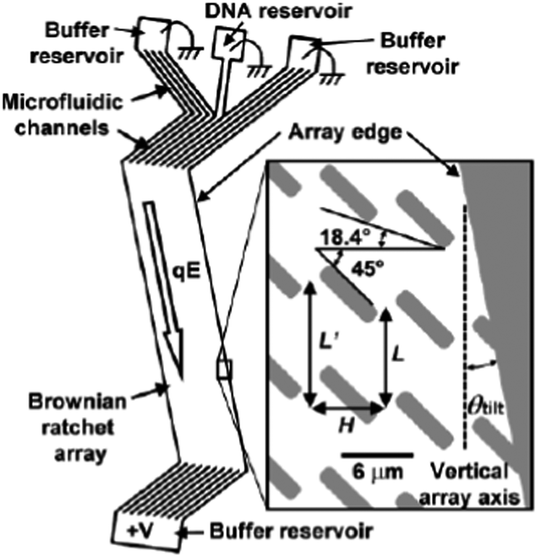 | ||
| Fig. 5 Schematic diagram illustrating a Brownian ratchet device in which the electrophoretic flow direction is tilted at an angle of θtilt with respect to the array axis to achieve higher fractionation speed (reprinted with permission from ref. 71. Copyright 2003 American Chemical Society). | ||
In principle, Brownian ratchet arrays are not limited to DNA separations, but should also be applicable to proteins. Electron-beam lithography and nanoimprint lithography can produce features as small as 10 nm,11 which is on the same order of magnitude as the size of proteins. However, such small pathways can be easily clogged. Therefore, the practicality of applying this technique to separate proteins is questionable.
In addition to diffusivity-dependent ratchet systems, recent studies have shown that molecules with the same D/νa, but different molecular structures, can be separated by combining the self-spreading phenomenon72,73 with the Brownian ratchet mechanism. Without requiring an external bias, Motegi et al.74 demonstrated the use of a self-spreading lipid bilayer to induce different diffusivities in protein complexes (CTB-GM1) that had different configurations. They proposed a new geometrical model to explain the exceptionally high D/νa value and high separation angle observed.
2.3 Deterministic lateral displacement (DLD)
This method of separation was first developed by Huang et al.75 and utilizes the asymmetric bifurcation of laminar flow through an array of obstacles to separate particles by their hydrodynamic sizes. In a DLD device, each row of obstacles is slightly offset laterally with respect to the previous row to create equivalent migration paths for all particles of a given size (Fig. 6). The basic separation principle is called “bumping”. Particles smaller than a critical size follow the fluid flow direction and travel in a zigzag mode, whereas particles larger than the critical size are deflected by the post array and eventually become laterally displaced (displacement mode). The critical size, Dc, at which the transition between the two modes occurs, was empirically deduced by Davis76| Dc,n = 1.4dNn−0.48 |
 | ||
| Fig. 6 Mechanisms of particle separation via deterministic lateral displacement (DLD). (A) In a DLD device, each row of obstacles is slightly offset laterally with respect to the previous row. (B) Small particles follow the laminar flow streams and stay in the same lane. (C) Large particles are continuously deflected by the post array and become laterally displaced. (From ref. 75 reprinted with permission from AAAS). | ||
The difference between the Brownian ratchet and DLD mechanisms is that for a Brownian ratchet, separation depends on diffusion and, thus, only works for small particles such as proteins and DNA, which are affected by Brownian motion, whereas in a bump array, separation depends on a deterministic process (hydrodynamic effects), and higher flow velocity can be used to achieve better resolution. Using a bump array, Huang et al.75 demonstrated that both hard spheres (polystyrene beads) and soft spheres (bacterial artificial chromosomes) were fractionated rapidly with a resolution as low as 10 nm, which is better than hydrodynamic chromatography and quasi-elastic laser light scattering. Based on this work, Davis et al.80 investigated three different types of arrays: single array, chirped array and cascade array, each of which has a different mode of separation and a different dynamic range (maximum particle size that can flow through the array without clogging). White blood cells, red blood cells, platelets and plasma were successfully separated from whole blood with no dilution at flow velocities of 1000 μm s−1 and volumetric flow rates up to 1 μL min−1. Since then, cell sorting has become a major application of DLD devices.77,81–87 In addition to polymer beads, DNA and cells, the technique has also been used for continuous-flow separation of bacteria,88 fungal spores89 and parasites.90 These objects cover a broad size range from 100 nm (ref. 91) to 30 μm.
For separation of samples with a broad size distribution, Beech and Tegenfeldt92 demonstrated a DLD device fabricated from polydimethylsiloxane (PDMS) which could be deformed to change the critical size during the separation. Recently, Loutherback et al.93,94 reported that changing the post shape from circular to triangular increased the dynamic range of DLD arrays. For the same gap width, an array using triangular posts could separate smaller particles, thereby reducing clogging. Circular post arrays use a single-direction flow, while triangular post arrays use an oscillating flow. In addition to the two transport modes discovered for the circular post array, a third possible behavior was observed only in an array with triangular posts. When a particle fell between two critical sizes, it underwent a net displacement relative to the flow after one cycle of flow direction, whereas a particle outside that window showed no net displacement. It was recommended that triangular instead of circular posts should be employed for future DLD designs. Novel operating conditions could include the integration of dielectrophoresis95 or gravity.96
3 Nanoplane gap structures
3.1 Entropic trapping and Ogston sieving
As mentioned briefly earlier, when the mean pore size is commensurate with the radius of gyration of a DNA molecule (a ≈ Rg), the sieving process is in the entropic trapping regime. When a DNA molecule is placed in an environment containing different-sized pores, there is a competition between distribution of the chain among different pores and squeezing of the entire chain into a single pore. In order to squeeze into a narrow region, the DNA molecule must overcome an entropic energy barrier resulting from the limited configurational freedom as it passes through. The concept of entropic trapping was first reported in the context of gel electrophoresis.97 However, the theoretical results from these studies also apply directly to micro/nanostructures.98Although entropic trapping exists in micropillar arrays,35,99 nanoplane gap structures are more suitable for studying the mechanism because the thin entropic traps can be easily microfabricated to the sizes of the DNA molecules, which are typically in the sub-100 nm range.100 Han et al. demonstrated entropic trapping of long DNA in a dc field using a structure consisting of thousands of alternating shallow (ds = 90 nm) and deep (dd = 1 μm) regions.101 A unique aspect of this type of entropic trapping is that the electrophoretic mobilities of DNA molecules increase with molecular weight. Molecules overcome the energy barrier by stretching through the constrictions. Longer molecules move faster because they have a larger contact area with the thin gap regions and have higher probability of forming a loop and escaping.
In a nanofilter array, the separation resolution depends on the electric field strength. At very low electric fields, the electrophoretic force is not strong enough to help molecules overcome the entropic energy barrier. Therefore, DNA molecules are trapped indefinitely. This fact can be used to control sample injection.34 Low fields provide better resolution, but lead to slow separation.102,103 In order to perform parallel analyses, a device with two identical nanofilter arrays (15 mm long, ds = 75–100 nm, dd = 1.5–3 μm) was fabricated. Two different DNA samples (5–50 kbp) were analyzed simultaneously in ∼30 min.102 Unlike traditional PFGE where only a low dc range (1–10 V cm−1) can be used, separation was still observed at 128 V cm−1.
In entropic trapping, the conformational freedom of the molecules is limited and they must deform to pass through the thin gap regions.99,104 On the other hand, in Ogston sieving, the molecules move through the pores as semi-flexible chains (Fig. 7).105 However, their configurational freedom is limited due to steric repulsion from the wall. This results in a configurational entropic energy barrier, which the molecules must overcome in order to pass through any shallow regions.106 Small molecules move faster than large molecules in an Ogston sieve. Using a nanofilter array, size separation of SDS–protein complexes (cholera toxin subunit, 11.4 kDa; lectin phytohemagglutinin-L, 120 kDa; and low density human lipoprotein, 179 kDa) was achieved in 4 min with a separation length of 5 mm at 90 V cm−1, and small DNA molecules (50–766 bp) were fractionated in 10 min at 70 V cm−1.107 Fu et al. demonstrated the distinct transition from Ogston sieving to entropic trapping using DNA molecules in the size range from 0.5–8 kbp in a ds = 73 nm nanofilter array. It was clearly shown that, in the Ogston sieving region, the mobility decreased as the molecular weight increased; in the entropic trapping regime, the mobility increased with DNA length.105
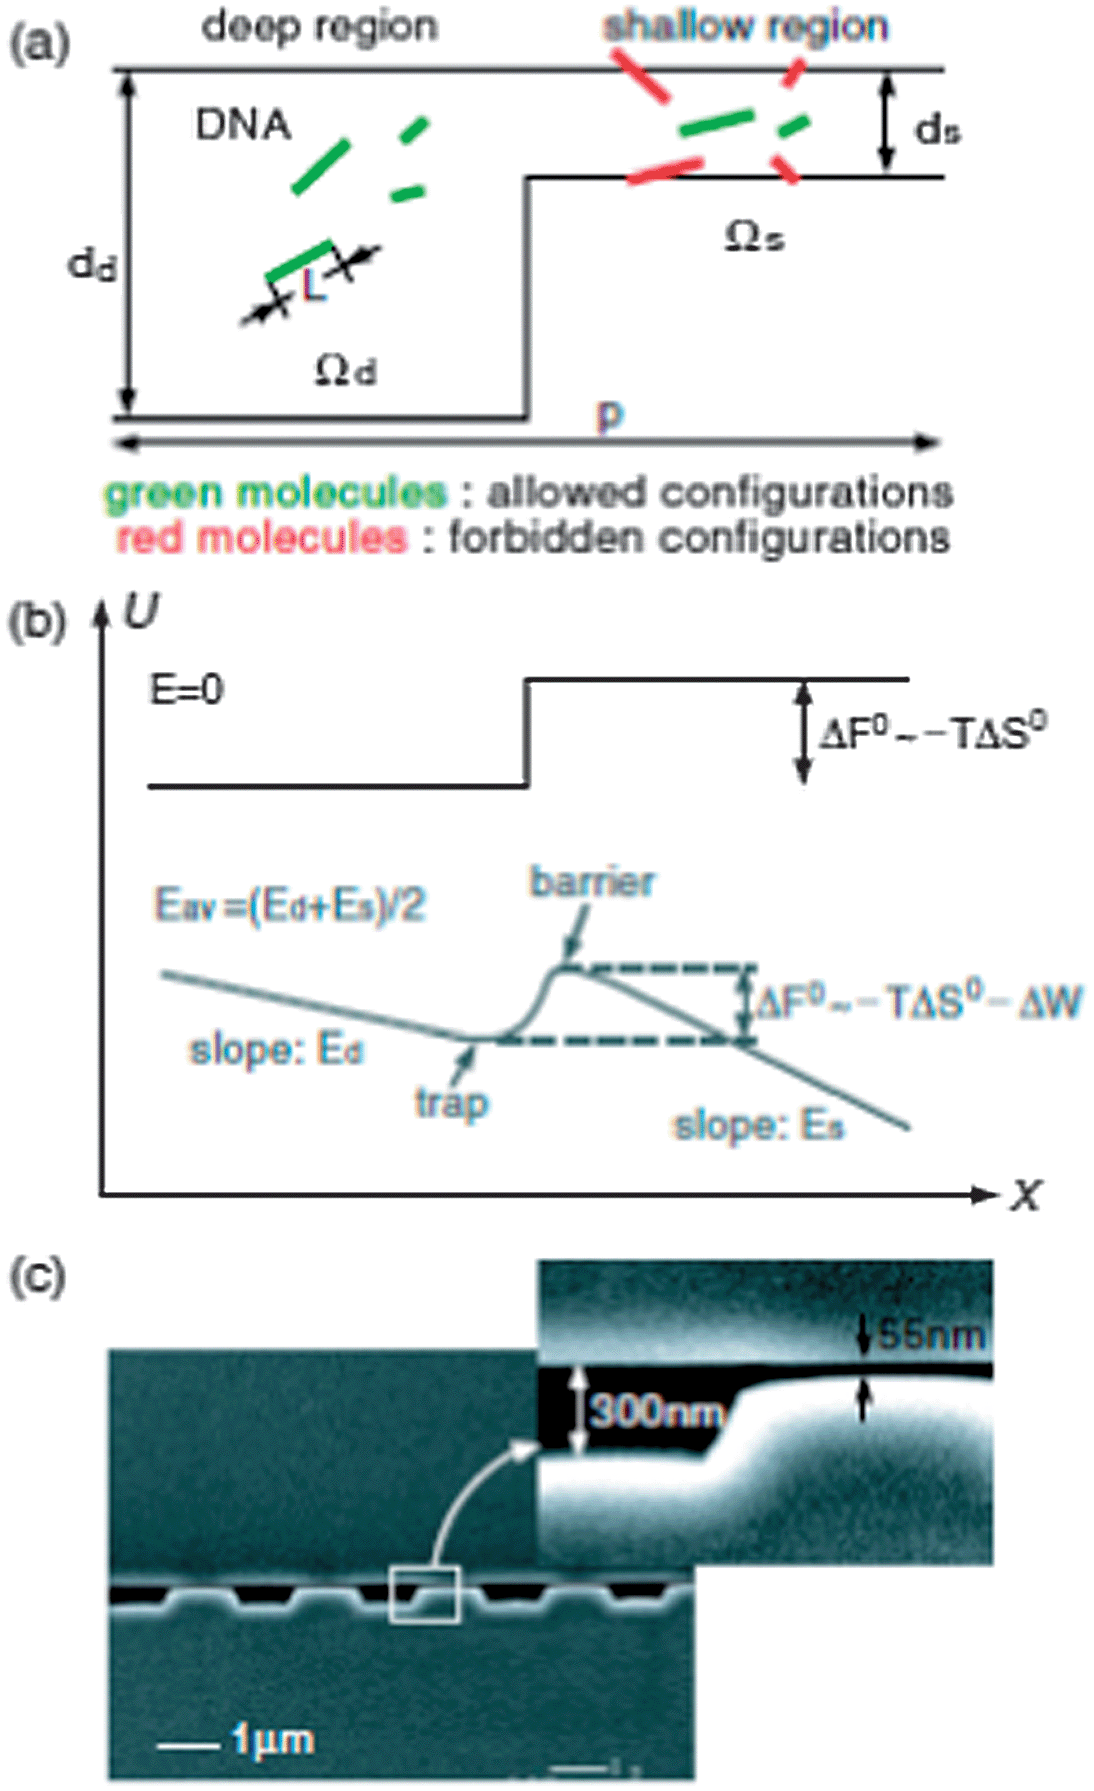 | ||
| Fig. 7 (a) Schematic diagram illustrating the partitioning of rod-like DNA molecules between the deep and shallow regions of a nanofilter. (b) Free-energy landscape of a DNA molecule as it moves across a nanofilter. (c) SEM image of a nanofilter consisting of alternating deep (300 nm) and shallow (55 nm) regions of equal length (1 μm) (reprinted with permission from ref. 105. Copyright 2006 by The American Physical Society). | ||
Compared to other miniaturized systems,37 DNA analysis using a nanofilter array has the disadvantages of slow separation and, hence, low throughput. On the other hand, both theoretical and experimental studies showed that rapid separations can be achieved at high electric fields using the device shown in Fig. 7, although admittedly sacrificing some resolution.108,109
The sample processing rate can be increased by simply upscaling the channel depths to create high aspect ratio (depth-to-width ratio) nanochannels.110 Anisotropic KOH etching provided an attractive method for fabrication of such nanochannels.111 In order to resolve the low volume throughput limitation, Fu et al. developed a two-dimensional anisotropic nanofilter array (ANA) operated with two orthogonal electric fields for continuous-flow separation.112 The structural anisotropy in the 2D nanofilter caused molecules of different size, charge or hydrophobicity to follow different trajectories. Broad size ranges of DNA (50 bp to 23 kbp) and proteins (10–400 kDa) were fractionated in a few minutes. Both entropic trapping and Ogston sieving were demonstrated.110,112,113
3.2 Size exclusion separation
The concept of size exclusion applies to situations where particles are not able to pass a restriction due to steric hindrance and become excluded by size. DNA molecules can elongate and reptate through pores smaller than their Rg. However, rigid polymer beads, viruses and proteins in their natural states usually cannot be separated via entropic trapping or by a reptation mechanism. Some interesting systems were designed on the basis of size exclusion for trapping and separation of these target analytes.PDMS nanochannels with tunable cross-sections permit multiple modes of nanofluidic sieving and trapping within a single device for a given sample.114 Reversible channel deformation provided size selectivity; when a force was applied, the channel trapped particles consistent with the cross-sectional size, and the particles were released upon removal of the applied force. A simple method to operate nanofluidic devices without the use of an external field utilized capillary action and evaporation effects to drive flow inside the channels.115 The structures consisted of an array of parallel planar nanochannels. Each channel contained one or two height steps. The tall segments were below 200 nm and the short segments were in the range of 10–100 nm, according to the size distribution of the sample to be analyzed. The trapping of 120 and 30 nm polymer beads and virus capsids was demonstrated. One limitation of the technique is that capillary action was not sufficient to overcome the configurational entropic barrier imposed by Ogston sieving. The channels were easily clogged due to the keystone effect. Surfactant and AC agitation were required in order to reduce channel clogging.116 However, it was concluded that this one-dimensional design was not suitable for separating complex mixtures. A very similar size fractionation method was reported using a single micro/nanochannel containing a height step. The operating principle was based on application of shear-driven flow, which was generated by mechanically moving the bottom half of a flat-rectangular channel past the top half.117,118 Size separations of mixtures of polymer beads and cells were demonstrated.
Stavis et al. presented the first three-dimensional nanofluidic structure with the ability to resolve nanoparticle size differences.119,120 This structure took advantage of the “binning” mechanism, where particles with diameter, D, in the range of ds < D < dd were excluded from regions with depths d ≤ ds. Proof-of-principle experiments demonstrated the size separation capability of structures with staircase function surface topographies. A prototype device had a maximum depth of ∼620 nm, a minimum depth of ∼80 nm, and an average step size of ∼18 nm. A bimodal nanoparticle mixture was separated in ∼10 s within a 100 μm channel width. The nanoscale confinement effects on DNA were also investigated. The separation resolution was defined by the nanofluidic step size, which could be further improved via patterning narrower steps.
4 Artificial nanoporous membranes
Membrane permeation is a simple and easy-to-implement technique for particle separation. It has been widely used for gas separation, sample filtration/preconcentration and sensing.121–123 The transport selectivity of a membrane can be engineered for different properties including charge, size and chemical interactions. An ideal membrane-based “molecular filter” should have uniform pore-size distribution throughout the entire thickness of the membrane, allow high analyte flux and have good mechanical and chemical stability. Depending on the relationship between the membrane thickness and pore size, nanoporous membranes can be categorized into two types: nanochannel arrays, if the membrane thickness is larger than the diameter of the pores, and nanopores or nanosieves, if the membrane thickness is on the same order as (or smaller than) the pore diameter. Nanochannels typically are more mechanically robust, whereas nanopores are characterized by lower flow resistance and higher flux.The production of membranes via track-etching techniques (i.e., irradiation or chemical etching) was proposed approximately a half century ago.124 Track-etched polymeric membranes have a very narrow pore size distribution. The pore diameter can range from 10 nm to tens of micrometers. Jirage et al. demonstrated nanofiltration (<2 nm) of the small molecules, pyridine and quinine, by combing track-etched polycarbonate filters with cylindrical 30 nm pores and gold nanotubules. By using sufficiently long plating time, the pore size of the Au nanotubules embedded in the membranes was reduced to less than 1 nm.125 Kuo et al. used nuclear track-etched polycarbonate membrane arrays with pore sizes of 200 nm or 15 nm to interface fluidic layers in a 3D microchip electrophoresis system.126,127 Separation and selective collection of amino acids were demonstrated. The flexibility of analyte transfer was demonstrated by nonselective and mass-selective transport of dextrans via adjustment of the pore parameters. Most track-etched membranes are made of polymer with a thickness of, at least, several micrometers.128 Vlassiouk et al. reported a 100 nm thick silicon nitride (SiN) membrane prepared by ion track-etching.129 The porosity was controlled by the number of irradiating ions, whereas the pore size could be tuned between ∼10 and 50 nm depending on the etching time. These membranes could differentiate small dyes of different charges and proteins of different sizes.
Micro/nanofabricated membranes have the potential to advance biomolecule separation processes by offering more precisely controlled structures and allowing the optimization of membrane parameters including porosity, pore geometry and pore surface chemistry.130 The first ultrathin (∼10 nm) SiN membrane was created using focused-ion beam etching (FIB), which gave uniform pores of 25 nm or less than 10 nm.131 However, this process was too slow for high volume manufacturing. Striemer et al. reported the first use of an ultrathin (15 nm) porous nanocrystalline silicon (pnc-Si) membrane with pore sizes from 5 nm to 25 nm for size- and charge-based separations.132 It was discovered that the pore size could be tuned by varying the annealing temperature, making pnc-Si membranes ideal for size-selective separation of large biomolecules, such as DNA and proteins. Fractionations of gold nanoparticles and proteins were demonstrated with better than 5 nm resolution.133 Theoretical analysis was performed by comparing the separation results with one- and three-dimensional models of diffusion through 15 nm membranes.134 The models predicted that the molecularly thin membranes should have better resolution than thicker membranes with the same pore diameters and porosities.
In the work mentioned above, it was observed that SiN membranes only blocked similarly charged molecules and permitted the passage of oppositely charged molecules. Therefore, they can be functionalized to separate similarly sized molecules on the basis of charge. For instance, using the same fabrication procedures, Osmangeyoglu et al. developed a thin (0.7–1 μm) nanoporous anodic alumina membrane with pore sizes from 20 nm to 30 nm.135 Electrostatic sieving was explored for separation of bovine serum albumin (BSA) and bovine hemoglobin (BHb), which have similar molecular weights, but different isoelectric points. At a pH equal to the pI of BSA, the neutral molecules did not interact electrostatically with the membrane surface and diffused through the pores easily, whereas BHb, which has a different pI, diffused more slowly due to interactions with the membrane and the electrical double layer at low ionic strength. Anodic alumina membranes were also used for size separation of DNA and proteins.136,137 Besides charge and size, the molecular permeability can also be controlled through chemical interactions. Li and Ito characterized the size-exclusion properties of polystyrene–poly(methylmethacrylate) diblock copolymers (PS-b-PMMA) that contained nanopores with 12 nm-ferritin using an electrochemical approach.138 The nanopores were modified with polyethylene glycol to reduce nonspecific adsorption.
FIB and electron-beam lithography can generate structures with excellent uniformity. However, the processes are expensive and not suitable for large-scale production.130,139,140 Montagne et al. demonstrated an inexpensive fabrication method for SiN membranes by combining block copolymer (BCP) self-assembly and conventional microfabrication techniques.141 Size-based filtration experiments were conducted with dextrans of different molecular weight, achieving good selectivity. In addition to 2D membranes, Randall et al. fabricated 3D membranes shaped as cubes with five porous faces and one open face, and used them for size-selective sampling.142 Compared to 2D flat membranes, the 3D membranes had a greater surface-to-volume ratio. As these membranes were moved though liquids, they retained nanobeads and cells.
The utilization of nanoporous membranes for biomolecule separation necessitates the ability to tailor pore surface properties. Using block copolymers as templates in fabrication seems to be a promising strategy.143,144 Rzayev and Hillmyer145 demonstrated the synthesis and subsequent modification of nanoporous polymer monoliths using triblock copolymers. The robustness and versatility of this method allows for control over the surface chemistry of the membranes and selectivity in the separation process.
5 Conclusions
Micro/nanofabricated structures have opened new possibilities for efficient separation of biomolecules. Advances in fabrication techniques enable researchers to control geometrical designs at will and provide insight into separation mechanisms at the molecular level. Multi-dimensional or anisotropic structures hold great future promise for high resolution, high throughput separations. Although many challenges continue to plague research efforts, such as nonspecific adsorption, clogging and detection of extremely low-concentration analytes, there is no doubt that nanotechnologies will continue to grow at a rapid pace, since they offer unique opportunities that are not addressed by any of the conventional methods.Notes and references
- F. A. Messaud, R. D. Sanderson, J. R. Runyon, T. Otte, H. Pasch and S. K. R. Williams, Prog. Polym. Sci., 2009, 34, 351–368 CrossRef CAS PubMed.
- M. Szumski and B. Buszewski, Crit. Rev. Anal. Chem., 2002, 32, 1–46 CrossRef CAS.
- P. N. Nge, C. I. Rogers and A. T. Woolley, Chem. Rev., 2013, 113, 2550–2583 CrossRef CAS PubMed.
- R. Mukhopadhyay, Anal. Chem., 2006, 78, 7379–7382 CrossRef CAS.
- R. B. Schoch, J. Han and P. Renaud, Rev. Mod. Phys., 2008, 80, 839–883 CrossRef CAS.
- W. Sparreboom, A. van den Berg and J. C. T. Eijkel, Nat. Nanotechnol., 2009, 4, 713–720 CrossRef CAS PubMed.
- L. Bocquet and E. Charlaix, Chem. Soc. Rev., 2010, 39, 1073–1095 RSC.
- H. Daiguji, Chem. Soc. Rev., 2010, 39, 901–911 RSC.
- S. Y. Chou, P. R. Krauss, W. Zhang, L. Guo and L. J. Zhuang, J. Vac. Sci. Technol., B: Microelectron. Nanometer Struct.–Process., Meas., Phenom., 1997, 15, 2897–2904 CrossRef CAS.
- W. Hu, K. Starveswaran, M. Lieberman and G. H. J. Bernstein, J. Vac. Sci. Technol., B: Microelectron. Nanometer Struct.–Process., Meas., Phenom., 2004, 22, 1711–1716 CrossRef CAS.
- J. Guo, Adv. Mater., 2007, 19, 495–513 CrossRef.
- J. W. Jeong, W. I. Park, L. M. Do, J. H. Park, T. H. Kim, G. Chae and Y. S. Jung, Adv. Mater., 2012, 24, 3526–3531 CrossRef CAS PubMed.
- H. A. Stone, A. D. Stroock and A. Ajdari, Annu. Rev. Fluid Mech., 2004, 36, 381–411 CrossRef.
- H. Craighead, Nature, 2006, 442, 387–393 CrossRef CAS PubMed.
- D. Mark, S. Haeberle, G. Roth, F. von Stetten and R. Zengerle, Chem. Soc. Rev., 2010, 39, 1153–1182 RSC.
- P. S. Dittrich and A. Manz, Nat. Rev. Drug Discovery, 2006, 5, 210–218 CrossRef CAS PubMed.
- W. D. Volkmuth and R. H. Austin, Nature, 1992, 358, 600–602 CrossRef CAS PubMed.
- S. B. Smith, P. K. Aldridge and J. B. Callis, Science, 1989, 243, 203–206 CAS.
- D. C. Schwartz and M. Koval, Nature, 1989, 338, 520–522 CrossRef CAS PubMed.
- J. Sambrook and W. Russel, Molecular Cloning, Cold Spring Harbor Laboratory Press, Cold Spring Harber, NY, 3rd edn, 2001, ch. 5 Search PubMed.
- J. L. Viory, Rev. Mod. Phys., 2000, 72, 813–872 CrossRef.
- J. L. Viory, F. Miomandre, M. C. Miquel, F. Caron and F. Sor, Electrophoresis, 1992, 13, 1–6 CrossRef PubMed.
- C. Turmel, E. Brassard, G. W. Slater and J. Noolandi, Nucleic Acids Res., 1990, 18, 569–575 CrossRef CAS PubMed.
- D. C. Schwartz and C. R. Cantor, Cell, 1984, 37, 67–75 CrossRef CAS.
- T. A. J. Duke and J. L. Viory, J. Chem. Phys., 1992, 96, 8552–8563 CrossRef CAS.
- M. S. Hutson, G. Holzwarth, T. A. J. Duke and J. L. Viovy, Biopolymers, 1995, 35, 297–306 CrossRef CAS.
- L. M. Neitzey, G. Holzwarth, T. A. J. Duke and J. L. Viory, Biopolymers, 1995, 35, 307–317 CrossRef CAS.
- A. G. Ogston, Trans. Faraday Soc., 1958, 54, 1754–1757 RSC.
- C. J. O. R. Morris, Protides Biol. Fluids, 1967, 14, 543–551 Search PubMed.
- D. Rodbard and A. Chrambach, Proc. Natl. Acad. Sci. U. S. A., 1970, 4, 970–977 CrossRef.
- T. A. J. Duke, R. H. Austin, E. C. Cox and S. S. Chan, Electrophoresis, 1996, 17, 1075–1079 CrossRef CAS PubMed.
- E. M. Southern, R. Anand, W. R. A. Brown and D. S. Fletcher, Nucleic Acids Res., 1987, 15, 5925–5943 CrossRef CAS PubMed.
- O. Bakajin, T. A. J. Duke, J. Tegenfeldt, C. F. Chou, S. S. Chan, R. H. Austin and E. C. Cox, Anal. Chem., 2001, 73, 6053–6056 CrossRef CAS.
- J. Han, S. W. Turner and H. G. Craighead, Phys. Rev. Lett., 1999, 83, 1688–1691 CrossRef CAS.
- M. Cabodi, S. W. P. Turner and H. G. Craighead, Anal. Chem., 2002, 74, 5169–5174 CrossRef CAS.
- S. W. P. Turner, P. A. Lopez and H. G. Craighead, J. Vac. Sci. Technol., B: Microelectron. Nanometer Struct.–Process., Meas., Phenom., 1998, 16, 3835–3841 CrossRef CAS.
- L. R. Huang, J. O. Tegenfeldt, J. J. Kraeft, J. C. Sturm, R. H. Austin and E. C. Cox, Nat. Biotechnol., 2002, 20, 1048–1053 CrossRef CAS PubMed.
- Z. Chen and K. D. Dorfman, Phys. Rev. E: Stat., Nonlinear, Soft Matter Phys., 2013, 87, 012723(12) Search PubMed.
- Y. Zeng, M. He and D. J. Harrison, Angew. Chem., Int. Ed., 2008, 47, 6388–6391 CrossRef CAS PubMed.
- M. Baba, T. Sano, N. Iguchi, K. Lida, T. Sakamoto and H. Kawaura, Appl. Phys. Lett., 2003, 83, 1468–1470 CrossRef CAS.
- N. Kaji, Y. Tezuka, Y. Takamura, M. Ueda, T. Nishimoto, H. Nakanishi, Y. Horrike and Y. Baba, Anal. Chem., 2004, 76, 15–22 CrossRef CAS PubMed.
- N. Kaji, A. Oki, R. Ogawa, Y. Takamura, T. Nishimoto, H. Nakanishi, Y. Horike, M. Tokeshi and Y. Baba, Isr. J. Chem., 2007, 47, 161–169 CrossRef CAS.
- R. Ogawa, N. Kaji, S. Hashioka, Y. Baba and Y. Horike, Jpn. J. Appl. Phys., 2007, 46, 2771 CrossRef CAS.
- L. S. Lerman and H. L. Frisch, Biopolymers, 1982, 21, 995–997 CrossRef CAS PubMed.
- O. J. Lumpkin and B. H. Zimm, Biopolymers, 1982, 21, 2315–2316 CrossRef CAS PubMed.
- N. Minc, C. Futterer, K. D. Dorfman, A. Bancaud, C. Gosse, C. Goubault and J. L. Viory, Anal. Chem., 2004, 76, 3770–3776 CrossRef CAS PubMed.
- N. Minc, P. Bokov, K. B. Zeldovich, C. Futterer, J. L. Viory and K. D. Dorfman, Electrophoresis, 2005, 26, 362–375 CrossRef CAS PubMed.
- J. Ou, J. Cho, D. W. Olson and K. D. Dorfman, Phys. Rev. E: Stat., Nonlinear, Soft Matter Phys., 2009, 79, 061904(4) CrossRef.
- J. Ou, M. N. Joswiak, S. J. Carpenter and K. D. Dorfman, J. Vac. Sci. Technol., A, 2011, 29, 011025(2) Search PubMed.
- Y. C. Chan, Y. K. Lee and Y. Zohar, J. Micromech. Microeng., 2006, 16, 699–707 CrossRef CAS.
- J. Shi, A. P. Fang, L. Malaquin, A. Pepin, D. Decanini, J. L. Viovy and Y. Chen, Appl. Phys. Lett., 2007, 91, 153114(3) Search PubMed.
- J. Ou, M. N. Joswiak, S. J. Carpenter and K. D. Dorfman, J. Vac. Sci. Technol., A, 2011, 29, 011025(5) Search PubMed.
- S. G. Park, D. W. Olson and K. D. Dorfman, Lab Chip, 2012, 12, 1463–1470 RSC.
- P. D. Patel and E. S. G. Shaqfeh, J. Chem. Phys., 2003, 118, 2941–2951 CrossRef CAS.
- A. Mohan and P. S. Doyle, Phys. Rev. E: Stat., Nonlinear, Soft Matter Phys., 2007, 76, 040903(4) CrossRef.
- A. Mohan and P. S. Doyle, Macromolecules, 2007, 40, 8794–8806 CrossRef CAS.
- G. I. Nixon and G. W. Slater, Phys. Rev. E: Stat. Phys., Plasmas, Fluids, Relat. Interdiscip. Top., 1994, 50, 5033–5038 CrossRef CAS.
- W. D. Volkmuth, T. Duke, M. C. Wu, R. H. Austin and A. Szabo, Phys. Rev. Lett., 1994, 72, 2117–2120 CrossRef CAS.
- G. B. Salieb-Beugelaar, K. D. Dorfman, A. van den Berg and J. C. T. Eijkel, Lab Chip, 2009, 9, 2508–2523 RSC.
- K. D. Dorfman, Rev. Mod. Phys., 2010, 82, 2903–2947 CrossRef CAS.
- T. A. J. Duke and R. H. Austin, Phys. Rev. Lett., 1998, 80, 1552–1555 CrossRef CAS.
- D. Ertas, Phys. Rev. Lett., 1998, 80, 1548–1551 CrossRef CAS.
- S. Matthia and F. Müller, Nature, 2003, 424, 53–57 CrossRef PubMed.
- J. Rousselet, S. Laurence, A. Ajdari and J. Prostt, Nature, 1994, 370, 446–447 CrossRef CAS PubMed.
- L. P. Faucheux and A. Libchaber, J. Chem. Soc., Faraday Trans., 1995, 91, 3163–3166 RSC.
- J. S. Bader, R. W. Hammond, S. A. Henck, M. W. Deem, G. A. McDermott, J. M. Bustillo, J. W. Simpson, G. T. Mulhern and J. M. Rothberg, Proc. Natl. Acad. Sci. U. S. A., 1999, 96, 13165–13169 CrossRef CAS.
- C. F. Chou, O. Bakajin, S. W. P. Turner, T. A. J. Duke, S. S. Chan, E. C. Cox, H. G. Craighead and R. H. Austin, Proc. Natl. Acad. Sci. U. S. A., 1999, 96, 13762–13765 CrossRef CAS.
- L. R. Huang, E. C. Cox, R. H. Austin and J. C. Sturm, Anal. Chem., 2003, 75, 6963–6967 CrossRef CAS PubMed.
- A. van Oudenaarden and S. G. Boxer, Science, 1999, 285, 1046–1048 CrossRef CAS.
- L. R. Huang, P. Silberzan, J. O. Tegenfeldt, E. C. Cox, J. C. Strum, R. H. Austin and H. Craighead, Phys. Rev. Lett., 2002, 89, 178301–178304 CrossRef.
- L. R. Huang, E. C. Cox, R. H. Austin and J. C. Sturm, Anal. Chem., 2003, 75, 6963–6967 CrossRef CAS PubMed.
- H. Nabika, A. Sasaki, B. Takimoto, H. Sawai, S. He and K. J. Murakoshi, J. Am. Chem. Soc., 2005, 127, 16786–16787 CrossRef CAS PubMed.
- H. Nabika, N. Iijima, B. Takimoto, K. Ueno, H. Misawa and K. Murakoshi, Anal. Chem., 2009, 81, 699–704 CrossRef CAS PubMed.
- T. Motegi, H. Nabika and K. Murakoshi, Langmuir, 2012, 28, 6656–6661 CrossRef CAS PubMed.
- L. R. Huang, E. C. Cox, R. H. Austin and J. C. Strum, Science, 2004, 304, 987–990 CrossRef CAS PubMed.
- J. A. Davis, PhD thesis, Princeton University, 2008, p. 24.
- K. J. Morton, Proc. Natl. Acad. Sci. U. S. A., 2008, 105, 7434–7438 CrossRef CAS PubMed.
- M. Balvin, E. Sohn, T. Iracki, G. Drazer and J. Frechette, Phys. Rev. Lett., 2009, 103, 078301(4) CrossRef.
- R. Devendra and G. Drazer, Anal. Chem., 2012, 84, 10621–10627 CrossRef CAS PubMed.
- J. A. Davis, D. W. Inglis, K. J. Morton, D. A. Lawrence, L. R. Huang, S. Y. Chou, J. C. Sturm and R. H. Austin, Proc. Natl. Acad. Sci. U. S. A., 2006, 103, 14779–14784 CrossRef CAS PubMed.
- D. W. Inglis, K. J. Morton, J. A. Davis, T. J. Zieziulewicz, D. A. Lawrence, R. H. Austin and J. C. Sturm, Lab Chip, 2008, 8, 925–931 RSC.
- K. J. Morton, K. Loutherback, D. W. Inglis, O. K. Tsui, J. C. Sturm, S. Y. Chou and R. H. Austin, Lab Chip, 2008, 8, 1448–1453 RSC.
- D. W. Inglis, J. Immunol. Methods, 2008, 329, 151–156 CrossRef CAS PubMed.
- J. V. Green, M. Radisic and S. K. Murthy, Anal. Chem., 2009, 81, 9178–9182 CrossRef CAS PubMed.
- H. N. Joensson, M. Uhlen and H. A. Svahn, Lab Chip, 2011, 11, 1305–1310 RSC.
- D. W. Inglis, M. Lord and R. E. Nordon, J. Micromech. Microeng., 2011, 21, 054024(8) CrossRef.
- J. P. Beech, S. H. Holm, K. Adolfsson and J. O. Tegenfeldt, Lab Chip, 2012, 12, 1048–1051 RSC.
- K. J. Morton, Lab Chip, 2008, 8, 1448–1453 RSC.
- D. W. Inglis, N. Herman and G. Vesey, Biomicrofluidics, 2010, 4, 024109(8) Search PubMed.
- S. H. Holm, J. P. Beech, M. P. Barrett and J. O. Tegengeldt, Lab Chip, 2011, 11, 1326–1332 RSC.
- K. J. Morton, J. C. Sturm, R. H. Austin and S. Y. Chou, Proceedings of μTAS conference, 2006, vol. 1, pp. 1814–1817 Search PubMed.
- J. P. Beech and J. O. Tegenfeldt, Lab Chip, 2008, 8, 657–659 RSC.
- K. Loutherback, J. Puchalla, R. H. Austin and J. C. Sturm, Phys. Rev. Lett., 2009, 102, 045301(4) CrossRef.
- K. Loutherback, K. S. Chou, J. Newman, J. Puchalla, R. H. Austin and J. C. Sturm, Microfluid. Nanofluid., 2010, 9, 1143–1149 CrossRef.
- J. P. Beech and J. O. Tegenfeldt, Lab Chip, 2009, 9, 2698–2706 RSC.
- R. Devendra and G. Drazer, Anal. Chem., 2012, 84, 10621–10627 CrossRef CAS PubMed.
- E. Arvanitidou and D. Hoagland, Phys. Rev. Lett., 1991, 67, 1464–1466 CrossRef CAS.
- J. Fu, P. Mao and J. Han, Trends Biotechnol., 2008, 26, 311–320 CrossRef CAS PubMed.
- S. W. P. Turner, M. Cabodi and H. G. Craighead, Phys. Rev. Lett., 2002, 88, 128103(4) CrossRef.
- J. C. T. Eijkel and A. van den Berg, Electrophoresis, 2006, 27, 677–685 CrossRef CAS PubMed.
- J. Han, S. W. Turner and H. G. Craighead, Phys. Rev. Lett., 1999, 83, 1688–1691 CrossRef CAS.
- J. Han and H. G. Craighead, Science, 2000, 288, 1026–1029 CrossRef CAS.
- J. Han and H. G. Craighead, Anal. Chem., 2002, 74, 394–401 CrossRef CAS.
- D. Nykypanchuk, H. H. Stery and D. A. Hoagland, Science, 2002, 297, 987–990 CrossRef CAS PubMed.
- J. Fu, J. Yoo and J. Han, Phys. Rev. Lett., 2006, 97, 018103(4) CrossRef.
- P. Abgrall and N. T. Nguyen, Anal. Chem., 2008, 80, 2326–2341 CrossRef CAS PubMed.
- J. Fu, P. Mao and J. Han, Appl. Phys. Lett., 2005, 87, 263902(3) Search PubMed.
- N. Laachi, C. Declet, C. Matson and K. D. Dorfman, Phys. Rev. Lett., 2007, 98, 098106(4) CrossRef.
- E. A. Strychalski, H. W. Lau and L. A. Archer, J. Appl. Phys., 2009, 106, 024915(5) CrossRef PubMed.
- P. Mao and J. Han, Lab Chip, 2009, 9, 586–591 RSC.
- J. Han, J. Fu and R. B. Schoch, Lab Chip, 2008, 8, 23–33 RSC.
- J. Fu, R. B. Schoch, A. L. Stevens, S. R. Tannenbaum and J. Han, Nat. Nanotechnol., 2006, 2, 121–128 CrossRef PubMed.
- J. Fu, R. B. Schoch, A. L. Stevens, S. R. Tannenbaum and J. Han, Nat. Nanotechnol., 2007, 2, 121–128 CrossRef CAS PubMed.
- D. Huh, K. L. Mills, X. Y. Zhu, M. A. Burns, M. D. Thouless and S. Takayama, Nat. Mater., 2007, 6, 4242–4428 CrossRef PubMed.
- M. N. Hamblin, J. Xuan, D. Maynes, H. D. Tolley, D. M. Belnap, A. T. Woolley, M. L. Lee and A. R. Hawkins, Lab Chip, 2010, 10, 173–178 RSC.
- J. Xuan, M. N. Hamblin, J. M. Stout, H. D. Tolley, R. D. Maynes, A. T. Woolley, A. R. Hawkins and M. L. Lee, J. Chromatogr. A, 2011, 1218, 9102–9110 CrossRef CAS PubMed.
- S. Vankrunkelsven, D. Clicq, K. Pappaert, G. V. Baron and G. Desmet, Anal. Chem., 2004, 76, 3005–3011 CrossRef CAS PubMed.
- S. Vankrunkelsven, D. Clicq, K. Pappaert, W. Ranson, C. De Tandt, H. Ottevaere, H. Thienpont, G. V. Baron and G. Desmet, Electrophoresis, 2004, 25, 1714–1722 CrossRef CAS PubMed.
- S. M. Stavis, E. A. Strychalski and M. Gaitan, Nanotechnology, 2009, 20, 165302(7) CrossRef PubMed.
- S. M. Stavis, J. Geist and M. Gaitan, Lab Chip, 2010, 10, 2618–2621 RSC.
- P. Pandey and R. S. Chauhan, Prog. Polym. Sci., 2001, 26, 853–893 CrossRef CAS.
- Z. Long, D. Liu, N. Ye, J. Qin and B. Lin, Electrophoresis, 2006, 27, 4927–4934 CrossRef CAS PubMed.
- P. Stroeve and N. IIeri, Trends Biotechnol., 2011, 29, 259–266 CrossRef CAS PubMed.
- P. Apel, Radiat. Meas., 2001, 34, 559–566 CrossRef CAS.
- K. B. Jirage, J. Hulteen and C. R. Martin, Science, 1997, 278, 655–658 CrossRef CAS.
- T. Kuo, D. M. Cannon, Y. Chen, J. J. Tulock, M. A. Shannon, J. V. Sweedler and P. W. Bohn, Anal. Chem., 2003, 75, 1861–1867 CrossRef CAS.
- T. Kuo, D. M. Cannon, M. A. Shannon, P. W. Bohn and J. V. Sweedler, Sens. Actuators, A, 2003, 102, 223–233 CrossRef CAS.
- E. N. Savariar, K. Krishnamoorthy and S. Thayumanavan, Nat. Nanotechnol., 2008, 3, 112–117 CrossRef CAS PubMed.
- I. Vlassiouk, P. Apel, S. N. Dmitriev, K. Healy and Z. S. Siwy, Proc. Natl. Acad. Sci. U. S. A., 2009, 106, 21039–21044 CrossRef CAS PubMed.
- T. A. Desai, D. Hansford and M. Ferrari, J. Membr. Sci., 1999, 159, 221–223 CrossRef CAS.
- H. D. Tong, H. V. Jansen, V. J. Gadgil, C. G. Bostan, E. Berenschot, C. J. M. van Rijin and M. Elwenspoek, Nano Lett., 2004, 4, 283–287 CrossRef CAS.
- C. C. Striemer, T. R. Gaborski, J. L. McGrath and P. M. Fauchet, Nature, 2007, 445, 749–753 CrossRef CAS PubMed.
- T. R. Gaborski, J. L. Synder, C. C. Striemer, D. Z. Fang, M. Hoffman, P. M. Fauchet and J. L. McGrath, ACS Nano, 2010, 4, 6973–6981 CrossRef CAS PubMed.
- J. L. Snyder, A. Clark, D. Z. Fang, T. R. Gaborski, C. C. Striemer, P. M. Fauchet and J. L. McGrath, J. Membr. Sci., 2011, 369, 119–129 CrossRef CAS PubMed.
- H. U. Osmangeyoglu, T. B. Hur and H. K. Kim, J. Membr. Sci., 2009, 343, 1–6 CrossRef PubMed.
- T. Sano, N. Iguchi, K. Iida, T. Sakamoto, M. Baba and H. Kawaura, Appl. Phys. Lett., 2003, 83, 4438–4440 CrossRef CAS.
- S. El-Safty, A. Shahat and H. Nguyen, Colloids Surf., A, 2011, 377, 44–53 CrossRef CAS PubMed.
- Y. Li and T. Ito, Anal. Chem., 2009, 81, 851–855 CrossRef CAS PubMed.
- B. Srijanto, S. Retterer, J. D. Fowlkes and M. J. Doktycz, J. Vac. Sci. Technol., B: Microelectron. Nanometer Struct.–Process., Meas., Phenom., 2010, 28, 48–52 CrossRef.
- M. J. Kim, M. Wanunu, D. C. Bell and A. Meller, Adv. Mater., 2006, 18, 3149–3155 CrossRef CAS.
- F. Montagne, N. Blondiaux, A. Bojko and R. Pugin, Nanoscale, 2010, 4, 5880–5886 RSC.
- C. L. Randall, A. Gillespie, S. Singh, T. G. Leong and D. H. Gracias, Anal. Bioanal. Chem., 2009, 393, 1217–1224 CrossRef CAS PubMed.
- R. A. Caruso and M. Antonietti, Adv. Funct. Mater., 2002, 12, 307–312 CrossRef CAS.
- Y. Wang and F. Li, Adv. Mater., 2011, 23, 2134–2148 CrossRef CAS PubMed.
- J. Rzayev and M. A. Hillmyer, J. Am. Chem. Soc., 2005, 127, 13373–13379 CrossRef CAS PubMed.
| This journal is © The Royal Society of Chemistry 2014 |