 Open Access Article
Creative Commons Attribution 3.0 Unported Licence
Large scale infrared imaging of tissue micro arrays (TMAs) using a tunable Quantum Cascade Laser (QCL) based microscope
Paul
Bassan
a,
Miles J.
Weida
b,
Jeremy
Rowlette
b and
Peter
Gardner
*a
aManchester Institute of Biotechnology, The University of Manchester, 131 Princess Street, Manchester M1 7DN, UK. E-mail: peter.gardner@manchester.ac.uk
bDaylight Solutions, 15378 Avenue of Science, Suite 200, San Diego, CA 92128-3407, USA
First published on 22nd May 2014
Abstract
Chemical imaging in the field of vibrational spectroscopy is developing into a promising tool to complement digital histopathology. Applications include screening of biopsy tissue via automated recognition of tissue/cell type and disease state based on the chemical information from the spectrum. For integration into clinical practice, data acquisition needs to be speeded up to implement a rack based system where specimens are rapidly imaged to compete with current visible scanners where 100's of slides can be scanned overnight. Current Fourier transform infrared (FTIR) imaging with focal plane array (FPA) detectors are currently the state-of-the-art instrumentation for infrared absorption chemical imaging, however recent development in broadly tunable lasers in the mid-IR range is considered the most promising potential candidate for next generation microscopes. In this paper we test a prototype quantum cascade laser (QCL) based spectral imaging microscope with a focus on discrete frequency chemical imaging. We demonstrate how a protein chemical image of the amide I band (1655 cm−1) of a 2 × 2.4 cm2 breast tissue microarray (TMA) containing over 200 cores can be measured in 9 min. This result indicates that applications requiring chemical images from a few key wavelengths would be ideally served by laser-based microscopes.
Introduction
During the last decade interest in the field of digital pathology, particularly that related to cancer diagnosis, has increased enormously. This interest has been fuelled by a combination of drivers including (i) need to reduce the pathologist work load (ii) increase diagnostic accuracy (iii) decrease the time between biopsy and result and (iv) reduce the need for repeat biopsies. These are particularly relevant for two of the most common types of cancers namely prostate and breast cancer where the number of biopsies being taken is increasing alarmingly simply due an aging population in which these diseases are endemic. Infrared digital spectral pathology is seen as one of the most promising methods to be developed that could significantly augment current pathology practice. The wide availability of large liquid nitrogen-cooled focal plane array (FPA) detectors in infrared microscopes coupled to rapid scan Fourier transform infrared (FTIR) spectrometers has lead to a dramatic increase in the number of papers published demonstrating the concept of infrared spectral diagnosis. In the case of prostate cancer it has been shown that cancerous tissue can be identified,1 the cancer tissue can be graded2 and even the stage of the disease (1, 2 vs. 3, 4) can be determined3 from the infrared spectrum. Tissue characterisation using large tissue microarrays (TMAs) has also been demonstrated4,5 so one might expect that adoption of this technology in the clinical arena should be progressing rapidly. The situation, however, is not so straight forward. Despite significant improvements in the speed of both data acquisition and analysis,6,7 obtaining a high (diffraction limited) spatial resolution of ∼5–10 μm, data sets from a single core will still take 2–10 min, on our modified system and about 40 min using an off-the-shelf system even with a large (128 × 128) FPA. Consequently complete tissue analysis of a large TMA will take many hours. The problem, in part is due to the amount of data being collected in an FT system. The much hailed multiplex (Fellgett) advantage means that all wavelengths are measured simultaneously, rather than sequentially as in a classic dispersive system, meaning that each pixel of the FPA collects the entire spectral range when generating the interferogram data cube. A full interferogram dataset for a TMA is typically greater than 100 GB which has already had the mean of co-added scans computed. This shows the enormous quantity of data that is collected by the MCT FPA which is a major limitation as data read out to the operating computer is slow forming a major bottleneck in the data acquisition. This has led researchers to question whether all the data is actually required. For the last decade or so, the mainstay of data analysis has been a host of multivariate methods, (largely necessitated by the need for data reduction) but recently a number of papers have been published that indicate it is possible to gain valuable information with just a few wavenumber specific spectral biomarkers.4,5,8,9 It is questionable therefore whether the full spectral hyper-cube needs to be obtained once the spectral biomarkers have been identified. If the full spectrum is not necessary, then the data collection process can be revolutionised with the use on non-FTIR, discrete wavelength, non-interferometry based, infrared Quantum Cascade Laser (QCL) microscopy.10–12 In this communication we show preliminary data from a QCL microscope system that illustrates the significant potential advantages for the chemical imaging TMAs.Materials and methods
A breast tissue microarray (BR20832, US Biomax Inc. Rockville, MD, USA) was sectioned onto a standard glass slide and stained with hematoxylin and eosin (H&E) to provide contrast between different cell-types and extracellular matrix for brightfield microscopy. The immediately serial section was prepared onto a barium fluoride (BaF2) (Crystran Ltd, Poole, UK) substrate for transmission mode infrared chemical imaging and remained embedded in wax i.e. no chemical de-waxing. Tissue was left embedded in wax as resonant Mie scattering (RMieS), known to be a problem in dewaxed tissue,13–15 is greatly reduced due to the refractive index matching between tissue and surrounding wax.6 The cores were arranged in a 13 × 16 grid layout covering an area of 20 × 24 mm2. Due to one core missing the resulting number of cores was 207 with each specimen coming from a unique patient. The diameter of each core in the TMA was ca. 1 mm.FTIR chemical imaging was performed using a Varian 670-IR coupled with a Varian 620-IR microscope (Agilent Technologies – Santa Clara, CA, USA). The system was equipped with a liquid nitrogen cooled mercury–cadmium–telluride (MCT) detector comprising a 128 × 128 element camera. The field of view (FOV) covered and area of ca. 704 × 704 μm2 resulting in a pixel size of ca. 5.5 × 5.5 μm2. Images were collected using 128 and 16 co-added scans for the background and sample scans respectively at a spectral resolution of 5 cm−1. Interferograms were processed using a triangular apodization function and 1 level of zero filling resulting in a data spacing of ca. 2 cm−1. Measurement parameters were chosen as they were found to be the optimal trade-off between spectral quality in terms of resolution, signal-to-noise and data acquisition time. Spectral processing was off-loaded via high-speed gigabit local either to a second machine for simultaneous computation of absorption spectra reducing dead-time for the imaging system.
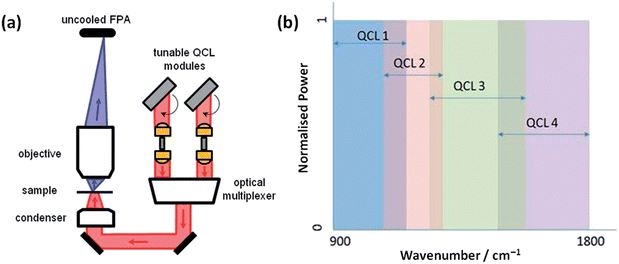
QCL based chemical imaging was performed using a Spero (Daylight Solutions Inc., San Diego, CA, USA) laser-based spectral imaging microscope, a schematic of which is shown in Fig. 1(a). The microscope was equipped with a multiple QCL module illumination source providing continuous coverage over the 900–1800 cm−1 range. The QCL module comprised 4 individual tunable QCLs, each spanning a different wavenumber range, see Fig. 1(b)
A low (4×, 0.15NA) and medium (12.5×, 0.7NA) magnification optical configuration were used covering 2 × 2 mm2 and 0.65 × 0.65 mm2 FOVs with sample-referred pixel sizes of 4.25 × 4.25 μm2 and 1.36 × 1.36 μm2 respectively. The diffraction-limited performance of these two objectives are 24 μm and 5 μm respectively at the peak of amide I band, which has a peak absorption at ca. 1655 cm−1.
Results and discussion
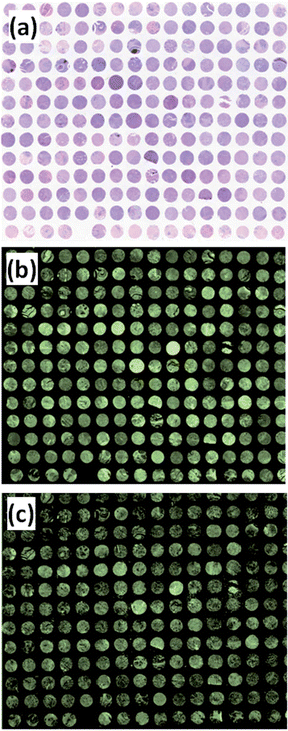
Fig. 2(a) shows the visible images of the H&E stained TMA. Fig. 2(b) shows the FTIR image of the absorption intensity of the amide I band. In total the image consists of approximately 19 million pixels. In order to measure the entire TMA with the FTIR imaging system, two mosaic images of size 20 × 30 tiles and 20 × 28 tiles had to be measured individually taking 7 h 49 m and 7 h 18 m respectively, totalling 17 h 18 m. Measurement had to be carried out in two sequential data collections periods due to the liquid nitrogen depletion in the MCT focal plane array Dewar. The time to re-fill the Dewar, stabilise the detector, move to a suitable background position, collect a new background and then move to the appropriate sample position resulted in an extra ca. 1–2 hours of experimental time involving human interaction, bringing the total time to ca. 19 h. | ||
| Fig. 2 (a) Visible image of the 207 core breast TMA. (b) and (c) are chemical images showing the absorbance of the amide I band at 1655 cm−1 using an FTIR and QCL imaging microscopes respectively. | ||
Using the QCL microscope, the measurement time for the whole image, at a single wavelength, 6.043 μm (corresponding to the amide I band), was 9 min. Fig. 2(c) shows the ca. 26.5 million pixel chemical image of the amide I band. The image, comprising 10 × 12 tiles, can be acquired in one mosaic collection measurement as there is no liquid nitrogen cooling of any components.
The acquisition of an amide I chemical image was ca. 126 times faster using the QCL system compared to the FTIR system and contained a greater number of pixels each of which was ca. 1.3 times smaller. The FTIR system however does produce hundreds of chemical images of a broad wavenumber range from ca. 900–4000 cm−1 simultaneously due to the benefits of interferometry and the FT method. The FTIR data was collected at a spectral resolution of 5 cm−1 meaning that the desired chemical image at 1655 cm−1 will not be at precisely that specific wavenumber. Wavenumber accuracy can of course be improved by either zero filling the interferogram (interpolating the spectrum which is not real resolution) or by collecting data at higher spectral resolution. The latter dramatically increases data collection time as the interferogram now requires sampling more points, but also a greater number of co-added scans is needed to compensate for the increased noise that is an inherent property of measuring high resolution data. The QCL system in contrast can be tuned to a specific wavenumber and has a narrow laser emission which is the limiting factor for the spectral resolution meaning that greater accuracy of wavenumber can be achieved in a much smaller time frame.
The QCL chemical image acquisition was for only 1 wavelength, additional chemical images at other wavelengths would result in a larger collection time. The scaling of time to number of wavelengths would be sub-linear, i.e. it would not take another 9 minutes for another wavelength as the stage (which is a major time overhead) only need move once in between measuring the desired wavelengths. Optimisation of this process is currently being implemented.
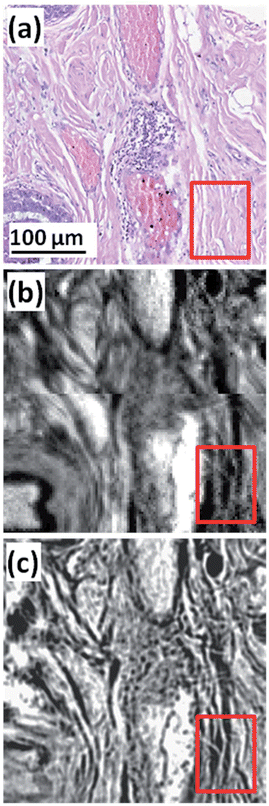
In addition to rapid imaging at a pixel size of 4.25 μm × 4.25 μm2, the high magnification optical configuration with a pixel size of 1.36 × 1.36 μm2 can measure high definition images providing a greater level of detail of finer structures not visible using a conventional desktop FTIR imaging system that has a pixel size of 5.5 μm. Fig. 3(a) shows an expanded image of core B4 (row 2, column 4 from the top left) from Fig. 2(a). Fig. 3(b) shows the FTIR chemical image of the amide I absorption from the serial section and is an expanded view of the Fig. 2(b). Fig. 3(c) shows a chemical image of a single FOV using the high magnification QCL system where finer structures in the tissue are visible such as the fibrous nature of the stromal tissue highlighted. The data acquisition time for this single frame was less than 15 seconds (including disk write time for file saving).
 | ||
| Fig. 3 (a) Expanded view from Fig. 2(a) of core B4 (row 2, column 4 from top left). (b) FTIR chemical image of amide I, pixel size = 5.5 × 5.5 μm2. (c) QCL chemical image of amide I, pixel size = 1.36 × 1.36 μm2. | ||
Spatial oversampling using high magnification optics beyond the diffraction limited has also been achieved using MCT FPA detectors. In order to measure images in a short time frame, however, expensive synchrotron sources are required which are not convenient for the clinical application.16 Standard desktop “globar” sources have also been used, however, collection times for images are excessively long due to loss of light due to the diffraction effect especially at larger wavelengths.17,18
Conclusion
This communication has shown that single wavelength chemical imaging of larger areas using a QCL system can be obtained in minutes at a pixel size finer than that generally employed by the FTIR systems. The data collection time for the single wavelength QCL measurements is 9 min compare to ca. 1140 min for the FTIR system, which has to record the entire spectrum. Clearly tissue analysis cannot be achieved using just a single wavelength but assuming a linear scaling factor (and it is anticipated that a sub-linear scaling factor will be applicable in the near future), if 10 wavelengths are sufficient to provide a full tissue classification then the QCL system will give an order of magnitude improvement in speed. It has also been demonstrated that high spatial resolution chemical images can be collected in seconds using high magnification optics which is possible due to the high flux of the laser source. These preliminary results suggest that, once spectral biomarkers at key wavelengths are identified, QCL systems are likely to be the choice of instrument for spectral pathology. An additional benefit of this QCL system is the use of a room temperature detector that does not require cumbersome liquid nitrogen cooling. Eliminating the need of cryogenics and their associated risks and costs, is a major factor in potential wide spread adoption in the clinical setting.Acknowledgements
P.G. and P.B. acknowledge EPSRC (Grant Number EP/K02311X/1) for funding.References
- E. Gazi, J. Dwyer, P. Gardner, A. Ghanbari-Siahkali, A. P. Wade, J. Miyan, N. P. Lockyer, J. C. Vickerman, N. W. Clarke, J. H. Shanks, L. J. Scott, C. A. Hart and M. Brown, J. Pathol, 2003, 201, 99–108 CrossRef CAS PubMed.
- E. Gazi, M. Baker, J. Dwyer, N. P. Lockyer, P. Gardner, J. H. Shanks, R. S. Reeve, C. Hart, N.W. Clarke and M. Brown, A Correlation of FTIR Spectra Derived from Prostate Cancer Biopsies with Gleason Grade and Tumour Stage, Eur. Urol., 2006, 50, 750–761 CrossRef PubMed.
- M. J. Baker, E. Gazi, M. D. Brown, J. H. Shanks, P. Gardner and N. W. Clarke, Br. J. Cancer, 2008, 99, 1859–1866 CrossRef CAS PubMed.
- D. C. Fernandez, R. Bhargava, S. M. Hewitt and I. W. Levin, Nat. Biotechnol., 2005, 23, 469–474 CrossRef CAS PubMed.
- P. Bassan, J. Mellor, J. Shapiro, K. J. Williams, M. P. Lisanti and P. Gardner, Anal. Chem., 2014, 86, 1648–1653 CrossRef CAS PubMed.
- P. Bassan, A. Sachdeva, J. H. Shanks, M. D. Brown, N. W. Clarke and P. Gardner, Proc. SPIE, 2014, 9041, 90410D CrossRef PubMed.
- P. Bassan, A. Sachdeva, J. H. Shanks, M. D. Brown, N. W. Clarke and P. Gardner, Analyst, 2013, 138, 7066–7069 RSC.
- R. Bhargava, D. C. Fernandez, S. M. Hewitt and I. W. Levin, Biochim. Biophys. Acta, Biomembr., 2006, 1758, 830–845 CrossRef CAS PubMed.
- E. Gazi, J. Dwyer, N. Lockyer, P. Gardner, J. C. Vickerman, J. Miyan, C. A. Hart, M. Brown, J. H. Shanks and N. Clarke, Faraday Discuss., 2004, 126, 41–59 RSC.
- M. J. Weida and B. Yee, Proc. SPIE, 2011, 7902, 79021C CrossRef PubMed.
- K. Yeh, M. Schulmerich and R. Bhargava, Proc. SPIE, 2013, 8726, 87260E CrossRef PubMed.
- M. R. Kole, R. K. Reddy, M. V. Schulmerich, M. K. Gelber and R. Bhargava, Anal. Chem., 2012, 84, 10366–10372 CrossRef CAS PubMed.
- P. Bassan, H. J. Byrne, F. Bonnier, J. Lee, P. Dumas and P. Gardner, Analyst, 2009, 134, 1586–1593 RSC.
- P. Bassan, A. Kohler, H. Martens, J. Lee, H. J. Byrne, P. Dumas, E. Gazi, M. Brown, N. Clarke and P. Gardner, Analyst, 2010, 135, 268–277 RSC.
- P. Bassan, A. Sachdeva, A. Kohler, C. Hughes, A. Henderson, J. Boyle, J. H. Shanks, M. Brown, N. W. Clarke and P. Gardner, Analyst, 2012, 137, 1370–1377 RSC.
- M. J. Nasse, M. J. Walsh, E. C. Mattson, R. Reininger, A. Kajdacsy-Balla, V. Macias, R. Bhargava and C. J. Hirschmugl, Nat. Methods, 2011, 8, 413–U458 CrossRef CAS PubMed.
- M. J. Walsh, D. Mayerich, A. Kajdacsy-Balla and R. Bhargava, Biomedical Vibrational Spectroscopy V: Advances in Research and Industry, 2012, vol. 8219 Search PubMed.
- R. Bhargava, Appl. Spectrosc., 2012, 66, 1091–1120 CrossRef CAS PubMed.
| This journal is © The Royal Society of Chemistry 2014 |

