Ratiometric sensing of fluoride and acetate anions based on a BODIPY-azaindole platform and its application to living cell imaging†
Ajit Kumar
Mahapatra
*a,
Rajkishor
Maji
a,
Kalipada
Maiti
a,
Susanta Sekhar
Adhikari
b,
Chitrangada Das
Mukhopadhyay
a and
Debasish
Mandal
c
aDepartment of Chemistry, Bengal Engineering and Science University, Shibpur, Howrah 711103, India. E-mail: mahapatra574@gmail.com; Fax: +91 33 26684564; Tel: +91 33 2668 4561
bDepartment of Chemistry, University College of Science, University of Calcutta, Kolkata 700009, India
cDepartment of Spectroscopy, Indian Association for The Cultivation of Science, Jadavpur, Kolkata 700032, India
First published on 23rd October 2013
Abstract
A new BODIPY-azaindole based fluorescent sensor 1 was designed and synthesized as a new colorimetric and ratiometric fluorescent chemosensor for fluoride. The binding and sensing abilities of sensor 1 towards various anions were studied by absorption, emission and 1H NMR titration spectroscopies. The spectral responses of 1 to fluoride in acetonitrile–water were studied: an approximately 69 nm red shift in absorption and ratiometric fluorescent response was observed. The striking light yellow to deep brown color change in ambient light and green to blue emission color change are thought to be due to the deprotonation of the indole moiety of the azaindole fluorophore. From the changes in the absorption, fluorescence, and 1H NMR titration spectra, proton-transfer mechanisms were deduced. Density function theory and time-dependent density function theory calculations were conducted to rationalize the optical response of the sensor. Results were supported by confocal fluorescence imaging and MTT assay of live cells.
Introduction
The design and development of artificial molecular systems for the sensing of biologically important anions has been the focus of a recent flurry of work.1 Among the anions, the fluoride ion (F−) is of particular interest owing to its established role in dental care and clinical treatment for osteoporosis.2 An acute intake of a large dose or chronic ingestion of lower doses of F− can result in gastric and kidney disorders, dental and skeletal fluorosis, and urolithiasis in humans, and even death.3 For these reasons, an improved method for the detection and sensing of F− with high selectivity is of current interest in the chemosensor research field. A variety of fluorogenic chemosensors showing absorbance or fluorescence changes upon binding with F− have been reported.4 However, most of them show a turn-off response in emission spectra and modest selectivity. To increase the selectivity and sensitivity, ratiometric measurements are utilized, which involve the observation of changes in the ratio of the intensities of the absorption or the emission at two wavelengths.5 Ratiometric fluorescent probes have an important feature: they permit signal ratio and thus increase the dynamic range and provide built-in correction for environmental effects. The perceived color change is useful not only for the ratiometric method of detection but also for rapid visual sensing. Up to now, many investigations have been conducted to create ratiometric fluorescent probes for cations.6 In contrast, only a few ratiometric fluorescent sensors for F− and acetate (AcO−) have been reported in the literature.7 Thus, realization of ratiometric measurements for F− and AcO− are still a challenge.Boron dipyrromethene (BODIPY)8 dyes have been chosen as fluorophore signaling units because of their widely accepted superiority e.g., high fluorescence quantum yields, high molar absorptivity, high photostability, visible wavelength absorption and modular nature enabling facile functionalization, etc., compared with other fluorophore signaling units. These favourable features have made it possible for BODIPY dyes to be widely used as fluorophore cores for the construction of fluorescent sensors/labels,9 light harvesting systems,10 photodynamic therapy agents11 and molecular logic gate systems.12
An azaindole unit placed at the meso-position of the BODIPY core plays a crucial role in photoinduced-electron-transfer (PET)-based modulation of emission. Typically, for efficient ICT (internal charge transfer), the donor and acceptor are located in the 7- and 3-positions, respectively.13 On the other hand, it is known that BODIPY dyes undergo a PET process with a functional group at the meso-position.14 Previous work by others15 has demonstrated that a phenoxy substituent at the meso (8) position of the BODIPY core is a very strong PET donor. The spectral signature of PET is quenching of fluorescence without any significant changes in the emission wavelength.16 Again, PET is an effective signalling mechanism employed in the design of ratiometric fluorescent sensors.17 Thus, we envisioned that ratiometric fluorescent sensors for fluoride anions and acetate could be constructed by exploiting the PET properties of both azaindole and BODIPY dyes.
Current studies are aimed at designing and synthesizing ratiometric molecular probes with colorimetric and fluorimetric assays to selectively detect the presence of a target anion over a wide range of other interfering anions. However, to the best of our knowledge, there are no reports on ratiometric fluorescent sensors based on a BODIPY-azaindole platform using the PET mechanism. Here, we have developed a new BODIPY-azaindole based probe 1, which enables naked eye and dual channel (absorption and fluorescence) detection of F− and AcO− ions, respectively.
Results and discussion
Scheme 1 outlines the synthesis of the BODIPY-azaindole based probe 1. Probe 1 was prepared through the condensation reaction of azaindole aldehyde with 2,4-dimethylpyrrole according to a published procedure.18 The structures of the sensors were characterized on the basis of 1H and 13C NMR and HRMS (Fig. S1–S3, ESI†). | ||
| Scheme 1 Synthesis of probe 1. | ||
The interaction of probe 1 with anions was investigated through spectrophotometric titrations by adding a standard solution of the tetrabutylammonium salt of anions to a 7![[thin space (1/6-em)]](https://www.rsc.org/images/entities/char_2009.gif) :3 CH3CN:H2O solution (0.02 M HEPES buffer, pH 7.2) of the probe. The free probe 1 displayed an intense absorption band at 501 nm and a weak absorption at 350 nm. The main band at 501 nm is the typical absorption band of BODIPY dyes. Upon addition of 0.5 molar equiv. of fluoride ions, little change was observed at 501 nm. However, the addition of a further amount of fluoride ions, induced new absorption bands at 419 and 254 nm. The peak at 350 nm, the π–π* transition of the chromophore, disappeared gradually, and there was simultaneous growth of a new strong absorption band centred at 419 nm, which is the charge transfer (CT) band. The absorption band at 350 nm decreased and a new red shift band at 419 nm appeared and developed due to the hydrogen binding interaction between indolic NH of probe 1 and fluoride anions. The light yellow color of the probe solution turned reddish-brown at the same time. Four well-defined isosbestic points at 266, 290, 369 and 460 nm were observed (Fig. 1a), indicating the formation of a new species upon treatment of probe 1 with F−. The stoichiometry of the 1-fluoride interaction was confirmed to be 1:1 from the Job’s plot (Fig. S4, ESI†). Analogous investigations were carried out on a variety of anions such as Cl−, Br−, I−, NO3−, SO42−, AcO−, HSO4−, and H2PO4−. Specifically, the receptor 1 in aqueous organic solvent changed color in the presence of F− and AcO− anions (Fig. S5, ESI†). The most pronounced effect was the F−-induced color change from yellow to deep reddish-brown. Other anions such as Cl−, Br−, I−, NO3−, SO42−, HSO4−, and H2PO4− did not induce any spectral response (Fig. 1b). It is worth noting that the absorption band was not altered by less basic anions such as Cl−, Br−, I−, NO3−, SO42−, HSO4−, and H2PO4−. These results provide strong evidence that the red shifted peak at 419 nm is probably due to the deprotonation of the indole N–H of probe 1.19 The binding constant for F− was determined to be 3.43 × 10⁴ M−1 (Fig. S6, ESI†). The detection limit of fluoride was about 1.21 μM (S6, ESI†).
:3 CH3CN:H2O solution (0.02 M HEPES buffer, pH 7.2) of the probe. The free probe 1 displayed an intense absorption band at 501 nm and a weak absorption at 350 nm. The main band at 501 nm is the typical absorption band of BODIPY dyes. Upon addition of 0.5 molar equiv. of fluoride ions, little change was observed at 501 nm. However, the addition of a further amount of fluoride ions, induced new absorption bands at 419 and 254 nm. The peak at 350 nm, the π–π* transition of the chromophore, disappeared gradually, and there was simultaneous growth of a new strong absorption band centred at 419 nm, which is the charge transfer (CT) band. The absorption band at 350 nm decreased and a new red shift band at 419 nm appeared and developed due to the hydrogen binding interaction between indolic NH of probe 1 and fluoride anions. The light yellow color of the probe solution turned reddish-brown at the same time. Four well-defined isosbestic points at 266, 290, 369 and 460 nm were observed (Fig. 1a), indicating the formation of a new species upon treatment of probe 1 with F−. The stoichiometry of the 1-fluoride interaction was confirmed to be 1:1 from the Job’s plot (Fig. S4, ESI†). Analogous investigations were carried out on a variety of anions such as Cl−, Br−, I−, NO3−, SO42−, AcO−, HSO4−, and H2PO4−. Specifically, the receptor 1 in aqueous organic solvent changed color in the presence of F− and AcO− anions (Fig. S5, ESI†). The most pronounced effect was the F−-induced color change from yellow to deep reddish-brown. Other anions such as Cl−, Br−, I−, NO3−, SO42−, HSO4−, and H2PO4− did not induce any spectral response (Fig. 1b). It is worth noting that the absorption band was not altered by less basic anions such as Cl−, Br−, I−, NO3−, SO42−, HSO4−, and H2PO4−. These results provide strong evidence that the red shifted peak at 419 nm is probably due to the deprotonation of the indole N–H of probe 1.19 The binding constant for F− was determined to be 3.43 × 10⁴ M−1 (Fig. S6, ESI†). The detection limit of fluoride was about 1.21 μM (S6, ESI†).
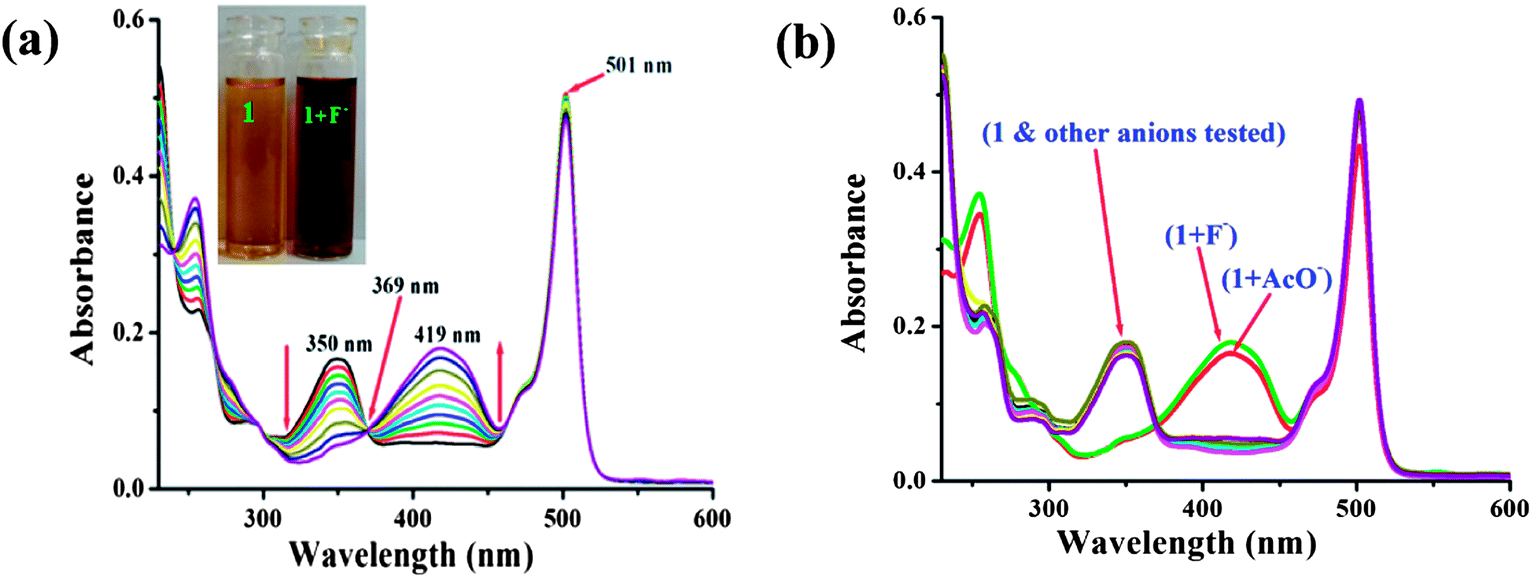 | ||
| Fig. 1 Changes in the UV/vis absorption spectra of sensor 1 (4.5 μM) in 7:3 CH3CN:H2O solution (0.02 M HEPES buffer, pH 7.2) (a) in the presence of F− anions only (0–20 equiv.) and (b) in the presence of various anions (0–300 equiv. except F− and AcO−:0–20 equiv.). | ||
Upon addition of more water or methanol to the solution of probe 1 in the presence of F− and AcO− anions, respectively, the absorption of the two systems were recovered. This may be attributed to the formation of hydrogen bonds between the anions and protic solvent, which compete with the binding to probe 1. The fluoride- and acetate-induced deprotonation process is fully reversible, the addition of polar protic solvents (H2O and CH3OH) results in a reverse color change from reddish-brown to yellow. This is presumably because protic solvents compete with the NH moiety for F− or AcO−, moreover, the presence of a relatively high amount of protic solvent does not favor the formation of deprotonated receptor 1.
The anion-binding properties of probe 1 were then studied in 7:3 CH3CN:H2O solution (0.02 M HEPES buffer, pH 7.2) by emission spectroscopy. The results obtained were in good agreement with those of UV/vis absorption spectroscopy, the sensor exhibited a ratiometric fluorescent response to F− anions. Upon excitation at 350 nm, the free sensor displayed an intense emission band at 512 nm due to an efficient PET process from the lone pair of electrons on the azaindole moiety, which has inherent electron donating property, to the excited BODIPY fluorophore.20 When the concentration of F− increased, the new emission band at 425 nm was gradually enhanced (Fig. 2a), this is attributed to local emission (LE) due to the presence of the azaindole moiety, while the intensity of emission at 512 nm decreased correspondingly.
 | ||
| Fig. 2 (a) Fluorescence spectra (excitation at 350 nm) of sensor 1 (4.5 μM) in 7:3 CH3CN:H2O solution (0.02 M HEPES buffer, pH 7.2) in the presence of (a) 0–200 equiv. of F− and (b) the fluorescence intensity ratio (I425/I512) as a function of equiv. of fluoride anions. | ||
A clear iso-emission point was observed at 492 nm. With the addition of 200 equiv. of F−, the emission band at 512 nm was quenched efficiently, this could be attributed to the enhanced PET process upon binding of F−. Thus, the sensor provided a significant ratiometric fluorescent response (I425/I512) to F− anions as seen in Fig. 2b. However, upon excitation at 419 nm, treatment of the sensor with F− anions afforded no noticeable emission. This is the typical behavior of BODIPY-based CT sensors: the CT emission band is almost nonfluorescent when excited at the CT absorption band.21 Among the anions investigated, only AcO− induced similar spectral changes (Fig. S7, ESI†). The spectral behavior revealed that deprotonation of the NH fragment by F− and not hydrogen bonding to it is responsible for the drastic color change, as a result of altering the optical properties of the chromogenic and fluorogenic azaindole skeleton.
Interestingly, when TBAF (tetra-n-butylammoniumfluoride) was added to the optimized 7:3 CH3CN:H2O solution (0.02 M HEPES buffer, pH 7.2) of 1, an apparent color change from light yellow to deep brown in ambient light, as shown in the inset of Fig. 1a, could be observed by the naked eye. Upon progressive addition of TBAF, the intensity at 350 nm gradually decreased, and a large bathochromic shift (69 nm) of the maximum could be observed at 419 nm (Fig. 1a). This was not observed with other anions except acetate ion. It has been noted that the deprotonation of receptor 1 is also induced by the basic anion AcO−, and appearance of the band at 419 nm and development of the light brown color were observed after large excess addition (Fig. 3). The results support our expectation that 1 could serve as a sensitive naked-eye probe for F−. The fluoride sensing process was also clearly seen not only by color change but also by bright fluorescence under a UV lamp. During the fluorometric titration of 1 with F− ions the green color solution of the receptor became deep blue. Comparative fluorescence changes upon addition of various anions to compound 1 are shown in Fig. 3. The dramatic combination of anion-specific response/nonresponse makes receptor 1 an especially effective colorimetric anion sensor under the solution-phase conditions. The above results indicate that receptor 1 exhibits excellent selective sensing for F− (F− > AcO− ≫ other anions) in aqueous organic solvent.
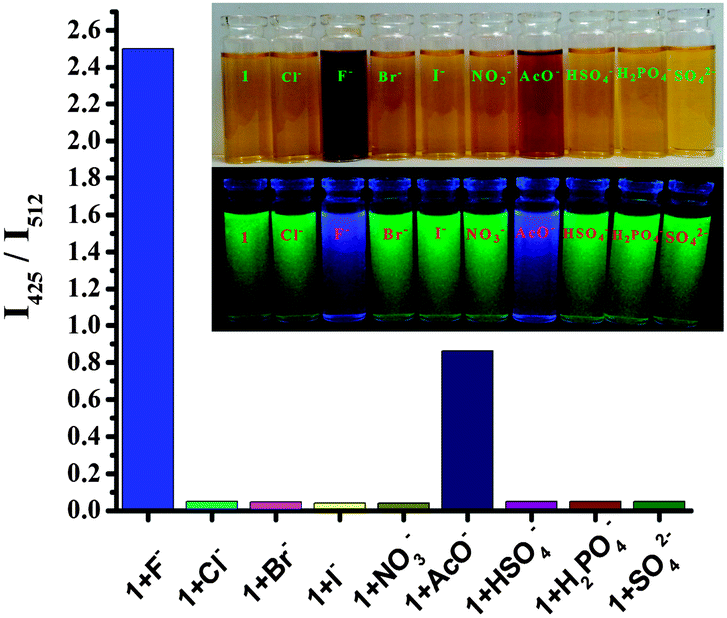 | ||
| Fig. 3 Relative fluorescence changes of 1 (4.5 μM) after treatment with various relevant analytes (200 equiv. for F− and AcO−, 300 equiv. for other anions) in 7:3 CH3CN:H2O solution (0.02 M HEPES buffer, pH 7.2). The inset shows a photograph of visible color (top) under ambient light and visual fluorescence color (bottom) under a hand-held UV lamp (366 nm). | ||
When the deprotonation reaction of 1 was carried out in a mixture of anions containing Cl−, Br−, I−, NO3−, SO42−, HSO4−, and H2PO4−, no fluorescence appeared, but a strong fluorescence emission appeared only when fluoride anion was added to this mixture (Fig. 3). These observations suggest that compound 1 is highly selective toward F− even in the presence of a complex mixture of anions. The experimental results suggest that compound 1 shows high selectivity in colorimetric and fluorescent sensors for the fluoride anion.
1H NMR titration experiments in CDCl3 were conducted to look into the nature of the new peak formed in UV-vis fluoride titration spectra. To confirm this fact, 1H NMR interactions of receptor 1 with F− and AcO− (Fig. S8, ESI†) were carried out in CDCl3. It was found that the indolic NH proton signal (δ = 13.03 ppm) in the drastic downfield shift (Δδ = 0.70 ppm) of the spectrum broadened and then finally disappeared with an increase in the concentration of F−.
In Fig. 4, the majority of signals on the aryl rings shift upfield distinctly after the addition of 1 equiv. of fluoride ions owing to the through-bond effects, and complete disappearance of the signals for the NH protons (13.03 ppm) was also observed at the same time. These observations clearly support the theory that the proton transfer interaction between compound 1 and F− involves the indolic NH proton. Fluoride has a high affinity towards hydrogen and could easily induce N–H bond cleavage. Interestingly, after the addition of 2.0 equiv. of fluoride ions, a new 1:2:1 triplet signal at 15.8 ppm appeared, which is ascribed to the FHF−dimer.22 The existence of this new species indicates the deprotonation of the NH group. The deprotonation of the receptor was confirmed by the Bronsted acid–base reaction between 1 and [Bu4N]+OH−. This deprotonation process was also confirmed by the identical UV-vis spectral changes observed in the titration experiment with tetrabutylammonium hydroxide (TBAOH) to that observed for fluoride ions (Fig. S9, ESI†). A stepwise increase in the concentration of TBAOH produced results analogous to those found in the case of F− ion and other ions less basic than OH− (pKa = 30 in CH3CN). To elucidate the mechanism of interaction, the pH titration was carried out in the presence of fluoride ion in aqueous acetonitrile solution. Similar results were obtained at a high pH range (Fig. S10, ESI†). With the deprotonation of 1, the charge delocalizes on the entire conjugated π-system, which shifts the aryl rings further upfield. From the 1H NMR titration results, it was found that 1 and fluoride form a hydrogen-bond complex upon addition of 1 equiv. of fluoride ions, while almost no changes were observed for the UV-vis spectra; with an increase of fluoride concentration, a new deprotonated species appeared, and the CT band of UV-vis spectra formed quickly. These results suggest that the sensor–fluoride interaction is indeed a two-step process at low fluoride concentration as shown in Scheme 2, the sensor–fluoride interaction is authentic hydrogen binding, and with an increase of the fluoride ions, excess fluoride interacts with the sensor–fluoride complex and induces deprotonation of the sensor.
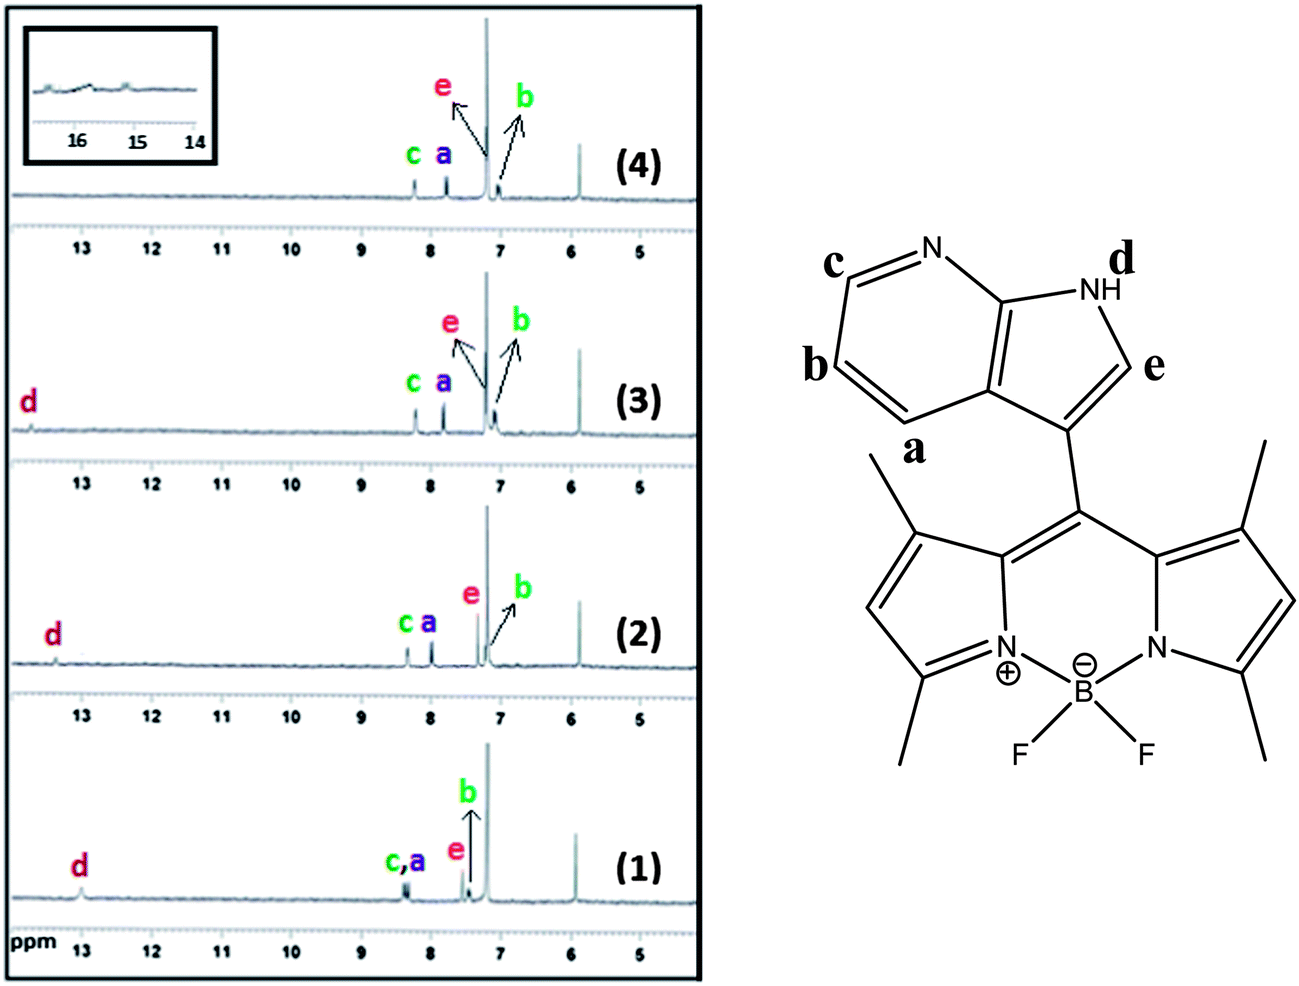 | ||
| Fig. 4 Change in partial 1H NMR spectra of 1 upon addition of F− in CDCl3 solvent: (1) 0, (2) 0.5, (3) 1.0, and (4) 2.0 equiv. F−. | ||
 | ||
| Scheme 2 Proposed binding mode of sensor 1 with F− anions. | ||
To gain insight into the optical response of sensor 1 to F− anions, sensor 1 and the corresponding deprotonated species were examined by density function theory (DFT) and time-dependent density function theory (TDDFT) calculations at the B3LYP/6-31 G(d) level of the Guassian 03 program23 (Fig. S11, ESI†). The geometry optimizations for 1 and deprotonated species were done in a cascade fashion starting from semiempirical PM2 followed by ab initio HF to DFT B3LYP by using various basis sets, viz., PM2 → HF/STO-3G → HF/3-21G → HF/6-31G → B3LYP/6-31G(d,p). As shown in Fig. 5, for sensor 1, both the HOMO and LUMO are distributed at the BODIPY part. In addition,the planar BODIPY ring fragment is almost perpendicular to the adjacent azaindole part with a dihedral angle of 89.5°. Thus, the ICT character of the sensor is only modest due to the presence of azaindole part into the meso position. While for the deprotonated species, the HOMO is distributed in both the ring system of azaindole and BODIPY, and the LUMO is mostly located between the BODIPY unit and the meso position of the carbon. This indicates that the deprotonated product bears ICT character among the fluorophore moieties, which is consistent with the design strategy. Furthermore, the energy gap between the HOMO and LUMO of the deprotonated product is smaller than that of sensor 1, which is in good agreement with the red shift in the absorption observed upon treatment of sensor 1 with F− anions.
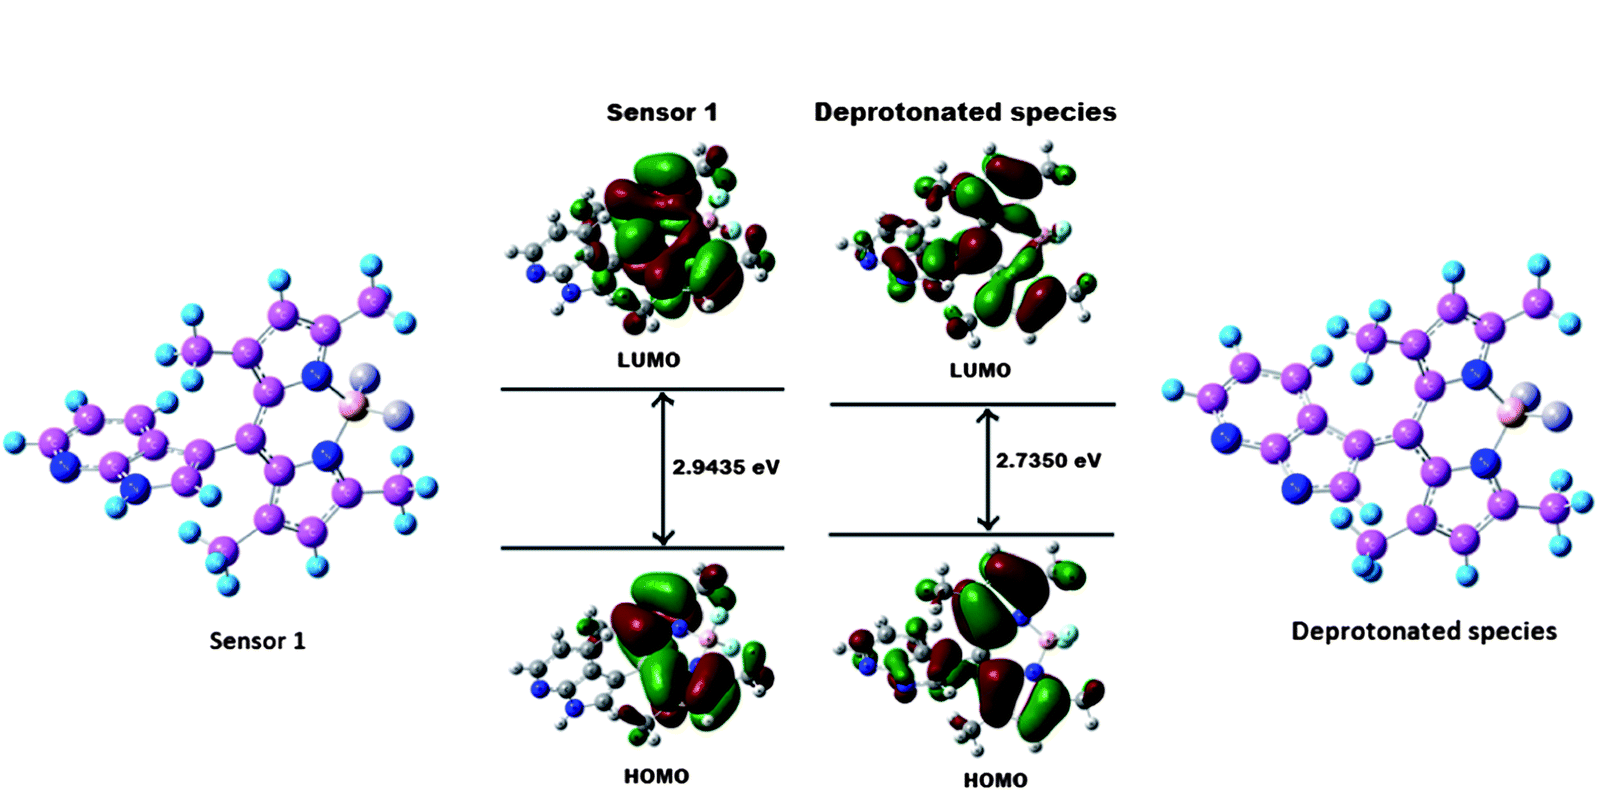 | ||
| Fig. 5 Calculated (DFT B3LYP/6-31 G(d) level) geometry and HOMO−LUMO energy levels and the interfacial plots of the orbitals for sensor 1 and the deprotonated species. | ||
To explain the formation of the LE band at 425 nm with excitation at 350 nm upon addition of sensor 1 to F− anions, sensor 1 and the deprotonated product were optimized by DFT calculations. The formation of the LE emission band at 425 nm in the deprotonated product is likely due to the nonplanar and nonconjugated character of the meso position. In addition, we also performed time-dependent density function theory (TD-DFT) calculations for both the deprotonated product and the sensor 1. In the case of the deprotonated product, TD-DFT calculations provide a calculated absorption band at 406 nm belonging to the S0 → S3 energy state (Table S1) (S12, ESI†). The main contributing transition (∼67.40%) for S0 → S3 energy state arises from HOMO-1 → LUMO. This is consistent with the absorbance band at 419 nm obtained experimentally. The LE band mostly originates from azaindole moiety (Fig. S13, ESI†), further confirming that the LE band originates from the azaindole moiety in the deprotonated product. By contrast, as shown in Fig. S14 ESI,† no allowed singlet state transitions are located on the azaindole moiety in sensor 1. Thus, the LE emission from the azaindole moiety is not present in the sensor.
The probe has thermodynamically favourable binding properties to F− and forms a 1 F− complex which gives emission spectra in the visible range. To further demonstrate the practical biological application of the probe, fluorescence imaging experiments were carried out in living cells, particularly for the sensitive detection of intracellular F−. The well-established MTT assay, which is based on mitochondrial dehydrogenase activity of viable cells, was adopted to study cytotoxicity of the above mentioned compounds at varying concentrations. Fig. 6 shows that the probe compound did not exert any adverse effect on cell viability, the same is the case when cells were treated with varying concentrations of F−. However, exposure of HCT cells to 1 F− complex resulted in a decline in cell viability above a concentration of 25 μM. The effect was more pronounced at higher concentrations and showed an adverse cytotoxic effect in a dose-dependent manner which is in agreement with previous literature reports suggesting cytotoxic and anti-proliferative effects of 1 F− complex on cancer cells.24 The viability of HCT cells was not influenced by the solvent (DMSO) as evidenced in Fig. 6, leading to the conclusion that the observed cytotoxic effect could be attributed to the 1 F− complex.
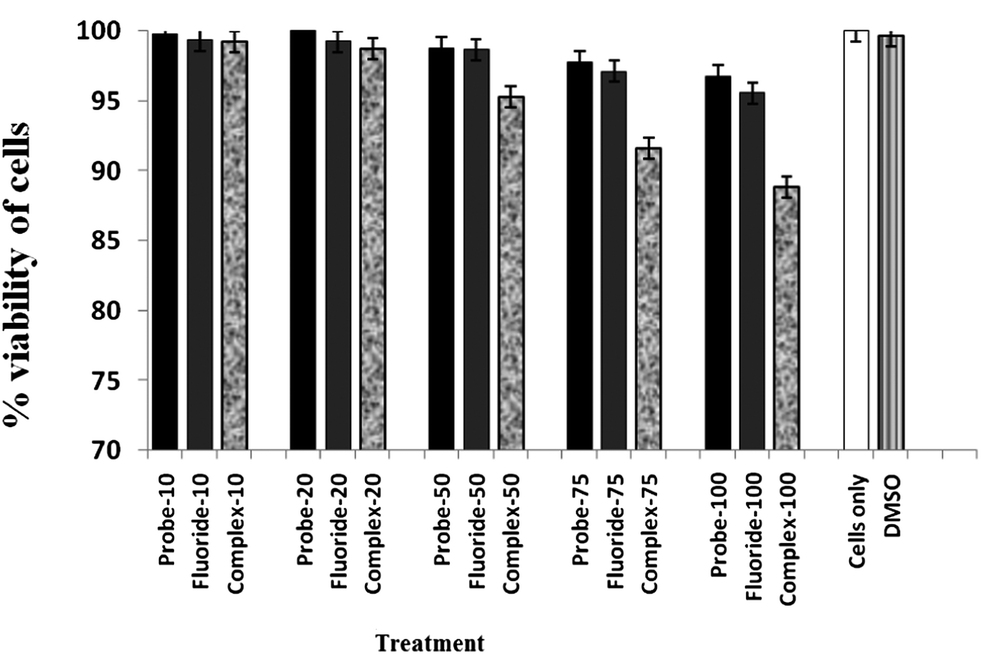 | ||
| Fig. 6 MTT assay to determine the cytotoxic effect of probe 1 and 1 F− complex on HCT cells. | ||
The results obtained in the in vitro cytotoxic assay suggested that, in order to pursue fluorescence imaging studies of 1 F− complex in live cells, it would be prudent to choose a working concentration of 20 μM for the probe compound. Hence, to assess the effectiveness of compound 1 as a probe for intracellular detection of F− by confocal microscopy, RAW cells were treated with 20 μM F− for 1 h followed by 10 μM probe solution to promote formation of 1 F− complex. Fluorescence microscopic studies revealed a lack of fluorescence for RAW cells when treated with either probe compound or F− alone (Fig. 7). Upon incubation with F− followed by probe compound a striking switch- ON fluorescence was observed inside RAW cells, which indicated the formation of 1 F− complex, as observed earlier in solution studies. Further, an intense green fluorescence was conspicuous in the cytoplasmic region of RAW cells which indicates that the probe could readily cross the membrane barrier, permeate into RAW cells, and rapidly sense intracellular F−. It is significant to mention here that bright field images of treated cells did not reveal any gross morphological changes, which suggested that RAW cells were viable. These findings open up the avenue for future in vivo biomedical applications of the sensor.
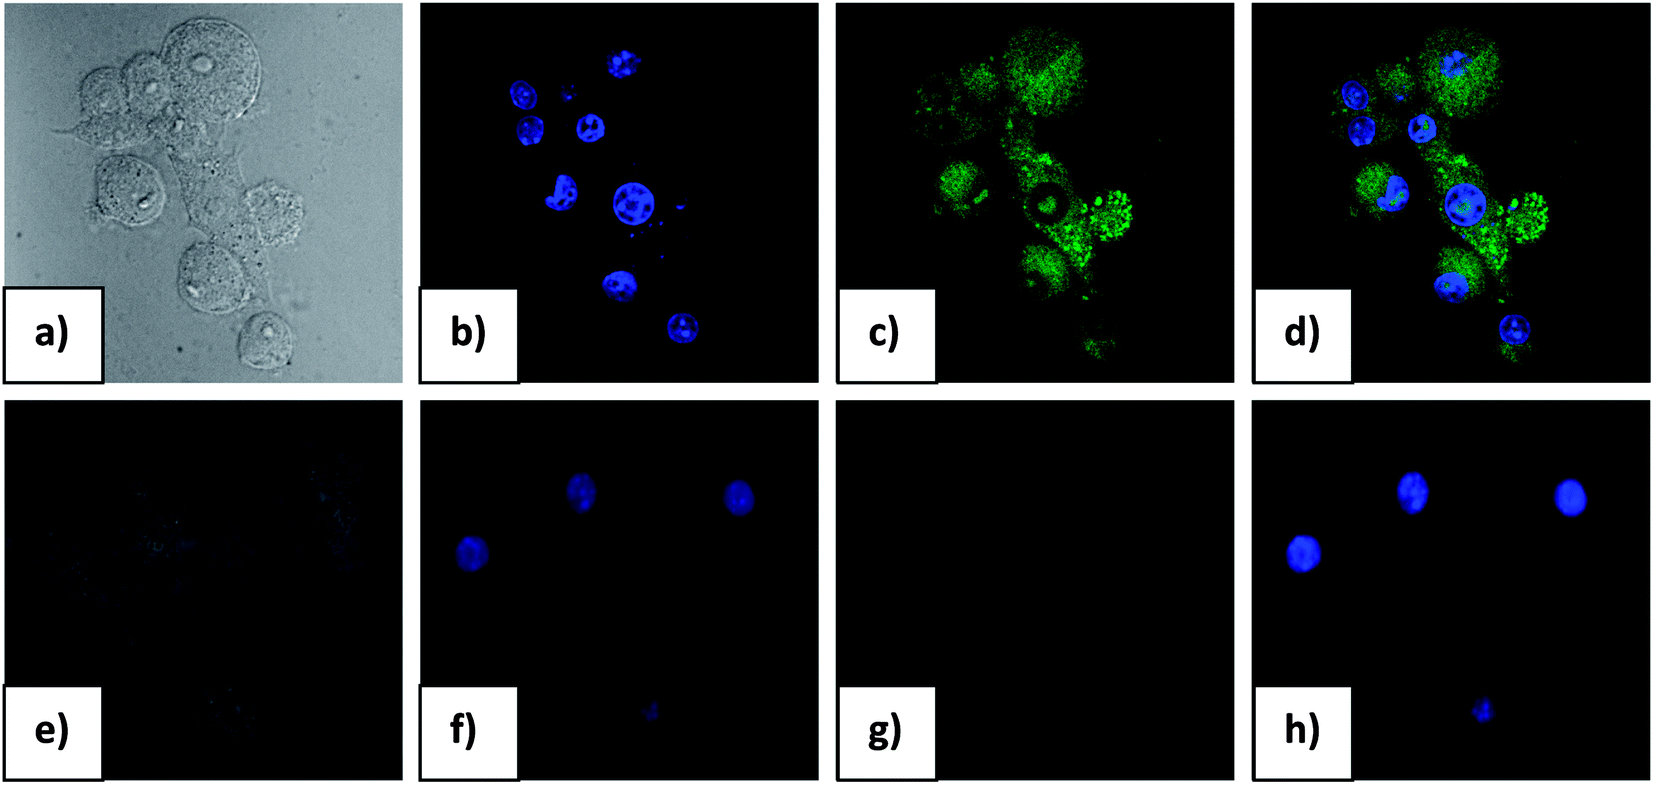 | ||
| Fig. 7 Confocal microscopic images of RAW 264.7 control cells (a–d) and F− treated (e–g) cells pretreated with Probe 1. All the images were acquired with a 40× objective lens. F− treated cells do not emit fluorescence as control. (a) Bright field image of the cells (b) nuclei counter stained with DAPI fluorescent stain (1 μg mL−1) (c) only probe 1 at c = 1.0 × 10⁻⁵ M concentration (excitation wave length 405 nm and emission range 540–550 nm) (d) overlay image of (b) and (c) in dark field (e) bright field image of RAW cells treated with probe 1 and F− (f) cells treated with Probe 1 (c = 1.0 × 10⁻⁵ M) and F− (c = 2.0 × 10⁻⁵ M) (g) nuclei counterstained with DAPI fluorescent stain (1 μg mL−1) excited at 405 nm (h) Overlapping image of (f) and (g). | ||
Conclusion
In conclusion, we have developed a new simple system (1) BODIPY-azaindole based ratiometric fluorescent sensor for fluoride anions in organo-aqueous media. The system provides chromogenic and fluorogenic dual signals by displaying (i) a deep brown color and (ii) a strong blue fluorescence from an initially light yellow and green fluorescent solution, upon exposure to fluoride. The response time was only a few seconds in acetonitrile, and we were able to easily follow the response by either absorption or emission changes. The drastic color change and strong fluorescence change of 1 are simply driven by hydrogen bonding interaction between the indolic NH proton and F−. DFT and TD-DFT calculations were conducted to rationalize the optical response of the sensor. The sensitivity of compound 1 to F− was demonstrated in living cells, and cell toxicity assay reveals that probe 1 can be used for selective imaging of F− in living cells. Moreover, the simple probe design presented here may contribute to the development of more efficient and more useful dual-mode anion probes.Experimental
General information and materials
All the solvents were of analytical grade. All anionic compound such as tetrabutylammonium salts of F−, Cl−, Br−, I−, NO3−, SO42−, AcO−, HSO4−, and H2PO4− were purchased from Sigma–Aldrich Chemical Co., stored in desiccators under vacuum containing self-indicating silica, and used without any further purification. Solvents were dried according to standard procedures. Unless stated otherwise, commercial grade chemicals were used without further purification. Elix Millipore water was used throughout all the experiments. All the reactions were magnetically stirred and monitored by thin-layer chromatography (TLC) using Spectrochem GF254 silica gel coated plates. Column chromatography was performed with silica gel. The 1H NMR spectra were recorded on a Bruker–300 MHz spectrometer. Mass spectra were carried out using a Water's QTOF Micro YA 263 mass spectrometer. The 1H NMR chemical shift values are expressed in ppm (δ) relative to CHCl3 (δ = 7.19 ppm). UV-visible and fluorescence spectra measurements were performed on a JASCO V530 and a Photon Technology International (PTI-LPS-220B) spectrofluorimeter respectively. The following abbreviations are used to describe spin multiplicities in 1H NMR spectra: s = singlet; d = doublet; t = triplet; m = multiplet. Elemental analyses were performed with a Perkin-Elmer 2400 elemental analyzer.General method of UV-vis and fluorescence titration
:3 CH3CN:H2O solution (0.02 M HEPES buffer, pH 7.2). The solution of the guest anions using their TBAX salts in the order of 1 × 10⁻⁴ mL−1 was also prepared in 7:3 CH3CN:H2O solution (0.02 M HEPES buffer, pH 7.2). The test solution of sensor 1 was prepared by the proper dilution method. The spectra of these solutions were recorded by means of UV-vis and fluorescence methods. The substrate binding interaction was calculated according to the Benesi–Hildebrand equation.
Here A0 is the absorbance of receptor in the absence of guest, A is the absorbance recorded in the presence of added guest, ε0 and ε are the corresponding molar absorption co-efficient and KB represents the substrate binding interaction with guest.
Synthesis
1H NMR (CDCl3, 300 MHz) δ(ppm): 13.029 (s, 1H, NH), 8.395 (d, 1H, J = 5.7 Hz), 8.336 (d, 1H, J = 8.4 Hz), 7.547 (s, 1H), 7.454 (t, 1H, J = 7.5 Hz), 5.945 (s, 2H), 2.507 (s, 6H), 1.257 (s, 6H).
13C NMR (CDCl3, 75 MHz) δ(ppm): 154.46, 150.99, 148.51, 143.71, 142.59, 129.32, 126.90, 125.55, 121.29, 118.63, 116.75, 113.88, 14.36, 13.89.
TOF MS ES+, m/z = 365.1748 [M+1]+, calc. for C20H19BF2N4 = 364.1996. Anal. calcd for C20H19BF2N4: C, 65.96; H, 5.26; N, 15.38 Found: C, 65.84; H, 5.29; N, 15.32%.
Acknowledgements
We thank the DST-West Bengal [Project no. 124(Sanc.)/ST/P/S&T/9G-17/2012] for financial support. RM thanks the DST, New Delhi for a fellowship. We are also thankful to the Annesur Rahaman Centre for High Performance Computing, IACS, Kolkata for providing us with computational time.Notes and references
- (a) J. L. Sessler, P. A. Gale, and W.-S. Cho, Anion Receptor Chemistry, RSC Publishing Cambridge, U.K., 2006 Search PubMed; (b) R. Martinez-Manez, Chem. Rev., 2003, 103, 4419 CrossRef CAS PubMed; (c) P. D. Beer and P. A. Gale, Angew. Chem., Int. Ed., 2001, 40, 486 CrossRef CAS.
- K. L. Kirk, Biochemistry of the Elemental Halogens and Inorganic Halides, Plenum Press, New York, 1991 Search PubMed.
- (a) B. L. Riggs, Bone and Mineal Research, Annual 2, Elsevier, Amsterdam, 1984 Search PubMed; (b) M. Kleerekoper, Endocrinol. Metab. Clin. North Am., 1998, 27, 441 CrossRef CAS.
- (a) Z. Xu, S. K. Kim and J. Yoon, Chem. Soc. Rev., 2010, 39, 1457 RSC; (b) A. F. Li, J. H. Wang, F. Wang and Y. B. Jiang, Chem. Soc. Rev., 2010, 39, 3729 RSC; (c) R. M. Duke, E. B. Veale, F. M. Pfeffer, P. E. Krugerc and T. Gunnlaugsson, Chem. Soc. Rev., 2010, 39, 3936 RSC; (d) M. Vázquez, L. Fabbrizzi, A. Taglietti, R. M. Pedrido, A. M. González-Noya and M. R. Bermejo, Angew. Chem., Int. Ed., 2004, 43, 1962 CrossRef PubMed; (e) K. J. Chang, D. Moon, M. S. Lah and K. S. Jeong, Angew. Chem., Int. Ed., 2005, 44, 7926 CrossRef CAS PubMed; (f) K. Bowman-James, Acc. Chem. Res., 2005, 38, 671 CrossRef CAS PubMed; (g) V. Amendola, D. Esteban-Gómez, L. Fabbrizzi and M. Licchelli, Acc. Chem. Res., 2006, 39, 343 CrossRef CAS PubMed; (h) M. Cametti and K. Rissanen, Chem. Commun., 2009, 2809 RSC.
- (a) Y. Zhou, F. Wang, Y. Kim, S.-J. Kim and J. Yoon, Org. Lett., 2009, 11, 4442 CrossRef CAS PubMed; (b) X. Zhang, Y. Xiao and X. Qian, Angew. Chem., Int. Ed., 2008, 47, 8025 CrossRef CAS PubMed.
- (a) J. F. Zhang, Y. Zhou, J. Yoon, Y. Kim, S. J. Kim and J. S. Kim, Org. Lett., 2010, 12, 3852 CrossRef CAS PubMed; (b) J. F. Zhang and J. S. Kim, Anal. Sci., 2009, 25, 1271 CrossRef CAS; (c) J. S. Kim and D. T. Quang, Chem. Rev., 2007, 107, 3780 CrossRef CAS PubMed; (d) H. N. Kim, M. H. Lee, H. J. Kim, J. S. Kim and J. Yoon, Chem. Soc. Rev., 2008, 37, 1465 RSC; (e) Z. Xu, J. Yoon and D. R. Spring, Chem. Soc. Rev., 2010, 39, 1996 RSC; (f) M. H. Lee, S. W. Lee, S. H. Kim, C. Kang and J. S. Kim, Org. Lett., 2009, 11, 2101 CrossRef CAS PubMed; (g) M. H. Lee, H. J. Kim, S. Yoon, N. Park and J. S. Kim, Org. Lett., 2008, 10, 213 CrossRef CAS PubMed; (h) H. J. Kim, S. J. Lee, S. Y. Park, J. H. Jung and J. S. Kim, Adv. Mater., 2008, 20, 3229 CrossRef CAS.
- (a) S. Kumar, V. Luxami and A. Kumar, Org. Lett., 2008, 10, 5549 CrossRef CAS PubMed; (b) Y. Qu, J. Hua and H. Tian, Org. Lett., 2010, 12, 3320 CrossRef CAS PubMed; (c) R. Hu, J. Feng, D. Hu, S. Wang, S. Li, Y. Li and G. Yang, Angew. Chem., Int. Ed., 2010, 49, 4915 CrossRef CAS PubMed; (d) Z. Xu, S. K. Kim, S. J. Han, C. Lee, G. Kociok-Kohn, T. D. James and J. Yoon, Eur. J. Org. Chem., 2009, 3058 CrossRef CAS.
- (a) R. Ziessel, G. Ulrich and A. Harriman, New J. Chem., 2007, 31, 496 RSC; (b) A. Loudet and K. Burgess, Chem. Rev., 2007, 107, 4891 CrossRef CAS PubMed; (c) G. Ulrich, R. Ziessel and A. Harriman, Angew. Chem., Int. Ed., 2008, 47, 1184 CrossRef CAS PubMed.
- (a) S. Niu, C. Massif, G. Ulrich, P. Renard, A. Romieu and R. Ziessel, Chem.–Eur. J., 2012, 18, 7229 CrossRef CAS PubMed; (b) K. Rurack, M. Kollmansberger, U. Resch-Genger and J. Daub, J. Am. Chem. Soc., 2000, 122, 968 CrossRef CAS; (c) O. A. Bozdemir, R. Guliyev, O. Buyukcakir, S. Selcuk, S. Kolemen, G. Gulseren, T. Nalbantoglu, H. Boyaci and E. U. Akkaya, J. Am. Chem. Soc., 2010, 132, 8029 CrossRef CAS PubMed; (d) S. Atilgan, T. Ozdemir and E. U. Akkaya, Org. Lett., 2010, 12, 4792 CrossRef CAS PubMed.
- (a) J. Iehl, J.-F. Nierengarten, A. Harriman, T. Bura and R. Ziessel, J. Am. Chem. Soc., 2012, 134, 988 CrossRef CAS PubMed; (b) O. A. Bozdemir, Y. Cakmak, F. Sozmen, T. Ozdemir, A. Siemiarczuk and E. U. Akkaya, Chem.–Eur. J., 2010, 16, 6346 CrossRef CAS PubMed; (c) O. A. Bozdemir, S. Erbas-Cakmak, O. O. Ekiz, A. Dana and E. U. Akkaya, Angew. Chem., Int. Ed., 2011, 50, 10907 CrossRef PubMed.
- (a) S. Erbas, A. Gorgulu, M. Kocakusakogullari and E. U. Akkaya, Chem. Commun., 2009, 4956 RSC; (b) Y. Cakmak, S. Kolemen, S. Duman, Y. Dede, Y. Dolen, B. Kilic, Z. Kostereli, L. T. Yildirim, A. L. Dogan, D. Guc and E. U. Akkaya, Angew. Chem., Int. Ed., 2011, 50, 11937 CrossRef CAS PubMed.
- (a) R. Guliyev, S. Ozturk, Z. Kostereli and E. U. Akkaya, Angew. Chem., Int. Ed., 2011, 50, 9826 CrossRef CAS; (b) A. Coskun, E. Deniz and E. U. Akkaya, Org. Lett., 2005, 7, 5187 CrossRef CAS PubMed.
- (a) G. Signore, R. Nifosi, L. Albertazzi, B. Storti and R. Bizzarri, J. Am. Chem. Soc., 2010, 132, 1276–1288 CrossRef CAS PubMed; (b) J. Wang, X. Qian and J. Cui, J. Org. Chem., 2006, 71, 4308–4311 CrossRef CAS PubMed.
- (a) A. P. de Silva, H. Q. N. Gunaratne, T. Gunnlaugsson, A. J. M. Huxley, C. P. Rademacher and T. E. Rice, Chem. Rev., 1997, 97, 1515–1566 CrossRef CAS PubMed; (b) A. W. Czarnik, Acc. Chem. Res., 1994, 27, 302–308 CrossRef CAS; (c) L. Fabbrizzi and A. Poggi, Chem. Soc. Rev., 1995, 24, 197–202 RSC.
- (a) M. Baruah, W. Qin, N. Basaric, W. M. De Borggraeve and N. Boens, J. Org. Chem., 2005, 70, 4152–4157 CrossRef CAS PubMed; (b) M. Yujiang, P. A. Bentley and W. Wanga, Tetrahedron Lett., 2006, 47, 2447–2449 CrossRef PubMed; (c) D. P. Kennnedy, C. M. Kormos and S. C. Burdette, J. Am. Chem. Soc., 2009, 131, 8578–8586 CrossRef PubMed; (d) G. Ulrich, R. Ziessel and A. Harriman, Angew. Chem., Int. Ed., 2008, 47, 1184–1201 CrossRef CAS PubMed; (e) A. Loudet and K. Burgess, Chem. Rev., 2007, 107, 4891–4932 CrossRef CAS PubMed.
- (a) A. P. de Silva, H. Q. N. Gunaratne, T. Gunnlaugsson, A. J. M. Huxley, C. P. Rademacher and T. E. Rice, Chem. Rev., 1997, 97, 1515–1566 CrossRef CAS PubMed; (b) A. W. Czarnik, Acc. Chem. Res., 1994, 27, 302–308 CrossRef CAS; (c) L. Fabbrizzi and A. Poggi, Chem. Soc. Rev., 1995, 24, 197–202 RSC.
- J. R. Lakowicz, Topics in Fluorescence Spectroscopy, Probe Design and Chemical Sensing, Kluwer Academic Publishers, New York, 2002, vol. 4 Search PubMed.
- R. Ziessel, L. Bonardi, P. Retailleau and G. Ulrich, J. Org. Chem., 2006, 71, 3093–3102 CrossRef CAS PubMed.
- (a) P. Zhao, J. Jiang, B. Leng and H. Tian, Macromol. Rapid Commun., 2009, 30, 1715 CrossRef CAS PubMed; (b) Y. Qu, Y. H. Hua, Y. H. Jiang and H. J. Tian, J. Polym. Sci., Part B: Polym. Phys., 2009, 47, 1554 CrossRef; (c) J. Jiang, X. Xiao, P. Zhao and H. J. Tian, J. Polym. Sci., Part A: Polym. Chem., 2010, 48, 1551 CrossRef CAS.
- (a) Y. Gabe, Y. Urano, K. Kikuchi, H. Kojima and T. Nagano, J. Am. Chem. Soc., 2004, 126, 3357–3367 CrossRef CAS PubMed; (b) A. Loudet and K. Burgess, Chem. Rev., 2007, 107, 4891–4932 CrossRef CAS PubMed.
- O. A. Bozdemir, F. Sozmen, O. Buyukcakir, R. Guliyev, Y. Cakmak and E. U. Akkaya, Org. Lett., 2010, 12, 1400–1403 CrossRef CAS PubMed.
- (a) M. Boiocchi, L. Del Boca, D. E. Gómez, L. Fabbrizzi, M. Licchelli and E. Monzani, J. Am. Chem. Soc., 2004, 126, 16507–16514 CrossRef CAS PubMed; (b) A. B. Descalzo, K. Rurack, H. Weisshoff, R. Martinez-Manez, M. D. Marcos, P. Amoros, K. Hoffmann and J. Soto, J. Am. Chem. Soc., 2005, 127, 184–200 CrossRef CAS PubMed.
- (a) C. Lee, W. Yang and R. G. Parr, Phys. Rev. B, 1988, 37, 785 CrossRef CAS; (b) B. Miehlich, A. Savin, H. Stoll and H. Preuss, Chem. Phys. Lett., 1989, 157, 200 CrossRef CAS.
- A. Kamkaew, S. Hui Lim, H. Boon Lee, L. Voon Kiew, L. Yong Chung and K. Burgess, Chem. Soc. Rev., 2013, 42, 77–88 RSC.
Footnote |
| † Electronic supplementary information (ESI) available. See DOI: 10.1039/c3an01663c |
| This journal is © The Royal Society of Chemistry 2014 |