Immobilized phage proteins for specific detection of staphylococci
Hicham
Chibli
a,
Hala
Ghali
b,
Soonhyang
Park
a,
Yves-Alain
Peter
b and
Jay L.
Nadeau
*a
aDepartment of Biomedical Engineering, McGill University, 3775 university Street, Montreal, Quebec H3A 2B4, Canada. E-mail: jay.nadeau@mcgill.ca; hicham.chibli@mail.mcgill.ca
bDepartment of Engineering Physics, Polytechnique Montreal, Montreal, Quebec H3C 3A, Canada. E-mail: yves-alain.peter@polymtl.ca
First published on 11th November 2013
Abstract
Rapid, specific detection of pathogenic bacteria remains a major challenge in infectious disease diagnostics. Bacteriophages can show genus- or even species-level specificity and have been developed for biosensing purposes, but the possibility of using individual phage proteins for detection has not been fully explored. This work exploits the ability of specific phage proteins, the endolysins LysK and Φ11, and the bacteriocin lysostaphin, fixed on silicon wafers to bind staphylococci. The proteins show activity against eight tested clinical isolates of S. aureus and to S. epidermidis, but no binding to Escherichia coli and limited binding to Micrococcus. Binding was quantified by clearing assays in solution and by functionalization of silicon wafers followed by light microscopy. Bacterial binding densities on functionalized surfaces were ∼3 cells/100 μm2. The small size of the proteins makes the system robust and easy to handle, and the principle is generalizable to many different biosensor platforms, including label-free systems such as optical microresonators.
Introduction
Staphylococci (staph) are Gram positive microorganisms that cause serious skin and wound infections in humans and animals. Most staph infections are caused by S. aureus, which has shown emerging antibiotic resistance that is rapidly becoming a global crisis.1 Over 60% of staph infections in hospitals are now due to methicillin-resistant S. aureus (MRSA), which is resistant to β-lactams.2,3 It is estimated that at least 3.4 million hospital patients in the U.S. are infected by MRSA each year.4 Community-acquired MRSA is showing a very rapid rise and now accounts for 14% of MRSA infections;5 these infections are seen mostly in young people (average age, 23 years)6 and spread rapidly in close quarters such as dormitories and military barracks. Other species of staphylococci, such as the coagulase-negative S. epidermidis, are less likely to cause disease in healthy subjects but can infect implanted devices and catheters.7 New approaches to rapid diagnosis and treatment of these infections are needed. The most rapid FDA-approved test for MRSA uses real-time PCR.8 Although the test is quite rapid (about 2 hours), it is not practical for field use or developing countries.Bacteriophages have long been considered as potential anti-microbial agents and have been used as recognition elements for a wide variety of biosensors (for a review, see ref. 9). Physisorption of whole phages onto surfaces has yielded surface plasmon resonance (SPR) based detection sensitivities of ∼104 CFU mL−1 for S. aureus.10 Additional stability and control of phage orientation may be achieved by chemical functionalization with specific binding to the virions.11,12
However, there are certain disadvantages to using whole bacteriophages in biosensors. Purification from the host bacteria is difficult, and many techniques have been developed to ensure complete removal of host proteins.13–15 Whole phages may also show lytic and/or enzymatic activity that render the signal unstable, as bacteria that bind may release again or be lysed.16 Finally, whole phages are large, which decreases the signal strength in sensor systems that depend upon distance (such as SPR or optical microresonators).
For all of these reasons, there is interest in isolating specific proteins from bacteriophages that might prevent many of the problems associated with the use of whole virions. A significant amount of recent research has demonstrated the advantages of cloned and purified phage receptor binding proteins (RBPs) in biosensors in terms of sensitivity, stability, and size. A recent study using RBPs against S. typhimurium identified an optimal orientation of the protein and attained a detection limit of 103 CFU mL−1 using SPR.17 Another study identified an RBP that bound Campylobacter jejuni.18
In this study we examine several purified phage proteins from the class of enzymes called endolysins. Endolysins are produced at the end of the phage cycle in order to lyse the host bacterial cell from within by hydrolyzing the peptidoglycan cell wall. Because peptidoglycan shows variations at the species level, endolysins can be species-specific or at least genus-specific. Endolysins typically consist of a cell-wall binding domain (CBD) and an N-terminal catalytic domain. The CBDs have been identified for numerous phages and show excellent properties for biosensors: rapid binding, high affinity, and low reactivity with non-target cells. CBDs immobilized on paramagnetic beads have been used to immobilize and purify Listeria species, Clostridium perfringens, and Bacillus subtilis.19
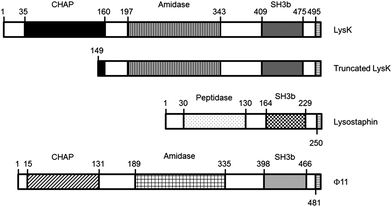
LysK is an endolysin purified from the staphylococcal phage K. It has been well characterized and shown to have three domains: an N-terminal cysteine, a histidine-dependent amidohydrolase/peptidase (CHAP) domain, a midprotein amidase-2 domain, and a C-terminal SH3b cell wall-binding domain. The CHAP domain alone is sufficient to cause cell lysis of staphylococci.20 The SH3b binding domain has not been used alone as a sensor, but it has been shown to confer anti-staphylococcal activity on streptococcal endolysins when expressed as a chimera.21 LysK is not species-specific, but acts most strongly on S. aureus and S. saprophyticus, more weakly against other staphylococci, and not at all against lactococci or E. coli.22
Lystostaphin is an endopeptidase that can lyse staphylococci on its own or work in synergy with LysK;23 LysK enhances the activity of lysostaphin up to 16-fold depending on the concentration.20 Lysostaphin treated fibers and meshes have been shown to eliminate staphylococci from wounds in in vitro24 and animal models,25 to eliminate biofilms in vivo,26 and to be effective alone or in combination with antibiotics in treatment of disseminated MRSA in mice.27 It specifically binds to the cell wall of S. aureus, so it is potentially useful as a detector at the species level.28
The bacteriophage Φ11 produces an endolysin that has similar domains to LysK, but has low sequence similarity. Φ11 shows activity against living, heat-killed, and biofilm forms of different staphylococci, including S. aureus and S. epidermidis.29
The goal of this work was to evaluate the potential of immobilized lysins and truncated domains as elements for specific bacterial recognition. Full-length LysK, lysostaphin, and Φ11 were tested, as well as two deletion constructs: LysK149-495, containing the amidase and the binding domain; and a peptide consisting of the first 9 amino acids of the targeting domain of lysostaphin (WKTNKYGTL) (Fig. 1).
We functionalized silicon wafers with the chosen proteins, similarly to previous studies using other proteins.30–32 Due to the adherent properties of staphylococci, the sensor surface had to be passivated with polyethylene glycol (PEG) to prevent non-specific binding. We found that LysK showed a detection limit of 5000 CFU mL−1 using fluorescence microscopy as a readout, with binding densities of ∼3 cells/100 μm2. The truncated LysK protein did not show any differences in binding strength or specificity compared with the full-length protein. However, results of experiments using lysostaphin and Φ11 were inconsistent. When the wafers were functionalized with the 9-amino-acid peptide derived from the targeting domain of lysostaphin, all bacterial binding was inhibited. Truncated or full-length LysK thus represents a useful tool for development of bacterial sensors with high sensitivity and rapid read-out.
Materials and methods
Plasmids and protein purification
Phage proteins expressed in the pET21 plasmid vector were kindly provided by Dr David M. Donovan. The plasmid constructs21,33 and protein purification procedure were previously described.34 In brief, 0.5 μg of plasmid DNA was transformed into E. coli BL21 (DE3) and grown overnight in modified lysogeny broth (LB) (15 g tryptone, 8 g yeast extract, 5 g NaCl per liter, pH 7.8). The next day, colonies were picked and grown in modified LB to OD600 = 0.4–0.5, then protein expression was induced with 1 mM IPTG at 10 °C for 20 h. The bacteria were pelleted by centrifugation and the pellet was resuspended in lysis buffer (50 mM NaH2PO4, 300 mM NaCl, 10 mM imidazole, pH 8.0 and 30% glycerol) and sonicated to lyse the cells. His-tagged proteins were purified through nickel chromatography using Ni-NTA Superflow (Qiagen). Supernatant was incubated with Ni-NTA matrix at 4 °C for 1 h. Then the column was washed once with lysis buffer and twice with wash buffer (50 mM NaH2PO4, 300 mM NaCl, 20 mM imidazole, pH 8.0 + 30% glycerol). Protein was eluted with elution buffer (50 mM NaH2PO4, 300 mM NaCl, 250 mM imidazole, pH 8.0 + 30% glycerol). The purified protein was analyzed on 10% SDS-PAGE and visualized with Coomassie blue staining. Lytic activity of the proteins against bacterial strains was tested with a zymogram assay as follows: the mid-log growth phase cell pellet from 75 mL of bacterial culture was mixed with SDS-PAGE resolving gel. The gel was run as usual (1 h), then rinsed with dH2O and incubated in Tris buffer (10 mM Tris, 150 mM NaCl, pH 7.5) for up to 24 hours until clearing in the turbid gel appeared indicating lytic activity.The lysostaphin binding domain, representing the sequence WKTNKYGTL, was purchased as a purified peptide from Genscript.
Clearing assays
A clearing assay measures the reduction of the optical density (OD) of a bacterial solution due to the lysis of the bacteria. The bacterial strains tested represented type strains and clinical isolates: S. aureus type strain ATCC 29213, 8 different methicillin-resistant S. aureus isolates (referred to here as MRSA 1 to 8), S. epidermidis, E. coli type strain 10798, Micrococcus sp. and Enterococcus sp. The clinical isolates were kindly provided by Dr Vivian Loo (McGill University Health Centre). The bacteria were grown in LB (37 °C, 200 rpm) until OD600 = 0.6. 1 mL of each bacterial strain was pelleted by centrifugation at 7000g for 12 min and the pellets were resuspended in 1 mL buffer solution (10 mM Tris·HCl pH 7.5, 150 mM NaCl, 1% glycerol). In each well of a 96-well plate, 75 μL of the bacterial solution was mixed with 75 μL of the tested protein (final protein concentration of 2 μM). The OD600 was measured over 70 min with reading every 20 s at 32 °C using a SpectraMax Plus plate reader. All assays were performed in triplicate.Functionalization of silicon wafers and glass slides
Silicon wafers with a 500 nm thick thermal silicon dioxide layer (Addison Engineering, Inc.) or microscope slides (Fisher) were functionalized in three stages. First, wafers were cleaned with oxygen plasma35 or slides were cleaned with piranha etch. Samples were then immediately washed with distilled water and submerged for 2 h in an ethanol–water (95![[thin space (1/6-em)]](https://www.rsc.org/images/entities/char_2009.gif) :
:![[thin space (1/6-em)]](https://www.rsc.org/images/entities/char_2009.gif) 5 (v/v)) solution containing 2.5% triethoxysilane-PEG-NH2 (Nanocs, MW = 3400). After incubation, samples were thoroughly washed with ethanol and water and then placed in a vacuum oven for 2 h at 110 °C for annealing.
5 (v/v)) solution containing 2.5% triethoxysilane-PEG-NH2 (Nanocs, MW = 3400). After incubation, samples were thoroughly washed with ethanol and water and then placed in a vacuum oven for 2 h at 110 °C for annealing.
To functionalize the wafers (or slides) with the proteins, the PEGylated samples were immersed in a protein![[thin space (1/6-em)]](https://www.rsc.org/images/entities/char_2009.gif) :
:![[thin space (1/6-em)]](https://www.rsc.org/images/entities/char_2009.gif) EDC solution at a ratio of 1 to 1000 (2 μM: 2000 μM) in buffer (10 mM Tris·HCl pH 7.5, 150 mM NaCl, 1% glycerol), stored for 12 h at 4 °C then thoroughly washed with PBS and water.
EDC solution at a ratio of 1 to 1000 (2 μM: 2000 μM) in buffer (10 mM Tris·HCl pH 7.5, 150 mM NaCl, 1% glycerol), stored for 12 h at 4 °C then thoroughly washed with PBS and water.
Ellipsometry
The thickness of each layer was measured on glass slides using a RC2 ellipsometer with dual rotating compensators (J.A. Woollam Co.). Six different positions on at least two replicates of each sample type were analyzed. The thickness of silicon oxide layer was measured separately on an unmodified glass slide and subtracted from the total layer thickness. Data were taken at four different incident angles (45, 55, 65 and 75°) from 292 to 1690 nm. To determine the thickness and optical constants of the PEG-silane, the resulting data were fit to a three-term experimental Cauchy fit using CompleteEase software (J.A. Woolam Co).XPS analysis
XPS spectra were collected on a VG Scientific ESCALAB 3 MkII XPS spectrometer with an Mg Kα X-ray source. The electron beam power was of 206 W (12 kV, 18 mA). High-resolution spectra were taken with a 20 eV pass energy and a resolution of 0.05 eV. Six different positions on at least two replicates of each sample type were analyzed. The Shirley method was used to subtract background noise.Bacterial detection
To distinguish bacterial strains under fluorescence microscopy, they were labeled with different dyes. S. aureus and E. coli were labeled with 4′,6-diamidino-2-phenylindole dihydrochloride (DAPI) and Micrococcus species with ethidium bromide (EtBr). 1 mL of bacteria in LB (OD600 = 0.5) was centrifuged at 7000g for 12 min and the pellet was resuspended in 1 mL of PBS. DAPI (1 μL, 10 mg mL−1) or EtBr (0.5 μL, 2 mM) was added to the solution and placed on a shaker for 30 min. The bacteria/dye solutions were then washed 3 times with PBS and the pellet was resuspended in PBS. For staining dead bacteria, propidium iodide (1 μL, 1 mg mL−1) was added to 1 mL of S. aureus stained with DAPI at 108 CFU mL−1.To bind bacteria to surfaces, functionalized wafers were immersed in a solution of labeled bacteria at a chosen concentration for 5 min, and then washed thoroughly with Tween (0.05% in PBS), PBS, and H2O before imaging. Images were acquired on an inverted wide-field epifluorescence microscope (Olympus IX71). The configuration included mercury lamp excitation, a 100× objective lens (NA = 1.40, Olympus) or a 20× objective lens (NA = 0.40, Olympus); the excitation filters were a 365 ± 10 nm bandpass for DAPI and a 545/30 bandpass for EtBr. Emission was collected on a hyperspectral camera (Chromodynamics) from 10 nm past the excitation cutoff to 740 nm in 5–10 nm increments, or at emission peak ±10 nm. Images were analyzed using ENVI 3.0 (Exelis) and bacteria were counted using ImageJ.
Bacterial concentration determination
To determine the concentration of bacteria in solutions, 10 μL from bacterial solutions at OD600 = 0.8 were diluted into 90 μL PBS, then 6 serial 10-fold dilutions were made from this stock. 5 μL from each dilution was plated, on LB agar plate in triplicate and incubated for 16 h at 37 °C. Colonies were counted manually.To quantify binding on slides, areas of 57 × 57 μm (3.3 × 103 μm2) were imaged on each wafer at 8 to12 different locations and bacteria attached were counted. Results are presented as cells per unit area ± standard area of the mean of the measured regions.
Results and discussion
Activity of proteins against bacterial strains
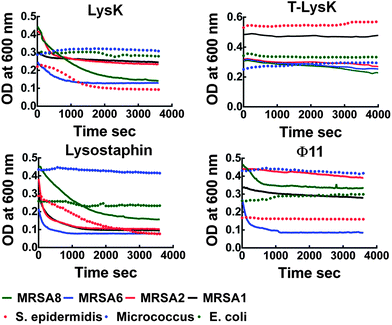
LysK, truncated LysK, lysostaphin and Φ11 were tested against S. aureus, 8 strains of MRSA (1–8) and S. epidermidis (SE) in clearing assays over a total period of 1 h. E. coli, Micrococcus species (MS) and Enterococcus species (ES) were used as negative controls. The ability of the proteins to efficiently inhibit the growth was strain-dependent as expected22,33,36 (Fig. 2). At 2 μM, LysK and lysostaphin inhibited the growth of all of the Staphylococcus strains with different efficiencies; Φ11 inhibited only 5 MRSA strains with low to medium efficiency (Table 1). None of the negative control strains were cleared by the proteins.| MRSA1 | MRSA2 | MRSA3 | MRSA4 | MRSA5 | MRSA6 | MRSA7 | MRSA8 | S. epidermidis | E. coli | |
|---|---|---|---|---|---|---|---|---|---|---|
| a H = high lysing efficiency (>50% in 1 h) b M = medium lysing efficiency (20–50%) c L = low lysing efficiency (<20%) d N = not active | ||||||||||
| LysK | Lc (18%) | Mb (44%) | M | L | M | M (47%) | H | H (68%) | H (60%) | N |
| T-LysK | Nd | L (15%) | M | M | M | M (20%) | M | M (29%) | N | N |
| Lysostaphin | Ha (68%) | H (73%) | H | M | L | M (27%) | M | H (82%) | H (73%) | N |
| Φ11 | L (17%) | L (11%) | N | N | N | H (70%) | M | M (28%) | L (5%) | N |
Surface functionalization and characterization
The cleaned wafers were silanized with an amino-terminal silane containing a small PEG sequence (MW = 3400) to prevent non-specific binding. The proteins were then attached to the amino group using carbodiimide coupling (Scheme 1).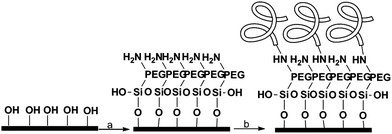 | ||
Scheme 1 Surface functionalization. (a) NH2-PEG-Si(OEt)3, EtOH![[thin space (1/6-em)]](https://www.rsc.org/images/entities/char_2009.gif) : :![[thin space (1/6-em)]](https://www.rsc.org/images/entities/char_2009.gif) H2O 95 H2O 95![[thin space (1/6-em)]](https://www.rsc.org/images/entities/char_2009.gif) : :![[thin space (1/6-em)]](https://www.rsc.org/images/entities/char_2009.gif) 5, 2 h at rt, (b) proteins 2 M, desalted buffer, EDC, 12 h, 4 °C. 5, 2 h at rt, (b) proteins 2 M, desalted buffer, EDC, 12 h, 4 °C. | ||
Ellipsometry was used to find the thickness of each added layer on the glass slides before and after each step. It was not possible to obtain a consistent measurement of the thickness of the Si-PEG on silica wafers due to inhomogeneity of the thermal silicon dioxide surface. On the other hand, the surface of the microscope slides was smooth enough so that ellipsometry was a reliable technique, although some thickness variations were seen across the slide due to roughness of the glass surface (measured roughness 10.5 ± 0.03 Å). Three regions of the slide were sampled, giving thickness values for Si-PEG of 3.02 nm, 2.55 nm and 2.81 nm, values and variations consistent with the literature.37 The addition of LysK to the Si-PEG increased the thickness by 5 ± 0.05 nm (n = 24 samples from 4 independent slides). The average refractive index for the Si-PEG was 1.42.
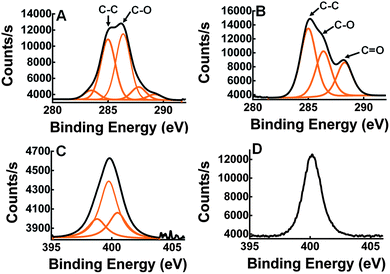
X-ray photoelectron spectroscopy (XPS) was used to measure elemental composition on the surface of the wafers. XPS analysis was performed on silicon dioxide wafers treated with Si-PEG only (Fig. 3A) and with Si-PEG-LysK (Fig. 3B). The C1s, O1s, N1s and Si2p high-resolution regions were measured for both samples, and confirmed the presence of Si-PEG-LysK. Adsorption of the PEGylated aminosilane molecule on the surface of silicon dioxide was shown by the appearance of an oxygen peak, O1s, centered at 532.5 eV. This peak is due to the O–Si link that forms between the silane and the surface of the wafer. A C peak appears at 288.3 eV after the addition of LysK (Fig. 3B), indicating the presence of amide bonds (N–C![[double bond, length as m-dash]](https://www.rsc.org/images/entities/char_e001.gif) O) from the protein. The presence of LysK on the surface was also detected by the increase in the quantity of nitrogen on the wafers-Si-PEG-LysK shown by the peak at 400.2 eV typical of N–C
O) from the protein. The presence of LysK on the surface was also detected by the increase in the quantity of nitrogen on the wafers-Si-PEG-LysK shown by the peak at 400.2 eV typical of N–C![[double bond, length as m-dash]](https://www.rsc.org/images/entities/char_e001.gif) O bonds (Fig. 3D vs. C).
O bonds (Fig. 3D vs. C).
Bacterial binding
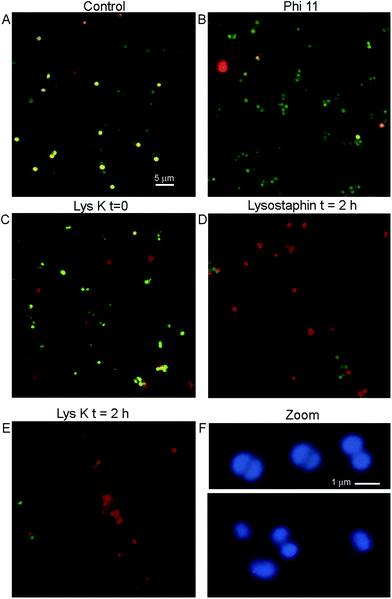
The adherence of bacteria to functionalized silica wafers was quantified using fluorescence microscopy. The use of a simple silane (aminopropyltriethoxysilane (APTES)) without the PEG led to unacceptable levels of nonspecific binding of all bacterial strains to the surface of the silica wafers (not shown). S. aureus adhered to a greater degree than other strains even when phage proteins were not present. This natural “stickiness” of S. aureus was important to control to avoid false positive results. When PEG-silane was used, nonspecifically bound cells could be removed by washing three times with 0.05% Tween. This was the procedure used in all images shown.A key question to be answered was whether binding to immobilized lysins would leave bacterial morphology intact for cell counting or other methods of detection, or whether the cells would be fragmented and destroyed by protein activity on the surface. Control cultures of S. aureus showed uniformly round cells. Live cells stained with calcein and not PI, while dead cells showed dual labelling and thus appeared yellow (Fig. 4A). Cells bound to lysins remained reasonably intact at time 0, although increased heterogeneity in cell size was seen as compared with control, especially with LysK. A significant number of cells (∼10% for lysostaphin and Φ11; ∼20% for LysK) showed evidence of rupture even at time 0, indicated by irregularly-shaped cells or fragments that stained with PI but not calcein (Fig. 4B and C). After 2 h of incubation on the slide, >90% of the lysostaphin-bound cells were dead, although they retained a recognizable morphology (Fig. 4D). In the case of LysK, after 2 h most of the cells had lost their characteristic shape and were found in fragments and aggregates (Fig. 4E). High magnification images of DNA-labeled cells showed alterations in morphology and size at time 0 in the presence of LysK (Fig. 4F) and the other lysins (not shown). Care was therefore needed in bacterial counting in order to distinguish cells from debris, and to account for differences in morphology that were encountered with the immobilized cells.
The effect of protein concentration on adhesion
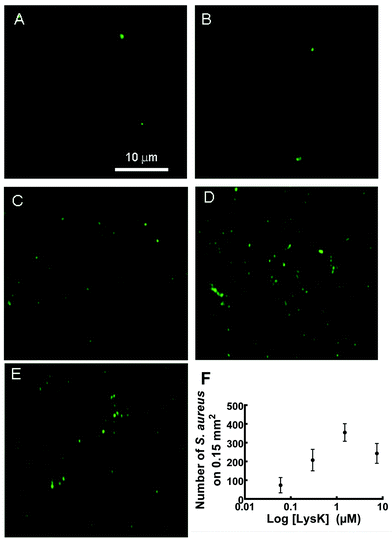
The ability of functionalized slides to capture S. aureus was dependent on the density of immobilized protein on the wafer surface. The number of bacteria bound was roughly linearly proportional to the concentration of LysK solutions used to prepare the wafers, up to a plateau value of ∼7.5 μM (Fig. 5E and F). This is consistent with steric inhibition at high concentrations, as has previously been seen using whole phages.38 Wafers with 2 μM of LysK incubated in a solution of 107 CFU mL−1 bound 60 ± 5 bacteria per 3.3 × 103 μm2 region (n = 8). This binding density compares favourably with immobilized S. typhimurium tailspike proteins, where the reported binding density was 25.87 ± 0.61 bacteria/100 μm2 in the N-cys configuration and 8.57 ± 0.19 bacteria/100 μm2 in the C-cys configuration, for samples incubated in 109 CFU mL−1.17When Φ11 and lysostaphin were immobilized on the wafers, the attachment of the bacteria was not consistent over different trials. Some Φ11- and lysostaphin-functionalized wafers showed similar adhesion to the LysK, whereas others prepared identically showed no bacterial binding. Because of this inconsistency we decided to concentrate our effort on LysK. When wafers were functionalized with CHAP-domain truncated LysK, adhesion of bacteria to the surface did not differ significantly from the full length LysK. When incubated in a solution of S. aureus and E. coli at 108 CFU mL−1 each, full-length LysK bound 30 ± 3 S. aureus cells and 2 ± 1 E. coli per 3.3 × 103 μm2 region (n = 10). Truncated LysK bound 31 ± 3 S. aureus, and 1 ± 1 E. coli per 3.3 × 103 μm2, a difference that was not statistically significant. It has been shown that the first nine amino acids (YKTNKYGTL) from the targeting domain of a peptidoglycan hydrolase ALE-1, a homologue of lysostaphin, are necessary to specifically lyse S. aureus. Truncation of these residues resulted in a drastic decrease in the activity of the peptide,39 demonstrating the importance of this N-terminal nine residues for cell recognition. The cell binding domain of lysostaphin, WKTNKYGTL, completely inhibited all bacterial binding. Even in the absence of PEGylation, neither S. aureus nor E. coli bound to the peptide-functionalized wafers (not shown). This was a surprising result that may prove useful for prevention of nonspecific binding.
Specificity of LysK
The specificity of the functionalized wafers was evaluated by incubating them with negative control strains alone (E. coli, Micrococcus, Enterococcus) or with negative control strains mixed with S. aureus. Very little binding of E. coli and Enterococcus to the wafers was observed in either circumstance. Micrococcus showed some degree of binding to LysK, which was quantified relative to S. aureus by altering the ratios of the two organisms simultaneous binding experiments. At a 1![[thin space (1/6-em)]](https://www.rsc.org/images/entities/char_2009.gif) :
:![[thin space (1/6-em)]](https://www.rsc.org/images/entities/char_2009.gif) 1 ratio of S. aureus to Micrococcus, approximately 80% of bound cells were S. aureus, and this ratio decreased as the ratio of S. aureus to Micrococcus was reduced. The S. aureus cells showed the typical pattern of distortion and shrinkage caused by lysin action, whereas the Micrococcus cells were unaffected, appearing large and round, consistent with lack of lysin action in the clearing assay (Fig. 6). Varying the ratio of Micrococcus
1 ratio of S. aureus to Micrococcus, approximately 80% of bound cells were S. aureus, and this ratio decreased as the ratio of S. aureus to Micrococcus was reduced. The S. aureus cells showed the typical pattern of distortion and shrinkage caused by lysin action, whereas the Micrococcus cells were unaffected, appearing large and round, consistent with lack of lysin action in the clearing assay (Fig. 6). Varying the ratio of Micrococcus![[thin space (1/6-em)]](https://www.rsc.org/images/entities/char_2009.gif) :
:![[thin space (1/6-em)]](https://www.rsc.org/images/entities/char_2009.gif) Staphylococcus allowed for an estimate of relative affinity by examining the fraction f of bound bacteria that were S. aureus vs. those that were Micrococcus (“Micro”):
Staphylococcus allowed for an estimate of relative affinity by examining the fraction f of bound bacteria that were S. aureus vs. those that were Micrococcus (“Micro”):where k1 is the affinity constant for S. aureus and k2 the affinity constant for Micrococcus. The values taken from the images in Fig. 6 give a value of k2/k1 ∼ 0.25.
The genera Staphylococcus and Micrococcus are closely related. They once belonged to the same genus, and until 1960 they were considered in the same family. They were separated into 2 different families based mainly on the difference in CG content and the cell wall compositions.40 These differences can explain the lack of lysin action, but are not great enough to prevent some degree of binding by LysK.
Limit of detection
To determine the limit of detection, wafers functionalized with 2 μM of LysK were immersed in increasing concentrations of S. aureus: 500, 5 × 10³, 5 × 10⁴, 5 × 10⁵ CFU mL−1 and the control was wafer-Si-PEG in a solution of 5 × 10⁵ CFU mL−1. As expected, the number of S. aureus attached to the wafers increased with the number of cells in solution. The limit of detection was defined as the lowest concentration tested for which the mean number of S. aureus attached, to the wafer-Si-PEG-LysK, was higher than the standard deviation of the control. The S. aureus limit of detection on the fully functionalized wafer was 5000 cells per mL. However, we did not explore mechanisms of signal transduction such as SPR in this paper. Future experiments are necessary in order to compare the possible SPR limits of detection to limits seen with whole phages or other CBDs.10,38 To further enhance the detection limit, other detection methods might be employed, such as optical microresonators.41Conclusions
We tested the phage proteins LysK, lysostaphin and Φ11 as binding elements for biosensors surfaces. As an alternative to whole phages, these proteins are easier to purify and may be specifically oriented. They are also significantly smaller than whole phages or antibodies, which is an advantage in certain types of biosensors, such as optical microresonators based upon high quality-factor cavities or SPR. While the proteins might be expected to be more stable than whole virions, only surface-immobilized LysK showed consistent cellular attachment. Despite showing lytic activity in solution, lysostaphin and Φ11 were unpredictable when immobilized on wafers. Future work is required to determine why these proteins are unstable and to develop stabilized forms. Specificity of bacterial binding to LysK is at the genus level, with no binding of Enterococcus but some degree of binding of Micrococcus. A CHAP domain-deleted LysK, consisting of 346 amino acids, showed equivalent binding to the full-length protein, and was the smallest construct tested that permitted binding. The binding domain alone inhibited binding of bacteria to the wafer surfaces. Alteration of bacterial cell morphology with eventual lysis was also seen on the wafers. Further examination of truncated or mutated LysK will be necessary if further reduction in protein size is desired, or to prevent lytic activity.Acknowledgements
This work was supported by the Natural Sciences and Engineering Research Council (NSERC), Strategic Grant 365207-2008. We thank Richard Vernhes (LARFIS Research group, Department of Engineering Physics, École Polytechnique de Montréal) for his assistance with the ellipsometry measurements.Notes and references
- I. M. Gould, Int. J. Antimicrob. Agents, 2008, 32, S2–S9 CrossRef CAS PubMed.
- R. M. Klevens, M. A. Morrison, J. Nadle, S. Petit, K. Gershman, S. Ray, L. H. Harrison, R. Lynfield, G. Dumyati, J. M. Townes, A. S. Craig, E. R. Zell, G. E. Fosheim, L. K. McDougal, R. B. Carey, S. K. Fridkin and A. B. M. Investigators, JAMA, J. Am. Med. Assoc., 2007, 298, 1763–1771 CrossRef CAS PubMed.
- H. Wisplinghoff, T. Bischoff, S. M. Tallent, H. Seifert, R. P. Wenzel and M. B. Edmond, Clin. Infect. Dis., 2004, 39, 309–317 CrossRef PubMed.
- D. J. Pallin, D. J. Egan, A. J. Pelletier, J. A. Espinola, D. C. Hooper and C. A. Camargo, Ann. Emerg. Med., 2008, 51, 291–298 CrossRef PubMed.
- R. J. Gorwitz, Pediatr. Infect. Dis. J., 2008, 27, 925–926 CrossRef PubMed.
- T. S. Naimi, K. H. LeDell, K. Como-Sabetti, S. M. Borchardt, D. J. Boxrud, J. Etienne, S. K. Johnson, F. Vandenesch, S. Fridkin, C. O'Boyle, R. N. Danila and R. Lynfield, JAMA, J. Am. Med. Assoc., 2003, 290, 2976–2984 CrossRef CAS PubMed.
- I. Uckay, D. Pittet, P. Vaudaux, H. Sax, D. Lew and F. Waldvogel, Ann. Med., 2009, 41, 109–119 CrossRef CAS PubMed.
- R. P. Podzorski, H. Li, J. Han and Y.-W. Tang, J. Clin. Microbiol., 2008, 46, 3107–3109 CrossRef CAS PubMed.
- A. Singh, S. Poshtiban and S. Evoy, Sensors, 2013, 13, 1763–1786 CrossRef CAS PubMed.
- S. Balasubramanian, I. B. Sorokulova, V. J. Vodyanoy and A. L. Simonian, Biosens. Bioelectron., 2007, 22, 948–955 CrossRef CAS PubMed.
- L. Gervals, M. Gel, B. Allain, M. Tolba, L. Brovko, M. Zourob, R. Mandeville, M. Griffiths and S. Evoy, Sens. Actuators, B, 2007, 125, 615–621 CrossRef PubMed.
- M. Tolba, O. Minikh, L. Y. Brovko, S. Evoy and M. W. Griffiths, Appl. Environ. Microbiol., 2010, 76, 528–535 CrossRef CAS PubMed.
- J. Boratynski, D. Syper, B. Weber-Dabrowska, M. Lusiak-Szelachowska, G. Pozniak and A. Gorski, Cell. Mol. Biol. Lett., 2004, 9, 253–259 CAS.
- S. B. Humphrey, T. B. Stanton, N. S. Jensen and R. L. Zuerner, J. Bacteriol., 1997, 179, 323–329 CAS.
- K. Brorson, H. Shen, S. Lute, J. S. Perez and D. D. Frey, J. Chromatogr., A, 2008, 1207, 110–121 CrossRef CAS PubMed.
- A. A. Lindberg, R. Wollin, P. Gemski and J. A. Wohlhieter, J. Virol., 1978, 27, 38–44 CAS.
- A. Singh, S. K. Arya, N. Glass, P. Hanifi-Moghaddam, R. Naidoo, C. M. Szymanski, J. Tanha and S. Evoy, Biosens. Bioelectron., 2010, 26, 131–138 CrossRef CAS PubMed.
- A. M. Kropinski, D. Arutyunov, M. Foss, A. Cunningham, W. Ding, A. Singh, A. R. Pavlov, M. Henry, S. Evoy, J. Kelly and C. M. Szymanski, Appl. Environ. Microbiol., 2011, 77, 8265–8271 CrossRef CAS PubMed.
- J. W. Kretzer, R. Lehmann, M. Schmelcher, M. Banz, K.-P. Kim, C. Korn and M. J. Loessner, Appl. Environ. Microbiol., 2007, 73, 1992–2000 CrossRef CAS PubMed.
- S. C. Becker, S. Dong, J. R. Baker, J. Foster-Frey, D. G. Pritchard and D. M. Donovan, FEMS Microbiol. Lett., 2009, 294, 52–60 CrossRef CAS PubMed.
- S. C. Becker, J. Foster-Frey, A. J. Stodola, D. Anacker and D. M. Donovan, Gene, 2009, 443, 32–41 CrossRef CAS PubMed.
- S. O'Flaherty, A. Coffey, W. Meaney, G. F. Fitzgerald and R. P. Ross, J. Bacteriol., 2005, 187, 7161–7164 CrossRef CAS PubMed.
- S. C. Becker, J. Foster-Frey and D. M. Donovan, FEMS Microbiol. Lett., 2008, 287, 185–191 CrossRef CAS PubMed.
- J. Miao, R. C. Pangule, E. E. Paskaleva, E. E. Hwang, R. S. Kane, R. J. Linhardt and J. S. Dordick, Biomaterials, 2011, 32, 9557–9567 CrossRef CAS PubMed.
- R. Satishkumar, S. Sankar, Y. Yurko, A. Lincourt, J. Shipp, B. T. Heniford and A. Vertegel, Antimicrob. Agents Chemother., 2011, 55, 4379–4385 CrossRef CAS PubMed.
- J. F. Kokai-Kun, T. Chanturiya and J. J. Mond, J. Antimicrob. Chemother., 2009, 64, 94–100 CrossRef CAS PubMed.
- A. P. Desbois, C. G. Gemmell and P. J. Coote, Int. J. Antimicrob. Agents, 2010, 35, 559–565 CrossRef CAS PubMed.
- H. R. Trayer and C. E. Buckley, J. Biol. Chem., 1970, 245, 4842–4846 CAS.
- P. Sass and G. Bierbaum, Appl. Environ. Microbiol., 2007, 73, 347–352 CrossRef CAS PubMed.
- R. Mueller, G. Groeger, K.-A. Hiller, G. Schmalz and S. Ruhl, Appl. Environ. Microbiol., 2007, 73, 2653–2660 CrossRef CAS PubMed.
- P. Loskill, H. Haehl, N. Thewes, C. T. Kreis, M. Bischoff, M. Herrmann and K. Jacobs, Langmuir, 2012, 28, 7242–7248 CrossRef CAS PubMed.
- S. Karamdoust, B. Yu, C. V. Bonduelle, Y. Liu, G. Davidson, G. Stojcevic, J. Yang, W. M. Lau and E. R. Gillies, J. Mater. Chem., 2012, 22, 4881–4889 RSC.
- D. M. Donovan, M. Lardeo and J. Foster-Frey, FEMS Microbiol. Lett., 2006, 265, 133–139 CrossRef CAS PubMed.
- D. M. Donovan and J. Foster-Frey, FEMS Microbiol. Lett., 2008, 287, 22–33 CrossRef CAS PubMed.
- H. K. Hunt, C. Soteropulos and A. M. Armani, Sensors, 2010, 10, 9317–9336 CrossRef CAS PubMed.
- M. Schmelcher, A. M. Powell, S. C. Becker, M. J. Camp and D. M. Donovan, Appl. Environ. Microbiol., 2012, 78, 2297–2305 CrossRef CAS PubMed.
- R. Schlapak, D. Caruana, D. Armitage and S. Howorka, Soft Matter, 2009, 5, 4104–4112 RSC.
- S. K. Arya, A. Singh, R. Naidoo, P. Wu, M. T. McDermott and S. Evoy, Analyst, 2011, 136, 486–492 RSC.
- J. Z. Q. Lu, T. Fujiwara, H. Komatsuzawa, M. Sugai and J. Sakon, J. Biol. Chem., 2006, 281, 549–558 CrossRef CAS PubMed.
- K. H. Schleife and O. Kandler, Bacteriol. Rev., 1972, 36, 407–477 Search PubMed.
- A. M. Armani, R. P. Kulkarni, S. E. Fraser, R. C. Flagan and K. J. Vahala, Science, 2007, 317, 783–787 CrossRef CAS PubMed.
| This journal is © The Royal Society of Chemistry 2014 |

