A highly sensitive LED-induced chemiluminescence platform for aptasensing of platelet-derived growth factor†
Xinfeng
Zhang
*ab,
Hui
Zhang
a,
Shuxia
Xu
ab and
Yonghua
Sun
a
aCollege of Material and Chemistry & Chemical Engineering, Chengdu University of Technology, Chengdu 610059, China. E-mail: zhangxinfeng09@cdut.cn; Tel: +86-28-84079022
bMineral Resources Chemistry Key Laboratory of Sichuan Higher Education Institutions, Chengdu University of Technology, Chengdu 610059, China
First published on 11th October 2013
Abstract
In this work, we demonstrated a simple and highly sensitive LED-induced chemiluminescence (LED-CL) platform for aptasensing of proteins. It was based on the fact that fluorescein isothiocyanate (FITC) strongly catalyzed the reaction between luminol and dissolved oxygen under LED irradiation. Using FITC as a new catalytic tag, a highly sensitive sandwich type LED-CL aptasensor was fabricated for quantification of the model protein (platelet-derived growth factor-BB, PDGF-BB). Under optimized conditions, the assay for PDGF-BB was linear from 0.1 nM to 100 nM, and the detection limit was as low as 50 pM, which is better than most of other aptamer-based assays without an amplification procedure. Thrombin, bovine serum albumin, hemoglobin, cytochrome C and adenosine triphosphate showed no obvious interferences for the determination of PDGF-BB. The advantages of high sensitivity and selectivity provided by this LED-CL aptasensor will facilitate its wide application in protein assays.
1. Introduction
Aptamers are artificial nucleic acid ligands isolated from random-sequence DNA or RNA libraries with a broad range of molecular targets, including small molecules, ions, proteins, and even whole cells.1 The versatility of targets, the high affinity, specificity of aptamers, and the simplicity of in vitro selection make aptamers attractive molecular receptors and recognition elements for bioanalysis. Numerous aptasensors coupled with colorimetry,2,3 fluorescence,4,5 electrochemical detection,6,7 surface plasmon resonance,8,9etc. have been developed to boost their application in protein quantification that is critical for basic research and clinical applications.Chemiluminescence (CL) has been considered as one of the most sensitive analytical techniques accompanying the merits of simplicity, low cost of instrumentation and suitability for miniaturization in analytical chemistry.10 By combining the benefits of CL and aptamers, CL aptasensors are becoming a useful tool for quantification of proteins such as platelet-derived growth factor (PDGF),11,12 thrombin,13–15 lyzome,16–18 IgE,19etc. Especially, the amplification techniques like rolling circle amplification (RCA),12,20 nicking endonuclease assisted amplification,21 enlarged Au nanoparticles (Au NPs),11,19etc. have been applied to enhance the sensitivity of CL aptasensors with a low detection limit at the pM or even fM level. However, these signal-amplification platforms usually require either sophisticated protocols or complex reagents. Another simple approach for improving the sensitivity might be the use of a catalytic tag. Besides traditional enzymes (e.g. horseradish peroxidase), new catalytic tags such as DNAzyme,15,22 Au NPs,11,19 Pt nanoparticles,23etc. have also been adopted for labeling aptamers.
Recently, we suggested a light-emitting-diode induced chemiluminescence (LED-CL) technology which was based on the mechanism that the analytes i.e., quinones, coumarins, flavins, and xanthene dyes catalyzed the reaction between luminol and dissolved oxygen under LED irradiation.24–26 Some of the catalysts like xanthene dyes and flavins show high catalytic ability in the LED-CL system, which is featured by the low detection limit. Different from traditional enzymes, the catalysts are nonbiological and relatively stable with insusceptibility to the environmental conditions; more importantly, the affinity of aptamers might be little affected when using these small molecules for labeling. Thus, the catalyst in the LED-CL system should be a good alternative label for aptamers.
In the current work, fluorescein isothiocyanate (FITC), which was preliminarily found to be a good catalyst for the LED-CL system, was adopted as a new catalytic tag for the aptamer, and then a simple and sensitive LED-CL platform for aptasensing of proteins was demonstrated. The influencing factors on the LED-CL platform were examined in detail, and subsequently a sandwich type LED-CL aptasensor was fabricated for detection of PDGF-BB, an important protein biomarker for cell transformation and tumor growth. The proposed LED-CL aptasensor will provide the advantages of high sensitivity as well as selectivity.
2. Experimental
2.1 Materials
Oligonucleotides modified with a biotin and FITC group were synthesized by Sangon Biotechnology Co. Ltd. (Shanghai, China). The two sequences used for sensing were as follows: 5′-biotin-GCAGT![[T with combining low line]](https://www.rsc.org/images/entities/char_0054_0332.gif)
![[A with combining low line]](https://www.rsc.org/images/entities/char_0041_0332.gif)
![[C with combining low line]](https://www.rsc.org/images/entities/char_0043_0332.gif)
![[T with combining low line]](https://www.rsc.org/images/entities/char_0054_0332.gif)
![[C with combining low line]](https://www.rsc.org/images/entities/char_0043_0332.gif)
![[A with combining low line]](https://www.rsc.org/images/entities/char_0041_0332.gif)
![[G with combining low line]](https://www.rsc.org/images/entities/char_0047_0332.gif)
![[G with combining low line]](https://www.rsc.org/images/entities/char_0047_0332.gif)
![[G with combining low line]](https://www.rsc.org/images/entities/char_0047_0332.gif)
![[C with combining low line]](https://www.rsc.org/images/entities/char_0043_0332.gif)
![[A with combining low line]](https://www.rsc.org/images/entities/char_0041_0332.gif)
![[C with combining low line]](https://www.rsc.org/images/entities/char_0043_0332.gif)
![[T with combining low line]](https://www.rsc.org/images/entities/char_0054_0332.gif)
![[T with combining low line]](https://www.rsc.org/images/entities/char_0054_0332.gif)
![[G with combining low line]](https://www.rsc.org/images/entities/char_0047_0332.gif)
![[C with combining low line]](https://www.rsc.org/images/entities/char_0043_0332.gif)
![[A with combining low line]](https://www.rsc.org/images/entities/char_0041_0332.gif)
![[A with combining low line]](https://www.rsc.org/images/entities/char_0041_0332.gif)
![[T with combining low line]](https://www.rsc.org/images/entities/char_0054_0332.gif)
![[T with combining low line]](https://www.rsc.org/images/entities/char_0054_0332.gif)
![[G with combining low line]](https://www.rsc.org/images/entities/char_0047_0332.gif)
![[T with combining low line]](https://www.rsc.org/images/entities/char_0054_0332.gif)
![[G with combining low line]](https://www.rsc.org/images/entities/char_0047_0332.gif)
![[G with combining low line]](https://www.rsc.org/images/entities/char_0047_0332.gif)
![[T with combining low line]](https://www.rsc.org/images/entities/char_0054_0332.gif)
![[C with combining low line]](https://www.rsc.org/images/entities/char_0043_0332.gif)
![[C with combining low line]](https://www.rsc.org/images/entities/char_0043_0332.gif)
![[C with combining low line]](https://www.rsc.org/images/entities/char_0043_0332.gif)
![[A with combining low line]](https://www.rsc.org/images/entities/char_0041_0332.gif)
![[A with combining low line]](https://www.rsc.org/images/entities/char_0041_0332.gif)
![[T with combining low line]](https://www.rsc.org/images/entities/char_0054_0332.gif)
![[G with combining low line]](https://www.rsc.org/images/entities/char_0047_0332.gif)
![[G with combining low line]](https://www.rsc.org/images/entities/char_0047_0332.gif)
![[G with combining low line]](https://www.rsc.org/images/entities/char_0047_0332.gif)
![[C with combining low line]](https://www.rsc.org/images/entities/char_0043_0332.gif)
![[T with combining low line]](https://www.rsc.org/images/entities/char_0054_0332.gif)
![[G with combining low line]](https://www.rsc.org/images/entities/char_0047_0332.gif)
![[A with combining low line]](https://www.rsc.org/images/entities/char_0041_0332.gif)
![[G with combining low line]](https://www.rsc.org/images/entities/char_0047_0332.gif)
![[T with combining low line]](https://www.rsc.org/images/entities/char_0054_0332.gif)
![[A with combining low line]](https://www.rsc.org/images/entities/char_0041_0332.gif)
![[T with combining low line]](https://www.rsc.org/images/entities/char_0054_0332.gif) -3′; 5′-FITC-AGTTCT
-3′; 5′-FITC-AGTTCT![[T with combining low line]](https://www.rsc.org/images/entities/char_0054_0332.gif)
![[A with combining low line]](https://www.rsc.org/images/entities/char_0041_0332.gif)
![[C with combining low line]](https://www.rsc.org/images/entities/char_0043_0332.gif)
![[T with combining low line]](https://www.rsc.org/images/entities/char_0054_0332.gif)
![[C with combining low line]](https://www.rsc.org/images/entities/char_0043_0332.gif)
![[A with combining low line]](https://www.rsc.org/images/entities/char_0041_0332.gif)
![[G with combining low line]](https://www.rsc.org/images/entities/char_0047_0332.gif)
![[G with combining low line]](https://www.rsc.org/images/entities/char_0047_0332.gif)
![[G with combining low line]](https://www.rsc.org/images/entities/char_0047_0332.gif)
![[C with combining low line]](https://www.rsc.org/images/entities/char_0043_0332.gif)
![[A with combining low line]](https://www.rsc.org/images/entities/char_0041_0332.gif)
![[C with combining low line]](https://www.rsc.org/images/entities/char_0043_0332.gif)
![[T with combining low line]](https://www.rsc.org/images/entities/char_0054_0332.gif)
![[T with combining low line]](https://www.rsc.org/images/entities/char_0054_0332.gif)
![[G with combining low line]](https://www.rsc.org/images/entities/char_0047_0332.gif)
![[C with combining low line]](https://www.rsc.org/images/entities/char_0043_0332.gif)
![[A with combining low line]](https://www.rsc.org/images/entities/char_0041_0332.gif)
![[A with combining low line]](https://www.rsc.org/images/entities/char_0041_0332.gif)
![[T with combining low line]](https://www.rsc.org/images/entities/char_0054_0332.gif)
![[T with combining low line]](https://www.rsc.org/images/entities/char_0054_0332.gif)
![[G with combining low line]](https://www.rsc.org/images/entities/char_0047_0332.gif)
![[T with combining low line]](https://www.rsc.org/images/entities/char_0054_0332.gif)
![[G with combining low line]](https://www.rsc.org/images/entities/char_0047_0332.gif)
![[G with combining low line]](https://www.rsc.org/images/entities/char_0047_0332.gif)
![[T with combining low line]](https://www.rsc.org/images/entities/char_0054_0332.gif)
![[C with combining low line]](https://www.rsc.org/images/entities/char_0043_0332.gif)
![[C with combining low line]](https://www.rsc.org/images/entities/char_0043_0332.gif)
![[C with combining low line]](https://www.rsc.org/images/entities/char_0043_0332.gif)
![[A with combining low line]](https://www.rsc.org/images/entities/char_0041_0332.gif)
![[A with combining low line]](https://www.rsc.org/images/entities/char_0041_0332.gif)
![[T with combining low line]](https://www.rsc.org/images/entities/char_0054_0332.gif)
![[G with combining low line]](https://www.rsc.org/images/entities/char_0047_0332.gif)
![[G with combining low line]](https://www.rsc.org/images/entities/char_0047_0332.gif)
![[G with combining low line]](https://www.rsc.org/images/entities/char_0047_0332.gif)
![[C with combining low line]](https://www.rsc.org/images/entities/char_0043_0332.gif)
![[T with combining low line]](https://www.rsc.org/images/entities/char_0054_0332.gif)
![[G with combining low line]](https://www.rsc.org/images/entities/char_0047_0332.gif)
![[A with combining low line]](https://www.rsc.org/images/entities/char_0041_0332.gif)
![[G with combining low line]](https://www.rsc.org/images/entities/char_0047_0332.gif)
![[T with combining low line]](https://www.rsc.org/images/entities/char_0054_0332.gif)
![[A with combining low line]](https://www.rsc.org/images/entities/char_0041_0332.gif)
![[T with combining low line]](https://www.rsc.org/images/entities/char_0054_0332.gif) -3′. The underlined sequences correspond to the PDGF-BB aptamer.27 PDGF-BB, thrombin, cytochrome C, hemoglobin, and adenosine triphosphate (ATP) were purchased from Sigma-Aldrich. Bovine serum albumin (BSA), glucose, uric acid, sodium chloride, potassium chloride, sodium hydroxide, and hydrochloric acid were obtained from Kelong reagent Co. (Chengdu, China). Luminol was used as CL reagent, and the stock solution of 0.01 M was prepared by dissolving 0.4454 g powder in 250 mL ultrapure water. All chemicals were of analytical grade and were used as received.
-3′. The underlined sequences correspond to the PDGF-BB aptamer.27 PDGF-BB, thrombin, cytochrome C, hemoglobin, and adenosine triphosphate (ATP) were purchased from Sigma-Aldrich. Bovine serum albumin (BSA), glucose, uric acid, sodium chloride, potassium chloride, sodium hydroxide, and hydrochloric acid were obtained from Kelong reagent Co. (Chengdu, China). Luminol was used as CL reagent, and the stock solution of 0.01 M was prepared by dissolving 0.4454 g powder in 250 mL ultrapure water. All chemicals were of analytical grade and were used as received.
2.2 LED-CL system
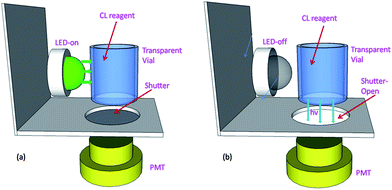
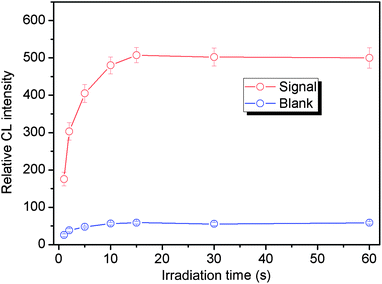
The LED-CL apparatus for the sensing was quite simple, which was designed as shown in Fig. 1. 0.3 mL of vial (made of polystyrene) was used to fill the CL solution containing the FITC-aptamer and luminol. A high power LED (green, 1 W) was placed in front of the CL vial (Fig. 1a). By turning on the LED, the CL reaction was initiated. During the period of LED irradiation, the shutter was closed to prevent the LED light entering the photomultiplier tube (PMT, 300–650 nm). After 15 s of LED irradiation, the LED was turned off and the shutter was opened immediately so that the CL signals were detected by the PMT of the CL analyzer (Xi'an Remax Ltd. Co., Xi'an, China), as shown in Fig. 1b.2.3 Detection of PDGF-BB by the LED-CL aptasensor
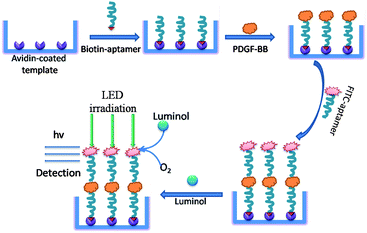
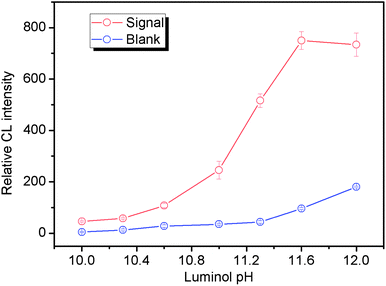
The procedure for detection of PDGF-BB by the LED-CL aptasensor is shown in Fig. 2. Briefly, the avidin-coated microplates were prepared by incubating 5 mg L−1 of avidin (prepared in pH 9.6 sodium carbonate buffer) in 96-well microplates overnight at 4 °C; then, the well microplates were blocked with the blocking buffer (PBS buffer plus 10% BSA, 150 μL) for 1 h, followed by washing for one time with washing buffer; after removing the supernatant carefully, 150 μL of 300 nM biotin-modified aptamer (prepared in pH 7.4 buffer containing 10 mM Tris, 10 mM EDTA and 2 mM NaCl) was added to the well microplates and incubated for 1 h. After washing, a series of concentration of PDGF-BB was then added into each well (150 μL) and incubated for 1 h. Unbound PDGF-BB were removed by washing. The FITC-labeled aptamer was added and incubated to allow the formation of sandwich complexes in the microtiter plate. The plates were then washed with washing buffer one time and ultrapure water one time; finally, 200 μL of pH 11.30 luminol was added to the wells of the microplate before detection. Under LED irradiation, the FITC-aptamer catalyzed the reaction between luminol and dissolved oxygen with the generation of CL.3. Results and discussion
3.1 LED-CL behavior of the FITC-aptamer in a static system
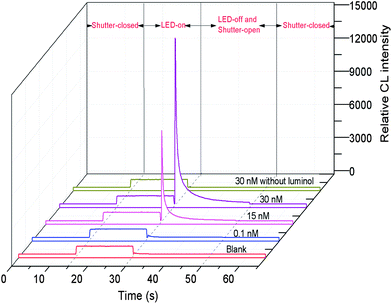
In preliminary experiments, FITC, a frequently used labeling reagent for DNA and proteins, was found to be able to strongly catalyze the reaction between luminol and dissolved oxygen under LED irradiation. Thus, FITC was used as a catalytic tag for labeling the aptamer. Because of no additional oxidant, we designed a simple static LED-CL system for detection of the FITC tagged aptamer (FITC-aptamer) as shown in Fig. 1. When LED was turned on, the CL reaction began; after 15 s of irradiation, the LED was turned off and the shutter was opened to collect CL signals. As shown in Fig. 3, a low blank signal and a relatively high LED-CL signal of the FITC-aptamer were obtained with this design. Without luminol, there was no signal even in the presence of 30 nM FITC-aptamer. 5 nM FITC-aptamer was used for examination of the reproducibility of LED-CL behaviors, the relative standard deviation (RSD) for seven consecutive detections was 2.3% (Fig. S1†). These results indicated the strong and stable LED-CL behavior of the FITC-aptamer.3.2 Optimization of LED-CL conditions
4. Performance of the LED-CL aptasensor for detection of PDGF-BB
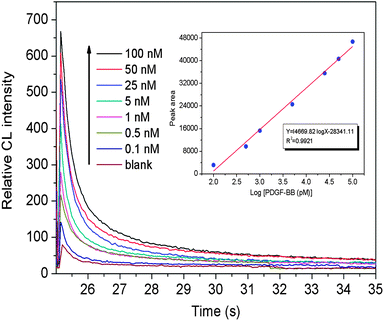
Under the optimized LED-CL conditions, the quantification of PDGF-BB was assessed by monitoring the dependence between the CL peak area and PDGF-BB concentration. Fig. 7 showed that the CL peak area increased linearly with the logarithm of PDGF-BB concentration in the range of 0.1–100 nM. The calibration equation could be described as Y = 14![[thin space (1/6-em)]](https://www.rsc.org/images/entities/char_2009.gif) 669.82
669.82![[thin space (1/6-em)]](https://www.rsc.org/images/entities/char_2009.gif) log
log![[thin space (1/6-em)]](https://www.rsc.org/images/entities/char_2009.gif) X − 28
X − 28![[thin space (1/6-em)]](https://www.rsc.org/images/entities/char_2009.gif) 341.11 (where Y is the CL peak area and X is the PDGD-BB concentration) with a correlation coefficient (R2) of 0.9921. The limit-of-detection (LOD) based on a signal-to-noise of 3 for PDGF-BB was down to 50 pM. As shown in Table 1, this LED-CL aptasensor is more sensitive than most of other aptamer-based detection methods without a signal amplification procedure. Although the sensitivity of this LED-CL aptasensor is lower than that of signal-amplified detection methods, the amplification procedures were rather time-consuming.12,20 The reproducibility of the method was also examined using 5 nM PDGF-BB, and the RSD for five parallel detections was 4.3%.
341.11 (where Y is the CL peak area and X is the PDGD-BB concentration) with a correlation coefficient (R2) of 0.9921. The limit-of-detection (LOD) based on a signal-to-noise of 3 for PDGF-BB was down to 50 pM. As shown in Table 1, this LED-CL aptasensor is more sensitive than most of other aptamer-based detection methods without a signal amplification procedure. Although the sensitivity of this LED-CL aptasensor is lower than that of signal-amplified detection methods, the amplification procedures were rather time-consuming.12,20 The reproducibility of the method was also examined using 5 nM PDGF-BB, and the RSD for five parallel detections was 4.3%.
| Detection methoda | Label | Amplification | Sample volumeb | LOD |
|---|---|---|---|---|
| a Where FRET stands for fluorescence resonance energy transfer and RCA. b NM stands for not mentioned. | ||||
| Colorimetry | AuNPs | — | 100 μL | 35 nM (ref. 28) |
| Fluorescence | [Ru(phen)2(dppz)]2+ | — | 1 mL | 1.0 nM (ref. 29) |
| FRETa | Quantum dot | — | NM | 0.4 nM (ref. 30) |
| Fluorescence | FAM | RCA | NM | 6.8 pM (ref. 31) |
| CL | AuNPs | Enlarged AuNPs | 100 μL | 60 pM (ref. 11) |
| CL | HRP | RCA | 100 μL | 10 fM (ref. 12) |
| LED-CL | FITC | — | 150 μL | 50 pM (this work) |
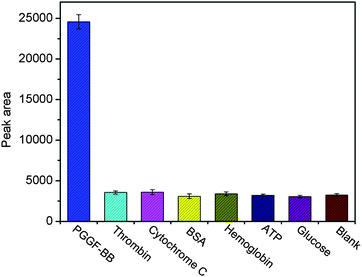
To investigate the specificity of the proposed LED-CL aptasensor, six kinds of potential interfering substances: thrombin, cytochrome C, hemoglobin, BSA, ATP and glucose were used in this study. LED-CL responses of PDGF-BB solutions containing interfering substances were assayed. As shown in Fig. 8, a high LED-CL response was observed when 5 nM PDGF-BB was tested; whereas the LED-CL signals of 200 nM of thrombin, BSA, hemoglobin, cytochrome C, ATP and glucose were similar to the blank signal, indicating no interference from these compounds. The high specificity for PDGF-BB was attributed to the discrimination of the PDGF-BB aptamer. Its affinity might be little affected when labeled with FITC which is a small molecule.
5. Conclusions
A simple and highly sensitive LED-CL platform has been established for aptasensing of protein by using FITC as a catalytic tag. The approach for PDGF-BB detection is more sensitive than most other aptamer-based assays without an amplification procedure. The fabricated LED-CL aptasensor could also be used for quantification of other proteins such thrombin, lyzome, IgE, etc. by using different aptamers. In comparison with traditional enzymes, FITC as a catalytic tag is insusceptible to environmental conditions. Moreover, the sensitivity of the LED-CL aptasensor would be further improved by combining with an amplification technique such as rolling circle amplification,20 nicking endonuclease assisted amplification,21etc. Thus, the proposed LED-CL aptasensor is a promising alternative tool for protein quantification.Acknowledgements
The authors gratefully acknowledge the financial support from the National Natural Science Foundation of China (no. 21005010 and 21305009), the Sichuan youth science and technology innovation research team funding scheme (no. 2013TD0005), and the cultivating program of middle-aged backbone teachers of Chengdu University of Technology.Notes and references
- A. Sassolas, L. J. Blum and B. D. Leca-Bouvier, Biosens. Bioelectron., 2011, 26, 3725 CrossRef CAS PubMed.
- H. Wei, B. Q. Li, J. Li, E. K. Wang and S. J. Dong, Chem. Commun., 2007, 3735 RSC.
- J. W. Liu and Y. Lu, Nat. Protoc., 2006, 1, 246 CrossRef CAS PubMed.
- M. J. Zou, Y. Chen, X. Xu, H. D. Huang, F. Liu and N. Li, Biosens. Bioelectron., 2012, 32, 148 CrossRef CAS PubMed.
- A. R. Ruslinda, V. Penmatsa, Y. Ishii, S. Tajima and H. Kawarada, Analyst, 2012, 137, 1692 RSC.
- Y. Zhu, P. Chandra and Y. B. Shim, Anal. Chem., 2013, 85, 1058 CrossRef CAS PubMed.
- E. J. Nam, E. J. Kim, A. W. Wark, S. Rho, H. Kim and H. J. Lee, Analyst, 2012, 137, 2011 RSC.
- W. J. Zhou, A. R. Halpern, T. H. Seefeld and R. M. Corn, Anal. Chem., 2012, 84, 440 CrossRef CAS PubMed.
- R. Zheng, B. W. Park, D. S. Kim and B. D. Cameron, Biomed. Opt. Express, 2011, 2, 2731 CrossRef CAS PubMed.
- A. Roda and M. Guardigli, Anal. Bioanal. Chem., 2012, 402, 69 CrossRef CAS PubMed.
- P. Wang, Y. H. Song, Y. J. Zhao and A. P. Fan, Talanta, 2013, 103, 392 CrossRef CAS PubMed.
- Z. J. Cao, Q. W. Peng, X. Qiu, C. Y. Liu and J. Z. Lu, J. Pharm. Anal., 2011, 1, 159 CrossRef CAS.
- G. Qin, S. Zhao, Y. Huang, J. Jiang and Y. M. Liu, Biosens. Bioelectron., 2013, 46, 119 CrossRef CAS PubMed.
- Y. Qi and B. Li, Chem.–Eur. J., 2011, 17, 1642 CrossRef CAS PubMed.
- T. Li, E. Wang and S. Dong, Chem. Commun., 2008, 5520 RSC.
- Y. Li, H. L. Qi, Q. Gao and C. X. Zhang, Biosens. Bioelectron., 2011, 26, 2733 CrossRef CAS PubMed.
- Z. M. Wang and Z. H. Song, Analyst, 2010, 135, 2546 RSC.
- Z. H. Song and S. Hou, Anal. Sci., 2003, 19, 347 CrossRef CAS PubMed.
- Y. H. Sun, S. Cai, Z. J. Cao, C. W. Lau and J. Z. Lu, Analyst, 2011, 136, 4144 RSC.
- S. Bi, L. Li and S. S. Zhang, Anal. Chem., 2010, 82, 9447 CrossRef CAS PubMed.
- X. Hun, H. C. Chen and W. Wang, Biosens. Bioelectron., 2010, 26, 248 CrossRef PubMed.
- B. Shlyahovsky, D. Li, E. Katz and I. Willner, Biosens. Bioelectron., 2007, 22, 2570 CrossRef CAS PubMed.
- R. Polsky, R. Gill, L. Kaganovsky and I. Willner, Anal. Chem., 2006, 78, 2268 CrossRef CAS PubMed.
- X. F. Zhang, Y. Y. Hu, A. M. Sun, Y. Lv and X. D. Hou, J. Chromatogr., A, 2009, 1216, 8926 CrossRef CAS PubMed.
- X. F. Zhang, J. Y. Zhang, X. Wu, Y. Lv and X. D. Hou, Electrophoresis, 2009, 30, 1937 CrossRef CAS PubMed.
- S. X. Xu, X. F. Zhang, W. W. Liu, Y. H. Sun and H. L. Zhang, Biosens. Bioelectron., 2013, 43, 160 CrossRef CAS PubMed.
- L. S. Green, D. Jellinek, R. Jenison, A. Ostman, C. H. Heldin and N. Janjic, Biochemistry, 1996, 35, 14413 CrossRef CAS PubMed.
- C. C. Chang, S. C. Wei, T. H. Wu, C. H. Lee and C. W. Lin, Biosens. Bioelectron., 2013, 42, 119 CrossRef CAS PubMed.
- Y. X. Jiang, X. H. Fang and C. L. Bai, Anal. Chem., 2004, 76, 5230 CrossRef CAS PubMed.
- G. I. Kim, K. W. Kim, M. K. Oh and Y. M. Sung, Nanotechnology, 2009, 20, 175503 CrossRef PubMed.
- Z. S. Wu, S. Zhang, H. Zhou, G. L. Shen and R. Yu, Anal. Chem., 2010, 82, 2221 CrossRef CAS PubMed.
Footnote |
| † Electronic supplementary information (ESI) available. See DOI: 10.1039/c3an01566a |
| This journal is © The Royal Society of Chemistry 2014 |

