Triclosan interferes with the thyroid axis in the zebrafish (Danio rerio)
Patrícia I. S.
Pinto†
*,
Eduarda M.
Guerreiro†
and
Deborah M.
Power
Centro de Ciências do Mar, CIMAR – Laboratório Associado, University of Algarve, Campus de Gambelas, 8005-139 Faro, Portugal. E-mail: ppinto@ualg.pt; Fax: +351 289800069; Tel: +351 289800100x7336
First published on 19th September 2012
Abstract
This study focuses on the effects of triclosan (TCS), a ubiquitous antimicrobial agent and aquatic contaminant, on the thyroid of adult zebrafish. The morphology of the thyroid was modified after short term (21 days) dietary exposure of zebrafish to TCS (100 μg g−1 fish per day). Hyperplasia of the thyroid tissue was observed in TCS treated zebrafish, and they had significantly (p < 0.01) more follicles, significantly (p < 0.05) bigger follicles and a significant reduction (p < 0.001) in thyrocyte height relative to the control fish, which is indicative of thyroid inactivation. Analysis of thyroid hormone synthesis associated transcripts in whole zebrafish heads revealed that TCS exposure caused a significant up-regulation of the sodium–iodide symporter (NIS) and thyroid-stimulating hormone (TSH), but did not modify thyroglobulin, thyroid peroxidase or cathepsin Ba. The increase in TSH and NIS transcription coupled to histology indicative of thyroid inactivation suggests that a reduction in circulating thyroid hormones probably occurred, although the exact mechanisms by which TCS reduces thyroid gland activity remains to be established. To our knowledge this is the first study demonstrating that TCS acts on the fish thyroid axis. The importance of the thyroid in basic physiological processes such as metabolism and nervous tissue development means that interference with this axis may have profound consequences for organism health and survival, and the results of the present study highlight the need for more detailed studies of the effects of TCS, which accumulates in sediments and organisms in aquatic environments.
Introduction
The accumulation in the aquatic environment of anthropogenic chemicals, among which are endocrine disrupting chemicals (EDCs), that alter normal hormonal regulation, is having dramatic consequences for humans and wildlife.1 Numerous chemicals disrupt thyroid homeostasis affecting thyroid hormone (TH) synthesis and transport, and cellular uptake and metabolism.2,3 In particular, TH synthesis that is regulated by the hypothalamus–pituitary–thyroid (HPT) axis, is quite susceptible to disruption and thyroid activity assessed by histology and/or thyroid specific gene transcription are modified by several common environmental contaminants.2–4 The thyroid hormones (THs), tetraiodo-L-thyronine (thyroxine, T4) and triiodo-L-thyronine (T3), play important roles in the regulation of a range of physiological functions in vertebrates including development, differentiation and metabolism.5,6 Given the crucial role of THs in normal development and survival of vertebrates, namely fish,5,7,8 it is of great importance to identify environmental contaminants that may adversely affect thyroid function. Complementary but important information about contaminants includes their mechanism of action, their risk to animal and human health and the development of sensitive biomarkers for monitoring for exposure to thyroid disrupting chemicals.4Triclosan (TCS) is a synthetic chlorinated phenolic compound with a generalized use as an antimicrobial and preservative in many personal care and household products.9–11 As a result of disposal of TCS through sewage systems and insufficient/variable removal by wastewater treatment plants (WWTP),9 widespread contamination with TCS has been detected in several countries, particularly in aquatic ecosystems, WWTP influents and effluents; sludges and biosolids; surface or ground water; drinking water; and aquatic sediments.9,11,12 TCS and its metabolites have been detected in tissues and body fluids of aquatic organisms including fish, revealing they are accumulating in the food chain,9,12–18 and TCS has also been detected in human blood, breast milk and urine.9–11
Risk assessment studies with TCS reveal it is toxic for aquatic organisms and effects include delayed or impaired embryonic development and hatching, altered enzyme activities, genotoxicity and death in fish embryos and alterations in swimming behaviour and survival of adult fish.9,11,12,18–20 However, the modes of action of TCS in humans and wildlife are still poorly explored. Weak estrogenic or androgenic activities for TCS were recorded from fish to mammals (reviewed by ref. 9–11,18), and its structural similarity with THs9,21 suggest it may also have adverse effects on the thyroid. However, little is known about the mechanisms by which TCS disrupts the thyroid axis, apart from some recent studies indicating it reduces circulating TH levels and alters the activity and gene expression of enzymes related to TH homeostasis in mammals.21–23In vivo and in vitro TCS exposure studies on amphibians indicate interference with TH-mediated gene expression, acceleration of TH-induced metamorphosis and/or altered larval growth, depending on the species,24–27 while its metabolite methyl TCS also affected TH-responsive gene transcription in frog tadpole tail fin cultures.26
However, TCS effects on fish thyroid axis have not been investigated. The possibility that the TCS toxic effects reported in fish embryos, larvae and adults9,11,12 may be, at least in part, through its effect on the thyroid system, was studied using adult zebrafish. TCS was administered to adult zebrafish and thyroid tissue histology and the transcription of genes involved in TH synthesis were evaluated, including the sodium–iodide symporter (NIS or slc5a5), thyroid peroxidase (TPO), thyroglobulin (Tg), cathepsin B-isoform a (CtsBa), and the thyroid-stimulating hormone β subunit (TSH). In parallel, zebrafish were also exposed to propylthiouracil (PTU), a commonly used anti-thyroid drug.28
Materials and methods
Animals and experimental conditions
Adult zebrafish, imported from Thailand and purchased from a local supplier (LusoReef, Lagoa, Portugal), were weighted and distributed between 6 tanks (n = 8 fish, total mass 3.06 ± 0.12 g each tank) containing 5.5 L of freshwater in a closed circuit system at 26 °C, under a 12 h light![[thin space (1/6-em)]](https://www.rsc.org/images/entities/char_2009.gif) :12 h dark photoperiod. Fish were adapted to the experimental conditions for at least 2 weeks before the start of the experiment and were fed daily with dry food commercial pellets (Code Energy, Aquatic Nature, Roeselare, Belgium) at approximately 1.5% (of fish wet weight per tank).
:12 h dark photoperiod. Fish were adapted to the experimental conditions for at least 2 weeks before the start of the experiment and were fed daily with dry food commercial pellets (Code Energy, Aquatic Nature, Roeselare, Belgium) at approximately 1.5% (of fish wet weight per tank).
The experimental design, chemicals and doses used aimed to identify possible effects and routes of action by which thyroid disruption could occur in vivo and not the dose-related toxicity of these chemicals at the concentrations normally found in the environment. Exposure of fish to TCS and PTU (Sigma-Aldrich) was carried out for 21 days via the diet, which is one of the main routes of exposure to TCS when fish feed on contaminated organisms or sediments.9 A total of 16 fish per treatment were maintained in replicate tanks (n = 8) and fed commercial pellets sprayed with the test chemical dissolved in ethanol, as previously described,29 or with ethanol alone in the case of the control fish. The estimated daily doses were 100 μg g−1 fish per day for TCS, the lowest dose causing a significant decrease in T4 serum levels in rats,21 and 5 μg g−1 fish per day for PTU, a dose which induces hypothyroidism in goats.30 After 21 days, fish were euthanized in 0.05% phenoxyethanol and were either frozen in liquid N2 (n = 8/treatment) for RNA extraction or fixed overnight at 4 °C in fresh 4% paraformaldehyde (n = 8/treatment) for thyroid histology. No mortality occurred during the acclimation or the experimental periods. No differences in feeding behaviour between treatments were observed, while altered swimming behaviour was observed in the TCS-treated fish at the end of the treatment. Fish maintenance and all manipulations were carried out in accordance with the guidelines of the European Union (86/609/EU) and were covered by a “Group-1” license from the Direcção-Geral de Veterinária, Ministério da Agricultura, do Desenvolvimento Rural e das Pescas, Portugal.
Histology and stereology
Whole zebrafish heads were dehydrated in a graded ethanol series (50%–100%) and impregnated in paraffin in a TP1020 tissue processor (Leica, Spain). Serial longitudinal sections (5 μm) of paraffin embedded heads were mounted on glass slides coated with aminopropyltriethoxysilane (APES, Sigma-Aldrich) and dried overnight at 37 °C. Sections were stained with Hematoxylin and Eosin and the thyroid tissue examined with an Olympus BH2 microscope and digital images captured using an Olympus DP11 digital camera (Olympus, Portugal).The internal/external areas of thyroid follicles and thyrocyte height were measured in the digital images of 3 consecutive sections from approximately the same location (n = 5–6 fish per group) using the software ImageJ (http://rsbweb.nih.gov/ij/). Sections from different treatments contained a different number of follicles and 3 follicles per section were analyzed. Thyrocyte height was determined in all sections by measuring two cells per follicle, lying 90° from one another.
Database search, primer design and cloning of target genes
The cDNA sequences for the genes of interest were obtained by searching the zebrafish genome database of the National Centre for Biotechnology Information (http://www.ncbi.nlm.nih.gov), using query by gene name or BlastX with cDNA sequences of homologous genes from other organisms. Retrieved cDNA sequences had the following accession numbers: BC056688.1 (CtsBa); DQ402039.1 (NIS); DQ278875.1 (Tg); XM_692744.3 (TPO) and AY135147.1 (TSH). The reference genes evaluated for normalization in quantitative PCR were glyceraldehyde-3-phosphate dehydrogenase 2 (GAPDH-2, AY818346) and 18S ribosomal RNA (18S, FJ915075). Specific primers for amplification of target cDNA for cloning or for quantitative PCR (Table 1) were designed using the software Primer Premier 5.0 and Beacon Designer 4 (Premier Biosoft Int., Palo Alto, CA). Primers were designed to different exons and selected to avoid amplification of related genes.| Target gene | Primer sequencea | Amplicon sizeb (bp) | Tac (°C) | |
|---|---|---|---|---|
| a Primer sequences indicated from 5′ to 3′ for forward (Fw) and reverse (Rv) primers. b Size of amplified products indicated in base pairs (bp). c Optimized annealing temperature (Ta) used for each pair of primers. | ||||
| RT-PCR primers for cloning | ||||
| Tg | Fw | TCACAGCATCAATGCTGCG | 771 | 60 |
| Rv | TGGAGGTTTTTGCGGTTCA | |||
| CtsBa | Fw | CTTGGACGGCTGGACATAAC | 922 | 59 |
| Rv | TATAACATTTGATCAGGGGCTTC | |||
| TSH | Fw | AGACCCTCCAGACAGACATCC | 459 | 60 |
| Rv | GCGTAGTTGTTCTCCTCGG | |||
| NIS | Fw | GAATGAGGTTTGGCAGAGGG | 618 | 52 |
| Rv | GGTACGGCATGTACTGGTCAGG | |||
| TPO | Fw | AACCCAAAGGCTGGAACGCTG | 951 | 60 |
| Rv | AGAGATGGTGACATGCCCGAAG | |||
| GAPDH-2 | Fw | CTTTGGTATTGAGGAGGC | 533 | 60 |
| Rv | GGAATGGTCTGGCTTTTCT | |||
| 18S | Fw | TCAAGAACGAAAGTCGGAGG | 485 | 60 |
| Rv | GGACATCTAAGGGCATCACA | |||
| RT-PCR primers for qPCR | ||||
| Tg | Fw | TCATCAGCAGAGCCAAGAACATCAAG | 177 | 60 |
| Rv | ATCCTGAAGGTGTGGGCGAGTG | |||
| CtsBa | Fw | CCGTCTGCTGCTTGGGATTTCTGG | 104 | 60 |
| Rv | TGCTTCACAGGGTTCAATGGTATATGGAC | |||
| TSH | Fw | TGGTGGGTCCTCGTTTTATTGTTCAG | 179 | 60 |
| Rv | GCGGGTTCTAAGGGCACATTCATC | |||
| NIS | Fw | TTTGCGATAGACCCTCAGAG | 183 | 60 |
| Rv | GCTCACAATCAGACACAGAC | |||
| TPO | Fw | CCAGCCAGACCTCGTTC | 140 | 60 |
| Rv | CGGAGATGAGCGGAAGAAG | |||
| GAPDH-2 | Fw | CTGTGGGCAAAGTCATTCCTG | 135 | 60 |
| Rv | ACTCCTTGATGTTGGCGTAGC | |||
The templates for standard curves used in quantitative PCR were generated by RT (reverse-transcriptase)-PCR from zebrafish head cDNA, prepared from 500 ng of DNAse-treated total RNA and 200 ng random-hexamers as previously described.31 Reactions contained 0.4 pmol of each primer (Table 1), 200 μM dNTPs, 2–2.5 mM MgCl2, 1 U EuroTaq DNA polymerase (Euroclone, Siziano, Italy) and 1 μl cDNA in a final volume of 25 μl. Cycling conditions were 3 min at 94 °C, 30 cycles of 40 s at 94 °C, 45 s at the optimized annealing temperature for each gene (Table 1) and 30–75 s (depending on the expected fragment size) at 72 °C, followed by a final extension of 5 min at 72 °C. Amplified targets were ligated into pGEM®-T Easy (Promega) and identity confirmed by sequencing.
Analysis of gene expression by quantitative real-time RT-PCR (qPCR)
Transcription levels of the five selected genes involved in TH synthesis (CtsBa, NIS, Tg, TPO and TSH) and two candidate reference genes (GAPDH-2 and 18S) were analyzed by qPCR in individual zebrafish head cDNAs (n = 8) from each experimental group, using SYBRgreen chemistry and the relative standard curve method as previously described.31 Standard curves relating initial template quantity to amplification cycle were generated using serial dilutions of linearized plasmid DNA containing the cloned gene of interest and efficiency ranged between 83–100% with R2 > 0.98.GAPDH-2 was chosen as a reference gene to normalize qPCR expression of target templates since no significant differences in transcript expression was found between groups, in contrast to 18S which was significantly lower (p < 0.05) in the TCS compared to the control group. Copy number of the target or reference genes was calculated as previously described32 and relative gene expression of each target gene was calculated by dividing calculated gene copy numbers between the target and reference (GAPDH-2) genes in each cDNA sample.
Statistical analysis
All statistical analyses were carried out using SigmaStat v.3.11 (SPSS Inc, Chicago, USA) with statistical significance set at p < 0.05. One Way ANOVA followed by the Tukey-test were used to assess differences between groups in the stereological analysis (using log10 of internal area, external area or thyrocyte height); in reference gene validation of qPCR (starting quantity of GAPDH-2 or 18S) and in gene expression quantification (log10 of relative expression of each target gene).Results
Histological and stereological results
The histology of the thyroid tissue was examined in all experimental groups to investigate morphological parameters indicative of altered thyroid tissue activity. Approximately the same area was surveyed in each individual and the diagram in Fig. 1A represents the region selected for analysis of thyroid follicles. The thyroid in teleost fish does not generally form an encapsulated gland and as expected in zebrafish thyroid follicles were distributed in the loose connective tissue of the pharynx around the aorta (Fig. 1A).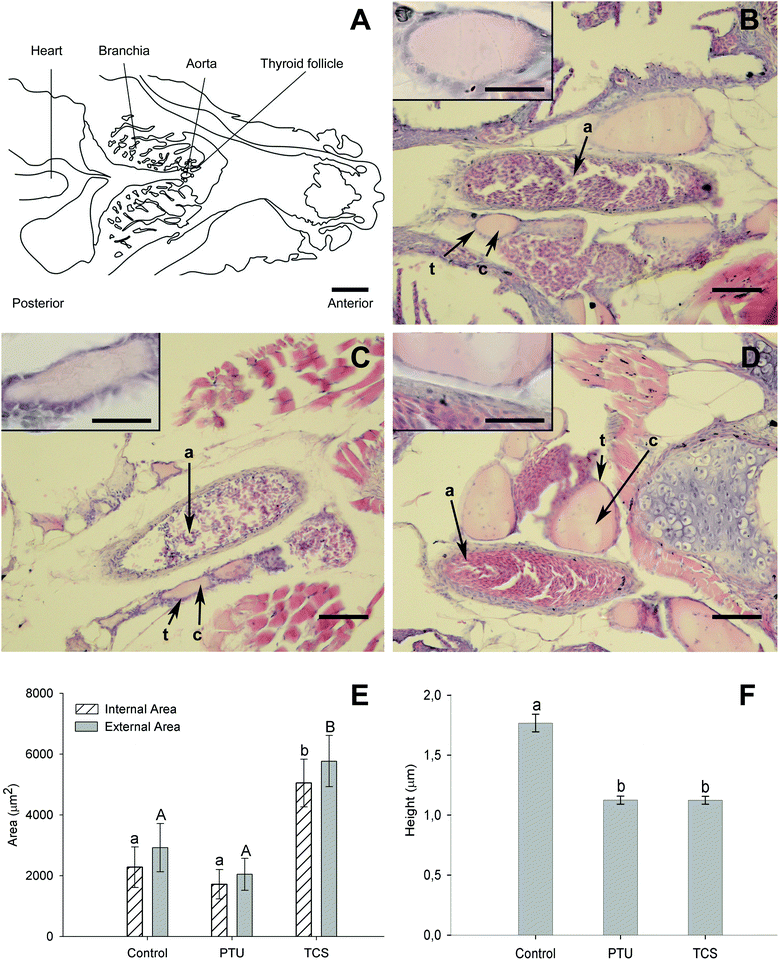 | ||
| Fig. 1 Histological and stereological analysis of thyroid tissue in control and chemical-exposed fish after 21 days. Panel A is a scheme (Photoshop rendered of a low magnification photograph) of the zebra fish head sections used for thyroid follicle observation (scale bar corresponds to 500 μm). Panels B–D show representative hematoxylin–eosin stained sections (scale bar = 50 μm) for the different experimental groups, control (B), PTU (C) and TCS (D). Note the pink stained colloid (c) in the centre of thyroid follicles, which are distributed in connective tissue surrounding the aorta (a), and lined by thyrocytes (t) evident as a purple layer adjoining the colloid. An inset of a thyroid follicle at higher magnification (scale bar = 20 μm) is shown for each group in the respective panel. Lower panels (E–F) show the results from stereological measurements carried out on thyroid follicles from the experimental groups: mean ± SEM of (E) thyroid follicle internal/external areas and (F) height of 2 thyrocytes per follicle, measured for several follicles/fish (see section 2, Materials and methods), n = 5–6 fish/treatment. Different letters indicate significantly different mean internal (a and b, p < 0.05) or external areas (A and B, p < 0.05) or thyrocyte height (a and b, p < 0.001) between groups. | ||
Representative images of the thyroid histology for each experimental group are shown in Fig. 1B–D. The thyroid tissue in control fish had oval follicles composed of a uniform monolayer of cuboidal thyrocytes and a lumen filled with pink-stained colloid (Fig. 1B). Comparison of the thyroid between control and chemical-exposed groups revealed differences in the number and size of thyroid follicles. Follicle number/section for the experimental groups were 5.1 ± 0.6 for the control group; 8.2 ± 0.9 for TCS and 5.0 ± 0.7 for the PTU group. The TCS group (Fig. 1D) had a significantly (p < 0.01) greater number of follicles and they were also bigger than those in control fish (Fig. 1B). In contrast, the PTU group (Fig. 1C) had a similar number and size of follicles to the control fish. The thyroid follicle epithelium was thinner in both TCS and PTU treated fish compared to the control fish (see insets in Fig. 1B–D) and no colloid vesicles were identified in the thyrocytes.
Stereological analysis of the thyroid (Fig. 1E and F) confirmed these morphological observations. The internal and external area of thyroid follicles from the TCS treated fish were significantly bigger (p < 0.05) than the control and PTU groups (Fig. 1E). In addition, thyrocyte height (p < 0.001) was significantly lower in TCS and PTU-exposed fish compared to the control (Fig. 1F), which suggests the thyroid was less active.
Changes in mRNA expression of genes involved in thyroid hormone synthesis
In order to detail at the molecular level the effects of TCS and PTU exposure on the thyroid and pituitary, the transcription of several genes involved in TH synthesis was analyzed by quantitative PCR. Preliminary RT-PCR analysis of cDNA from whole zebrafish heads confirmed that all the target genes were transcribed in control fish and the sequence of amplified fragments confirmed the specificity of PCR primers.The mean relative transcription of TSH, NIS, Tg, TPO and CtsBa in the experimental groups is presented in Fig. 2. TCS and PTU exposure caused a significant (p < 0.05) up-regulation of pituitary TSH transcripts compared to the control fish, while TCS treated fish also had a significant increase (p < 0.05) in NIS transcript levels. Although the NIS transcript levels in the PTU-treated group are not significantly different from the control, they show a trend to increase and are also not significantly different from the TCS-treated group (Fig. 2). No significant difference in transcript levels of Tg, TPO or CtsBa between control and treated fish were detected.
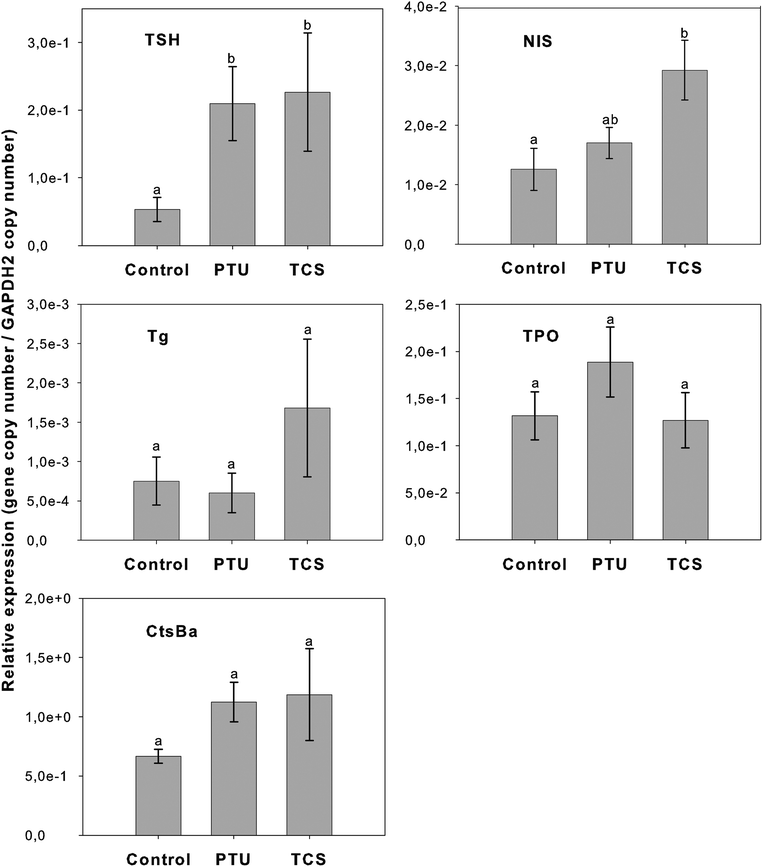 | ||
| Fig. 2 Relative mRNA expression of target genes (Tg, CtsBa, NIS, TSH, TPO) analyzed in whole zebrafish heads exposed to TCS or PTU for 21 days. Values represented are the mean ±SEM of the relative expression (copy number of target gene divided by the copy number of the reference gene, GAPDH-2) for the three experimental groups. Different letters indicate significant statistical differences (p < 0.05) in mRNA expression between groups. | ||
Discussion
Thyroid axis disruption as a consequence of endogenous or exogenous factors may affect TH synthesis, metabolism or transport.3 Modifications in thyroid function are frequently manifested by complementary changes in plasma TH levels and thyroid tissue morphology.33 In mosquito fish exposed to perchlorate, thyroid histopathology was proposed to be the most sensitive biomarker for thyroid endocrine disruption.34 In the present study, exposure to TCS resulted in significant morphological changes in the thyroid, which were indicative of inactivation of thyroid hormone synthesis or release,35,36 although the effects on TH levels was not determined. In contrast, the transcription of two genes involved in TH synthesis, TSH and NIS, was up-regulated. PTU had a similar effect on zebrafish thyrocyte histology although follicle area and number were not significantly increased, and an increase in TSH gene transcription also occurred.The morphological alterations found in the thyroid tissue of TCS (reduced thyrocyte height and increased follicle area) and PTU (reduced thyrocyte height) exposed fish suggests that these chemicals were able to block TH synthesis or release, a notion also supported by colloid accumulation, which probably resulted in a reduction in circulating TH levels.35 The latter is consistent with previous reports of hypothyroidism in response to PTU from fish to mammals30,35,37 and with reports of reduced circulating THs in rats exposed to TCS, at the same dose range used in the present study.21–23 An increase in pituitary TSH synthesis, as observed in the present study, is also generally associated with hypothyroidism, stimulating TH hormone production in the thyroid as part of the negative feedback regulation of the HPT axis.6 The above mentioned factors suggest that a reduction in TH levels probably occurred in response to these treatments in adult zebrafish, and although circulating or total body hormone levels could not be measured in the present study due to the small size of the fish, this will be the subject of analysis in future studies and will be important to better understand the mechanisms causing the thyroid dysfunction induced by TCS.
Assuming that the observed increase in TSH mRNA levels was accompanied by an increase in TSH protein levels, the observed hyperplasia of the thyroid in TCS-treated fish, which had significantly higher numbers of thyroid follicles compared to control fish, may be a response to the TSH stimulation.6 Previous studies of PTU-treated zebrafish revealed decreased circulating T4 accompanied by thyroid hyperplasia expressed as increased follicle number and an increase in TSH immunoreactive cells in the pituitary.38 In the present study despite the significant increase in TSH mRNA levels in TCS-treated fish there was an apparent reduction in the activity of thyroid tissue,35,36 which is suggestive of a direct action for TCS on the thyroid gland to block TH synthesis and/or release. In order to investigate the actions of TCS on the thyroid tissue at the molecular level, the impact of the treatment on the expression of genes associated with TH synthesis were analysed.
The main steps for TH synthesis and accumulation in the thyroid follicle are fairly well established.39 Under the control of pituitary TSH, NIS transports iodide from the blood into thyrocytes, where the enzyme TPO catalyses iodide oxidation, iodination of tyrosine residues in Tg and iodothyronine coupling in the presence of H2O2; a backbone of iodinated Tg is stored in the colloid and subsequently hydrolysed by CtsB and other proteases, releasing T4 into the circulation.40 The tissue specific expression of Tg, NIS, TPO (thyroid) and TSH (pituitary),6 means the zebrafish head is a good proxy for assessment of transcript abundance in the thyroid and pituitary. In the case of CtsB, which has a wider distribution, the measured expression levels may be derived from several tissues in the whole heads and interpretation of these results must be more cautious.
TSH mRNA levels were increased in both TCS and PTU-exposed zebrafish, supporting the hypothesis that TCS and PTU treatments induced hypothyroidism in the present study. TSH up-regulation has previously been observed in fish with low plasma T4 levels41 and in goats and rats with PTU-induced hypothyroidism.30,42 In addition, a significant increase in NIS expression was found in zebrafish exposed to TCS while PTU-exposure led to levels intermediate between the control and TCS groups. This suggests that TCS (and maybe PTU) could influence iodide uptake by thyrocytes and increase its availability for TH synthesis, possibly to overcome the suggested reduction in TH levels. An increase in NIS mRNA and protein levels occurs in mammals in response to TSH stimulation or to low serum iodide concentrations,6,43 and whether the effect of TCS on NIS expression is a direct action at the thyrocytes or is mediated by the change in TSH or iodide levels is not known. PTU exposure was recently shown to cause an increase in both mRNA and protein NIS levels in rat thyroid cells, but the induced protein was smaller and had a different intracellular localization than that induced by TSH,44 resulting in a weaker induction of iodide uptake. It will be interesting to investigate if similar effects occur in the response of fish thyroid to PTU or TCS.
In addition to increasing NIS mRNA levels, high TSH concentrations can also induce an increase in TPO, CtsB and Tg transcript levels in human and rat thyrocyte cultures,45,46 although these effects have not yet been confirmed in fish.47 In the present study, TPO transcript abundance was not significantly changed and the high individual variation meant the increase in Tg observed in the TCS group and CtsBa in the PTU and TCS groups was not statistically significant, which may partly be a consequence of the lack of control over the intake of ration by individual zebrafish. Future analysis using a higher number of individuals and a series of earlier time-frames would be beneficial to further detail the gene and protein responses to these chemicals.
Fig. 3 summarizes the effects of TCS detected in the present study and suggests that the thyroid is not affected in a conventional way. The reduction of TH levels and increase in TSH as a consequence of negative feedback on the HPT axis does not lead to thyroid histology indicative of hyperstimulation, as previously described for thyroid disrupters and goitrogens.2,38 However, the thyroid axis involves many elements and its disruption can occur at multiple levels,2,3 presumably resulting in different patterns of disruption by exogenous compounds. Apparently antagonistic effects have also been detected for other environmental contaminants, and include inactivation of the thyroid tissue despite elevated TSH levels48 or thyroid histology indicative of hyperstimulation despite decreased TSH mRNA.29 Such contradictory observations have been proposed to result from direct actions of agents on the thyroid or on peripheral organs rather than via a direct HPT axis effect.
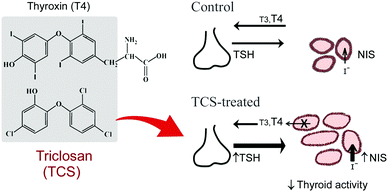 | ||
| Fig. 3 Scheme summarising the effects of triclosan on the zebrafish thyroid axis. In normal (“control”) fish, thyroid-stimulating hormone β subunit (TSH) released from the pituitary stimulates iodide uptake (via the sodium–iodide symporter, NIS) and thyroid hormone (T3, T4) synthesis and release from the thyroid follicles (represented in the figure as a monolayer of cuboidal epithelial cells, the thyrocytes, surrounding a lumen filled with colloid where the thyroid hormone precursor iodinated thyroglobulin is accumulated). TSH pituitary production is also regulated by T3 and T4 levels as part of the negative feedback regulation of the HPT axis. The ubiquitous aquatic contaminant triclosan (TCS), a halogenated biphenyl ether that shares structural similarity with thyroxine (T4),9,21 caused several modifications in the thyroid axis of adult zebrafish: (1) a reduction in epithelial cell height and increase in the size of follicles (replete with colloid), which are indicative of an inactivation of the thyroid tissue; (2) an increase in transcript abundance of pituitary TSH and thyroid tissue NIS, and thyroid tissue hyperplasia (increased number of follicles). The mechanism by which TCS caused thyroid tissue inactivation remains to be elucidated but some hypotheses are presented in the discussion. | ||
In the present study, thyroid histology and gene expression analysis of the TCS treated group suggests there is low hormone production (thyrocytes have a flat epithelium and lack colloid vesicles) despite an increase in pituitary TSH transcripts and thyroid hyperplasia (with increased follicle number and colloid accumulation). This appears similar to colloid goiters (hyperplasia with colloid accumulation, decrease in epithelial cell height and thyroid activation index), described in mammals in response to chemicals or to TSH or iodine excess, which appear to result from perturbations in the balance between colloid accumulation and reabsorption by a still not fully understood mechanisms.48
The present scenario of TCS-detected effects leads us to hypothesise that there is a failure in the process by which Tg acts as the substrate for tyrosine iodination and subsequent hormone production in the zebrafish thyroid tissue. This failure may arise because (a) TCS although not affecting TPO transcription may affect TPO enzyme activity and in this way block TH production, as previously described for PTU;49 or (b) may affect the expression of thyrocyte apical Duox NADPH oxidases and modify production of H2O2 essential for iodination of Tg,50 and thus inhibit hormone production. Further studies will be essential to establish the exact mechanism by which TCS modifies thyroid activity.
The anti-thyroid compound PTU had similar effects on thyroid histology and gene expression to TCS, although with an apparently lower magnitude (no signs of hyperplasia, only mild increase in NIS transcript levels), maybe because of the relatively low dose used in comparison to TCS. The general similarity in the effect of PTU and TCS suggests they may have similar routes of action in thyroid tissue inactivation. In mammals PTU inhibits TH synthesis by interfering with TPO catalysed Tg iodination28,49 and a good correlation exists between protein levels or activity and TPO mRNA abundance,51,52 but no information is available about the effects of PTU on TPO expression or activity in fish and future studies will be relevant. The differences in the effect of PTU on the fish thyroid between the present and previous studies29,37,38,53 may result from differences in the dose, treatment duration and route of administration as well as species sensitivity or feeding rate and makes direct comparisons difficult. For example, exposure to adult zebrafish via the water (3–5 weeks, 1–100 mg l−1) caused histological changes indicative of thyroid activation, which were PTU-concentration and time dependent38,53 and future studies should compare the impact of different times and doses of dietary and water PTU administration to clarify these differences.
The present short-term (21 days exposure) study indicates that high doses of TCS (100 μg g−1 fish per day) can act directly on the thyroid axis in adult zebra fish, while the impact of environmentally relevant levels remains to be established. Nonetheless TCS is a widespread contaminant in aquatic systems and has been found at concentrations as high as 2.3 μg l−1 in streams and rivers and 26.8 μg l−1 in sewage effluents. Even higher levels were found in activated sludges (up to 15600 μg kg−1) or in aquatic sediments (up to 1329 μg kg−1), where TCS and its derivatives appear to accumulate and persist for extended periods of time (reviewed in ref. 9,11,12). Although TCS concentrations found in water at most sites do not usually exceed the values shown to affect fish (between 15 and 290 μg l−1 for chronic toxicity, 20 to 100 μg l−1 for endocrine-disrupting effects)9,11,12,18 this does not contemplate the impact of TCS uptake from contaminated sediments, sludges and aquatic organisms in which it accumulates.11,12,16,17 For instance, TCS and its metabolite methyl TCS bioaccumulate in algae, a primary food source for many aquatic species, reaching values as high as 400 μg kg−1.9 Moreover, it is well documented that TCS and methyl TCS bioaccumulate in fish,9,11,14,54–56 with up to 120000 μg kg−1 TCS detected in the bile fluid of several fish species and up to 3.4 and 10 μg kg−1 in muscle or plasma, respectively, and thus life-long exposure is likely to result in levels appreciably higher than those in the environment.11,12 In addition, in the environment TCS may degrade into many product derivatives, some of which are more toxic and persistent than TCS.9,11 It will be important in the future to evaluate the impact of TCS and its derivatives on the thyroid axis at different stages of the lifecycle and after long term exposure to environmentally relevant concentrations of TCS.
Conclusions
The present study showed for the first time to our knowledge that TCS can modify the thyroid axis in fish, as indicated by both histological and molecular markers in adult zebrafish, which suggest that the TCS toxic effects previously reported in fish embryos, larvae and adults could be, at least in part, through its effect on the thyroid system. In particular, increase in follicle number and area and reduction in thyrocyte height were detected together with up-regulation of TSH and NIS genes which are suggestive of hypothyroidism due to an inhibition in the TH synthesis process.Thus, TCS appear to affect the thyroid axis at several levels, including the regulation by pituitary TSH, iodine uptake and thyroid hormone synthesis, while its impact at other points (expression or activity of TSH receptors, TH receptors and transporting proteins, enzymes responsible for peripheral conversion or inactivation of THs, etc.) remain to be explored.
These results establish the basis for future studies to better characterize the mode of action of TCS on the thyroid axis of adults and early-life stages of fish, which will be of great importance given, (1) the key role of the thyroid axis to fish development and survival and (2) the significant lifelong exposure that wild fish can experience to this widespread environmental contaminant, through multiple routes including bioaccumulation. From the perspective of risk assessment, further studies on fish, which are one of the primary risk groups for EDCs,57 could serve to identify and test some of the effects at early endpoints for the monitoring and risk assessment of environmental TCS contamination. Small fish species such as the zebrafish, which ally many technical advantages to availability of molecular tools, are useful for these kind of studies and have previously been proposed as general vertebrate toxicity model species and as ecotoxicological sentinel species for EDC environmental risk assessment.57,58
Moreover, taking into consideration the relatively high conservation of the thyroid axis between humans and fish58 and the ubiquitous exposure of humans to TCS in consumer products or indirectly by consumption of TCS-contaminated food,10,11,59,60 it seems likely that TCS may also affect the thyroid in humans. Although a small short-term study detected no effects on thyroid homeostasis61 of brushing with TCS-containing dentifrice, it will be pertinent to determine if modifications in the thyroid occur with long-term, multiple exposure routes to TCS in humans.9
Acknowledgements
We thank Dora Venda and Isabel Penisga for Photoshop rendered schematics. This work was funded by the Portuguese Science Foundation through Pluriannual funding and grant (BPD/25247/2005) to PP. The funding organization was not directly involved in the research or article preparation.References
- R. H. Waring and R. M. Harris, Mol. Cell. Endocrinol., 2005, 244, 2–9 CrossRef CAS.
- S. B. Brown, B. A. Adams, D. G. Cyr and J. G. Eales, Environ. Toxicol. Chem., 2004, 23, 1680–1701 CrossRef CAS.
- M. Boas, U. Feldt-Rasmussen, N. E. Skakkebaek and K. M. Main, Eur. J. Endocrinol., 2006, 154, 599–611 CrossRef CAS.
- K. M. Crofton, Int. J. Androl., 2008, 31, 209–223 CrossRef CAS.
- D. M. Power, L. Llewellyn, M. Faustino, M. A. Nowell, B. T. Bjornsson, I. E. Einarsdottir, A. V. Canario and G. E. Sweeney, Comp. Biochem. Physiol., Part C: Toxicol. Pharmacol., 2001, 130, 447–459 CrossRef CAS.
- R. T. Zoeller, S. W. Tan and R. W. Tyl, Crit. Rev. Toxicol., 2007, 37, 11–53 CrossRef CAS.
- M. L. Blanton and J. L. Specker, Crit. Rev. Toxicol., 2007, 37, 97–115 CrossRef CAS.
- K. Yamano, Jpn. Agric. Res. Quart. (JARQ), 2005, 39, 161–168 CAS.
- A. B. Dann and A. Hontela, J. Appl. Toxicol., 2011, 31, 285–311 CrossRef CAS.
- J. L. Fang, R. L. Stingley, F. A. Beland, W. Harrouk, D. L. Lumpkins and P. Howard, J. Environ. Sci. Health, Part C: Environ. Carcinog. Ecotoxicol. Rev., 2010, 28, 147–171 CrossRef CAS.
- G. Bedoux, B. Roig, O. Thomas, V. Dupont and B. Le Bot, Environ. Sci. Pollut. Res., 2012, 19, 1044–1065 CrossRef CAS.
- T. E. Chalew and R. U. Halden, J. Am. Water Resour. Assoc., 2009, 45, 4–13 CrossRef CAS.
- K. Valters, H. Li, M. Alaee, I. D'Sa, G. Marsh, A. Bergman and R. J. Letcher, Environ. Sci. Technol., 2005, 39, 5612–5619 CrossRef CAS.
- M. E. Balmer, T. Poiger, C. Droz, K. Romanin, P. A. Bergqvist, M. D. Muller and H. R. Buser, Environ. Sci. Technol., 2004, 38, 390–395 CrossRef CAS.
- P. A. Fair, H. B. Lee, J. Adams, C. Darling, G. Pacepavicius, M. Alaee, G. D. Bossart, N. Henry and D. Muir, Environ. Pollut., 2009, 157, 2248–2254 CrossRef CAS.
- G. Gatidou, E. Vassalou and N. S. Thomaidis, Mar. Pollut. Bull., 2010, 60, 2111–2116 CrossRef CAS.
- M. A. Coogan and T. W. La Point, Environ. Toxicol. Chem., 2008, 27, 1788–1793 CrossRef CAS.
- M. Capdevielle, R. Van Egmond, M. Whelan, D. Versteeg, M. Hofmann-Kamensky, J. Inauen, V. Cunningham and D. Woltering, Integr. Environ. Assess. Manage., 2008, 4, 15–23 CrossRef CAS.
- R. Oliveira, I. Domingues, C. K. Grisolia and A. Soares, Environ. Sci. Pollut. Res., 2009, 16, 679–688 CrossRef CAS.
- M. Nassef, S. Matsumoto, M. Seki, F. Khalil, I. J. Kang, Y. Shimasaki, Y. Oshima and T. Honjo, Chemosphere, 2010, 80, 1095–1100 CrossRef CAS.
- K. M. Crofton, K. B. Paul, D. M. J. and J. M. Hedge, Environ. Toxicol. Pharmacol., 2007, 24, 194–197 CrossRef CAS.
- L. M. Zorrilla, E. K. Gibson, S. C. Jeffay, K. M. Crofton, W. R. Setzer, R. L. Cooper and T. E. Stoker, Toxicol. Sci., 2009, 107, 56–64 CrossRef CAS.
- K. B. Paul, J. M. Hedge, M. J. DeVito and K. M. Crofton, Toxicol. Sci., 2010, 113, 367–379 CrossRef CAS.
- D. J. Fort, M. B. Mathis, W. Hanson, C. E. Fort, L. T. Navarro, R. Peter, C. Buche, S. Unger, S. Pawlowski and J. R. Plautz, Toxicol. Sci., 2011, 121, 292–302 CrossRef CAS.
- C. Helbing, Toxicol. Sci., 2010, 119, 417–418 CrossRef.
- A. Hinther, C. M. Bromba, J. E. Wulff and C. C. Helbing, Environ. Sci. Technol., 2011, 45, 5395–5402 CrossRef CAS.
- N. Veldhoen, R. C. Skirrow, H. Osachoff, H. Wigmore, D. J. Clapson, M. P. Gunderson, G. Van Aggelen and C. C. Helbing, Aquat. Toxicol., 2006, 80, 217–227 CrossRef CAS.
- D. S. Cooper, N. Engl. J. Med., 2005, 352, 905–917 CrossRef CAS.
- I. Morgado, M. A. Campinho, R. Costa, R. Jacinto and D. M. Power, Aquat. Toxicol., 2009, 92, 271–280 CrossRef CAS.
- D. Villar, S. M. Rhind, P. Dicks, S. R. McMillen, F. Nicol and J. R. Arthur, Small Ruminant Res., 1998, 29, 317–324 CrossRef.
- P. I. Pinto, H. Matsumura, M. A. Thorne, D. M. Power, R. Terauchi, R. Reinhardt and A. V. Canario, BMC Genomics, 2010, 11, 476 CrossRef.
- C. J. Martyniuk, K. J. Kroll, W. F. Porak, C. Steward, H. J. Grier and N. D. Denslow, Gen. Comp. Endocrinol., 2009, 163, 306–317 CrossRef CAS.
- J. F. Leatherland, Guelph Ichthyol Rev, 1994, 2, 1–67 Search PubMed.
- C. M. Bradford, J. Rinchard, J. A. Carr and C. Theodorakis, Environ. Sci. Technol., 2005, 39, 5190–5195 CrossRef CAS.
- J. A. Thomas and H. D. Colby, Endocrine Toxicology, Raven Press, New York, 2nd edn, 1997 Search PubMed.
- S. Hallgren and P. O. Darnerud, Toxicology, 2002, 177, 227–243 CrossRef CAS.
- O. A. Elsalini and K. B. Rohr, Dev. Genes Evol., 2003, 212, 593–598 CAS.
- F. Schmidt and T. Braunbeck, J. Thyroid Res., 2011, 2011, 376243 Search PubMed.
- S. Melmed and P. M. Conn, Endocrinology: Basic and Clinical Principles, Humana Press, Totowa, NJ, 2nd edn, 2005 Search PubMed.
- B. Friedrichs, C. Tepel, T. Reinheckel, J. Deussing, K. von Figura, V. Herzog, C. Peters, P. Saftig and K. Brix, J. Clin. Invest., 2003, 111, 1733–1745 CAS.
- B. Pradet-Balade, C. Burel, S. Dufour, T. Boujard, S. J. Kaushik, B. Quérat and G. Boeuf, Fish Physiol. Biochem., 1999, 20, 193–199 CrossRef CAS.
- A. Hood, Y. P. Liu, V. H. Gattone 2nd and C. D. Klaassen, Toxicol. Sci., 1999, 49, 263–271 CrossRef CAS.
- A. Bizhanova and P. Kopp, Endocrinology, 2009, 150, 1084–1090 CrossRef CAS.
- S. Mariko, T. Akama, A. Kawashima, H. Nakamura, T. Hara, K. Tanigawa, H. Wu, A. Yoshihara, Y. Ishido, N. Hiroi, G. Yoshino, L. D. Kohn, N. Ishii and K. Suzuki, Thyroid, 2012, 22(8), 844–852 CrossRef.
- N. Caraccio, R. Giannini, S. Cuccato, P. Faviana, P. Berti, D. Galleri, A. Dardano, F. Basolo, E. Ferrannini and F. Monzani, J. Clin. Endocrinol. Metab., 2005, 90, 1156–1162 CrossRef CAS.
- I. D. Phillips, E. G. Black, M. C. Sheppard and K. Docherty, J. Mol. Endocrinol., 1989, 2, 207–212 CrossRef CAS.
- D. S. MacKenzie, R. A. Jones and T. C. Miller, Gen. Comp. Endocrinol., 2009, 161, 83–89 CrossRef CAS.
- O. Tebourbi, D. Hallegue, M. T. Yacoubi, M. Sakly and K. B. Rhouma, Environ. Toxicol. Pharmacol., 2010, 29, 271–279 CrossRef CAS.
- B. Davidson, M. Soodak, J. T. Neary, H. V. Strout, J. D. Kieffer, H. Mover and F. Maloof, Endocrinology, 1978, 103, 871–882 CrossRef CAS.
- C. Massart, C. Hoste, A. Virion, J. Ruf, J. E. Dumont and J. Van Sande, Mol. Cell. Endocrinol., 2011, 343, 32–44 CrossRef CAS.
- T. Tanaka, K. Umeki, I. Yamamoto, S. Sugiyama, S. Noguchi and S. Ohtaki, J. Pathol., 1996, 179, 89–94 CrossRef CAS.
- M. Sugawara, Y. Sugawara and K. Wen, Thyroid, 1999, 9, 513–518 CrossRef CAS.
- L. T. van der Ven, E. J. van den Brandhof, J. H. Vos, D. M. Power and P. W. Wester, Environ. Sci. Technol., 2006, 40, 74–81 CrossRef CAS.
- D. R. Orvos, D. J. Versteeg, J. Inauen, M. Capdevielle, A. Rothenstein and V. Cunningham, Environ. Toxicol. Chem., 2002, 21, 1338–1349 CrossRef CAS.
- C. J. Houtman, A. M. Van Oostveen, A. Brouwer, M. H. Lamoree and J. Legler, Environ. Sci. Technol., 2004, 38, 6415–6423 CrossRef CAS.
- M. Adolfsson-Erici, M. Pettersson, J. Parkkonen and J. Sturve, Chemosphere, 2002, 46, 1485–1489 CrossRef CAS.
- S. Scholz and I. Mayer, Mol. Cell. Endocrinol., 2008, 293, 57–70 CrossRef CAS.
- H. Segner, Comp. Biochem. Physiol. C Toxicol. Pharmacol., 2009, 149, 187–195 CrossRef.
- M. A. Mottaleb, S. Usenko, J. G. O'Donnell, A. J. Ramirez, B. W. Brooks and C. K. Chambliss, J. Chromatogr., 2009, 1216, 815–823 CrossRef CAS.
- P. Canosa, I. Rodriguez, E. Rubi, M. Ramil and R. Cela, J. Chromatogr., 2008, 1188, 132–139 CrossRef CAS.
- M. Allmyr, G. Panagiotidis, E. Sparve, U. Diczfalusy and G. Sandborgh-Englund, Basic Clin. Pharmacol. Toxicol., 2009, 105, 339–344 CrossRef CAS.
Footnote |
| † These authors contributed equally to this work. |
| This journal is © The Royal Society of Chemistry 2013 |