Transparent luminescent silicone nanocomposites filled with bimodal PDMS-brush-grafted CdSe quantum dots†
Peng
Tao
*,
Ying
Li
,
Richard W.
Siegel
and
Linda S.
Schadler
*
Department of Materials Science and Engineering and Rensselaer Nanotechnology Center, Rensselaer Polytechnic Institute, Troy, NY 12180, USA. E-mail: taop1985@gmail.com; schadl@rpi.edu
First published on 11th October 2012
Abstract
We report a simple and effective approach to disperse CdSe quantum dots (QDs) into a high molecular weight silicone matrix and prepare highly transparent luminescent CdSe–silicone nanocomposites. The CdSe QDs were synthesized via a room temperature injection method and were subsequently grafted with organophosphate-terminated poly(dimethyl siloxane) (PDMS) brushes. It was found that the bimodal PDMS-brush-grafted QDs demonstrate a homogeneous dispersion within the high molecular weight silicone matrix, enabling the preparation of thick transparent CdSe–silicone nanocomposites. The good dispersion also benefits the uniformity and long-term stability of the photoluminescence of the CdSe–silicone nanocomposites against thermal annealing. The prepared CdSe–silicone nanocomposites would have potential applications as color-conversion materials on light emitting diodes. This dispersing strategy could be broadly applicable and provides valuable guidelines for dispersing other functional nanoparticles in silicones.
1. Introduction
Semiconductor quantum dots (QDs) have drawn great attention owing to their unique features including broad absorption, size-tunable narrow emission, high resistance to photo-oxidation and little scattering effect.1–5 QDs have been pursued as one of the most promising candidates to replace the conventional phosphor materials currently used on light emitting diodes (LEDs).5 Rapid progress in wet chemistry synthesis of high quality QDs on a large scale has enabled QD polymer composites as color conversion materials for LEDs.6–8 The application as color-conversion materials on LEDs requires randomly dispersed QDs in LED encapsulant epoxy or silicone matrices.4 However, in most prior work,2–4,7,8 the as-synthesized QDs were directly mixed with the polymer, forming large agglomerates. The dispersion of QDs not only affects optical transparency of the resultant nanocomposites, but also photoluminescent properties and device performances. For example, the aggregation of CdSe–CdS–ZnS core–multi-shell nanophosphors within epoxy resins resulted in a decreased power efficiency of QD-LEDs.7 Significantly aggregated QDs in a silicone encapsulant have been found to cause re-absorption and scattering, leading to a decrease in external quantum efficiency of LEDs.3 The dispersion of CdSe QDs in epoxy was improved through surface modifications via a ligand exchange process with moderate success.9 Compared with epoxies, silicones are often preferred as encapsulant materials for high-brightness LEDs due to their better thermo-mechanical stabilities. However, the poorer compatibility between QDs and silicones and the deterioration of the optical properties of the QDs once they are combined with the polymers have severely limited the application of QDs–silicone nanocomposites on LEDs.10,11To improve the dispersion of inorganic QDs within organic polymer matrices, great efforts have been made to modify the surface of QDs with organic ligands followed by in situ polymerization of the monomers within the solvents.12–14 However, depletion flocculation is frequently triggered during the polymerization process. Moreover, this method is usually applicable to limited types of polymers with vinyl monomers such as polystyrene and poly(methyl methacrylate),12,13 but not practical for many other important optoelectronic packaging polymer systems. By contrast, the ex situ method is more attractive because of the added flexibility in choosing the nanofiller and polymer matrix, as well as the easy application of the resultant nanocomposites on devices. It has been shown that grafting polymer chains that have the same, or similar, chemical composition as the matrix polymers onto nanoparticle surfaces can effectively screen the particle–particle attraction and improve the dispersion of nanofillers within polymer matrices.15,16 Previously, we developed highly transparent epoxy based optical nanocomposites by grafting nanoparticles with epoxy compatible poly(glycidyl methacrylate) mono-modal brushes using a combination of phosphate ligand engineering and a Cu(I)-catalyzed azide–alkyne “click” reaction.17,18 However, the Cu(I)-catalyzed “click” chemistry has been reported to lead to a dramatic decrease in photoluminescence (PL) of CdSe QDs due to the presence of residual Cu(I) ions.19 Unlike the small molecular weight epoxy resins, LED encapsulant silicones typically have a high molecular weight, which poses additional challenges in achieving good dispersion of the nanofillers with conventional mono-modal grafted chain design. The mono-modal chain grafted particles have been shown to have a narrow dispersion window and tend to suffer from autophobic dewetting within high molecular weight polymer matrices.20 Apparently, a simple and versatile strategy to disperse QDs within high molecular weight silicones without disturbing their photoluminescent properties is needed.
In this work, we report on the preparation of thick (3 mm) transparent CdSe–silicone nanocomposites realized by grafting phosphate-terminated poly(dimethyl siloxane) (PDMS) chains onto CdSe QD surfaces and using the PDMS-grafted QDs as fillers. We compared the dispersion of mono-modal and bimodal PDMS-brush-grafted CdSe QDs within a commercial LED encapsulant silicone matrix. We observe that, within the high molecular weight commercial silicone matrices, only the CdSe QDs grafted with bimodal (bidisperse in chain length) PDMS chains show homogeneous dispersion of individual particles. The good dispersion demonstrates the advantage of the bimodal grafted polymer brush design, where the inner dense short brushes can effectively screen the particle–particle attraction, and the outer sparse long brushes can favor the penetration and wetting of long matrix polymer chains. We also demonstrate that the good dispersion of bimodal PDMS-brush-grafted QDs not only benefits the optical transparency but also the long-term stability of the PL of the CdSe–silicone nanocomposites.
2. Experimental
2.1 Materials
Selenium powder (100 mesh, 99.99%), sodium sulfite, oleic acid (90%), sodium hydroxide, cadmium acetate dehydrate (95%), anhydrous triethylamine and phosphorus(V) oxychloride (99.99%) were purchased from Sigma Aldrich. Monocarbinol terminated PDMS (MCR-C22) and silanol terminated PDMS (DMS-S21) were purchased from Gelest. Commercial silicones (Sylgard 184, Mw estimated to be 100 kg mol−1) were purchased from Dow Corning.2.2 Synthesis of CdSe QDs
CdSe QDs were synthesized based on the room temperature injection method developed by Liu et al.21 In a typical synthesis, Cd(Ac)2·2H2O (0.133 g) was dissolved in deionized water (5 mL) and added to the mixture of ethanol (10 mL) and oleic acid (5 mL). NaOH (0.4 g) was dissolved in deionized water (5 mL) and added to the mixture solution under stirring. The selenium source was prepared by refluxing selenium powder (5 mmol) and Na2SO3 (6 mmol) in distilled water (50 mL) for 5 h. The freshly prepared aqueous solution of Na2SeSO3 (5 mL) was added and the color of the solution changed from milky white to yellow within a few seconds. After stirring for 2 min, this mixed solution was transferred into a 45 mL pressure vessel (Parr), sealed and put into an oven at 180 °C for 2 h. After the reaction, the vessel was cooled down with tap water. The CdSe QDs were washed with ethanol, recovered by centrifugation and dispersed with chloroform.2.3 Synthesis of PDMS-phosphate
In a typical synthesis, mono-carbinol terminated PDMS (1 mmol, MCR-C22, Gelest) or silanol terminated PDMS (1 mmol, DMS-S21, Gelest) was dissolved in anhydrous THF (80 mL) in a 250 mL round-bottom flask. Anhydrous triethylamine (0.9 mL, 6.35 mmol) was added into the flask and the mixture was cooled to 0 °C with an ice bath. The solution was stirred with a magnetic stir bar. POCl3 (0.6 mL, 6.35 mmol) was added dropwise into the mixture. The reaction went for 48 h and was quenched by adding DI water (40 mL). The solution was extracted with methylene chloride, dried with sodium sulfate overnight, and filtered. The final product was obtained after removal of the solvent by a rotoevaporator and under vacuum overnight.2.4 Surface modification of CdSe QDs
After the synthesis, the CdSe QDs were dispersible in chloroform by virtue of the oleic acid capping ligands. In a typical modification process, the PDMS-phosphate was added into the transparent dispersion of CdSe QDs in chloroform at a 1![[thin space (1/6-em)]](https://www.rsc.org/images/entities/char_2009.gif) :1 weight ratio and refluxed at 75 °C for 24 h. The bimodal-PDMS grafted QDs were prepared by first attachment of the long PDMS-phosphate (36 kg mol−1) followed by grafting of the short chains (10 kg mol−1) in the second step. Excessive PDMS-phosphate was removed by repeated washing with methanol followed by centrifugation. The PDMS-modified CdSe QDs were readily re-dispersible in chloroform.
:1 weight ratio and refluxed at 75 °C for 24 h. The bimodal-PDMS grafted QDs were prepared by first attachment of the long PDMS-phosphate (36 kg mol−1) followed by grafting of the short chains (10 kg mol−1) in the second step. Excessive PDMS-phosphate was removed by repeated washing with methanol followed by centrifugation. The PDMS-modified CdSe QDs were readily re-dispersible in chloroform.
2.5 Preparation of CdSe QD–silicone nanocomposites
PDMS-modified CdSe QD dispersion in chloroform was added into silicone resin (Dow Corning Sylgard 184) and homogeneously mixed during stirring. After the chloroform solvent was evaporated under vacuum, silicone kit part B (cross-linking agent) was added at a weight ratio of 1:10 to the base resin. The mixture was applied onto glass slides or within a glass mold. The nanocomposites were finally cured at 150 °C for 30 min in an Isotemp oven.
2.6 Characterization and measurements
The CdSe QDs were characterized by a PANalytical X'Pert diffractometer and a JEOL-2010 transmission electron microscope (TEM). The synthesized CdSe QD solution was dripped onto a carbon coated copper grid for TEM observation. The absorption spectrum and photoluminescence emission of the synthesized and modified QD dispersion in quartz curettes were recorded by a Perkin–Elmer Lambda 950 UV-vis spectrometer and a Hitachi F-4500 fluorescence spectrometer respectively. FTIR spectra were obtained on a Perkin Elmer Spectrum One FT-IR Spectrophotometer scanning from 500 to 4000 cm−1 with a resolution of 4 cm−1 for 10 scans. Thermal gravimetric analysis (TGA) was done on a Perkin Elmer Series 7 instrument. CdSe–silicone nanocomposite TEM samples were prepared by embedding nanocomposites into an epoxy matrix, cooling with liquid nitrogen, and cutting to 50 nm slices at −120 °C using an RMC PowerTome cryostat-microtome. The CdSe–silicone nanocomposite samples applied on glass slides were used to measure optical transparency (UV-vis, Perkin–Elmer Lambda 950) and luminescence spectra (F-4500, Hitachi).3. Results and discussion
3.1 Characterization of as-synthesized CdSe QDs
CdSe QDs were synthesized through a simple, mild and environmentally benign low temperature injection technique.21Fig. 1a displays the XRD pattern and TEM image of the as-synthesized CdSe QDs. All of the detectable diffraction peaks can be indexed to the zinc-blende structure (JCPDS card #: 19-0191). Based on the observed broadening of the XRD diffraction pattern (111) peak, the average particle size was estimated to be 6.2 nm, which is consistent with the size based on TEM observations 6.0 ± 0.5 nm. The synthesized CdSe QDs were capped with oleic acid and were dispersible in nonpolar solvents such as hexane and chloroform as shown by the transparent dispersion in the inset photograph. The UV-vis absorption spectrum and the corresponding PL spectrum of the synthesized CdSe QD dispersion in Fig. 1b showed an emission peak center at 601 nm with a full width at half maximum (FWHM) of 60 nm. The relatively broad emission peak can be attributed to the broad particle size distribution evidenced by the TEM image. During the QD synthesis process, the reaction rate is very fast. The growth of CdSe nanocrystals was kinetically terminated by cooling the reaction pressure vessel with tap water, resulting in QDs with a relatively broad size distribution.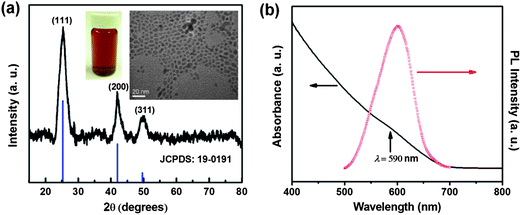 | ||
| Fig. 1 (a) XRD pattern and TEM image of the as-synthesized CdSe QDs (the inset shows a transparent dispersion of CdSe QDs within hexane); (b) absorbance and photoluminescence spectra of CdSe QD dispersion within chloroform with an excitation wavelength at 365 nm. | ||
3.2 Grafting PDMS chain to CdSe QDs
As shown in Scheme 1, the synthesized CdSe QDs were grafted with both mono-modal and bimodal PDMS-phosphate chains. PDMS-phosphate polymer chains were prepared through a single step reaction between phosphorus oxychloride and reactive PDMS chains with a hydroxyl end group. The bimodal PDMS-grafted QDs were prepared by first attaching the long PDMS-phosphate (36 kg mol−1) followed by grafting of the short chains (10 kg mol−1). Phosphonic acid has been shown to have a stronger binding strength on CdSe than oleic acid.22 The grafting process was driven by the strong enthalpic binding of the phosphate group, displacing the weakly bound carboxylic acid groups derived from the oleic acid capping agent. Given that the grafting process was limited by the diffusion and binding rate of the long PDMS-phosphate chains, long PDMS chains were grafted prior to the subsequent attachment of short chains. Refluxing at high temperature also promoted the ligand exchange of oleic acid with PDMS-phosphate.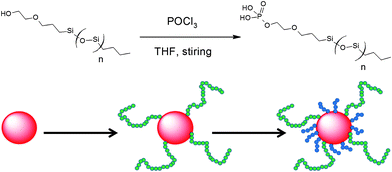 | ||
| Scheme 1 Synthesis of phosphate-terminated PDMS chains and schematic illustration of the preparation of bimodal PDMS-grafted CdSe QDs via a two-step reaction with initial attachment of the long chain phosphate-terminated PDMS followed by grafting of the short PDMS chains in the second step. | ||
In the FTIR spectrum of the as-synthesized QDs (see Fig. 2), the strong peaks at 2926 and 2847 cm−1 correspond to the intense antisymmetric and symmetric C–H stretching vibrations of the CH2 group. No obvious stretching band around 1700 cm−1 was observed on the original QDs, indicating that the free oleic acid was removed during the particle washing process and the carboxylic groups are bound to the surface of the particles. The peaks at 1552 and 1438 cm−1 can be assigned to the COO− antisymmetric and symmetric vibrations of carboxylate anions complexed with surface Cd centers.23 No obvious differences in the FTIR spectra between PDMS–OH and PDMS-phosphate were observed. This is probably because the phosphorus characteristic peaks in the finger print region were masked by the strong stretching vibration bands of Si–O and Si–CH3 from the PDMS.24 However, the 31P NMR spectrum in Fig. S1† proved the successful conversion from PDMS–OH to PDMS-phosphate. After grafting PDMS chains, the modified QDs showed strong characteristic Si–O stretching vibrations at 1100–1000 cm−1.
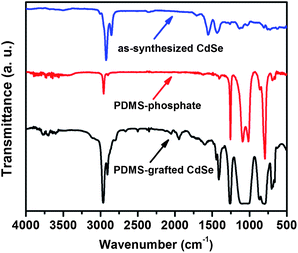 | ||
| Fig. 2 FTIR spectra of as-synthesized CdSe QDs capped with oleic acid, phosphate-terminated PDMS and PDMS-grafted CdSe QDs. | ||
Fig. S2 in the ESI† shows that, based on TGA measurements, approximately 35% weight loss in the as-synthesized particles was due to the loss of the surface capping oleic acid and surface adsorbed water. The increase in weight loss for the PDMS-modified CdSe QDs presents further evidence for successful grafting of PDMS-phosphate chains. Based on the weight loss determined by TGA, the grafting density of mono-modal PDMS chains on the QD surfaces was estimated to be 0.1 and 0.03 chains nm−2 for 10 kg mol−1 and 36 kg mol−1 PDMS chains, respectively. The decrease of grafting density with increased grafted chain length demonstrates the self-limiting characteristic of the simple “grafting to” process.25 It becomes more difficult for the longer PDMS-phosphate chains to diffuse and attach to the QD surfaces. For the QDs modified with bimodal PDMS chains, after grafting the long chains (36 kg mol−1) with a grafting density of 0.03 chains nm−2, the short chains with a grafting density of 0.06 chains nm−2 were attached subsequently. The overall grafting density is very close to that of the mono-modal short chains, meaning that the initial attachment of long PDMS chains did not prevent the further grafting of short PDMS chains.
The bimodal PDMS-grafted QDs were redispersed in chloroform and showed the same emission peak as the as-synthesized QDs (Fig. S3†). This indicates that the crystal size of the QDs did not increase during the grafting reaction since the reaction was carried out at a relatively low temperature (∼70 °C). PL measurements of the grafted QDs showed a ∼50% residual quantum yield after grafting of the bimodal PDMS chains. The decrease in quantum yield can be ascribed to the fact that grafting of PDMS-phosphate chains involves a ligand exchange with the original oleic acid via a thermal refluxing process and thermal quenching may occur when the bare QD surfaces are exposed.26,27
3.3 Dispersion of CdSe QDs in silicone
Although the synthesized QDs were dispersible in the nonpolar solvent, the surface capping ligand (oleic acid) had poor compatibility with silicone resins as evidenced by immediate precipitation upon mixing. The formation of micrometer sized agglomerates of QDs within the silicone matrix can be easily identified with naked eyes (Fig. S4†). As shown in Fig. 3, after grafting with mono-modal PDMS-phosphate chains, the QDs dispersed well in the silicone resin chloroform mixture. However, phase separation occurred when the solvent was removed as shown by the separate clear resin top layer and precipitation of QDs at the bottom of the glass vial. By contrast, the bimodal PDMS-grafted QDs did not aggregate or precipitate. They dispersed well in the silicone and the dispersion was stable after removal of the solvent. Thus, the improved compatibility solved a fundamental and persistent phosphor settling issue, preventing the use of QD–silicone composites as color conversion encapsulants.28 Further evidence of the dispersion stability of the bimodal PDMS-grafted QDs is the high optical transparency of the resultant thick CdSe–silicone nanocomposites, whereas the nanocomposites filled with mono-modal PDMS brush grafted QDs totally lost their transparency as shown by the digital image of the samples in Fig. 3.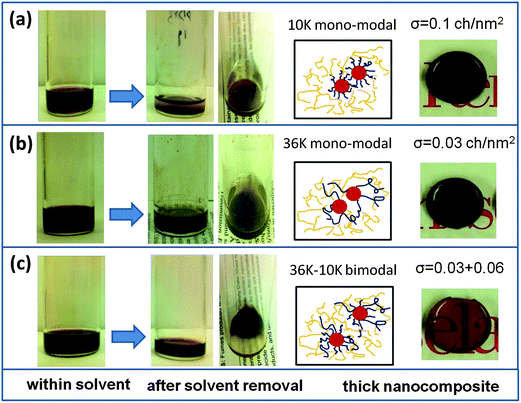 | ||
| Fig. 3 Comparsion of dispersion behavior of mono-modal and bimodal PDMS-grafted CdSe QDs within a silicone matrix: (a) QDs grafted with mono-modal 10 kg mol−1 PDMS; (b) QDs grafted with mono-modal 36 kg mol−1 PDMS; (c) QDs grafted with bimodal PDMS. The inset shows the resultant CdSe–silicone nanocomposite (with a thickness of 3 mm) filled with mono-modal and bimodal PDMS-grafted QDs. | ||
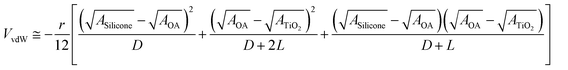
The dispersion state was further examined by transmission electron microscopy (TEM). Fig. 4 shows TEM micrographs of the dispersion of unmodified QDs and QDs grafted with mono-modal and bimodal PDMS chains in a commercial high molecular weight (Mw ∼ 100 kg mol−1) silicone matrix. The unmodified QDs formed sub-micrometer agglomerates. Around the large agglomerates, clusters with an average size of 50 nm were also observed (Fig. 4b and Fig. S5†). Under high magnification, close packing of individual QDs within the large aggregates are easily identified. The mono-modal PDMS-grafted QDs typically formed clusters with a size around 100 nm. By contrast, the bimodal PDMS-grafted QDs showed a homogeneous dispersion within the silicone matrix even at higher loading concentrations.
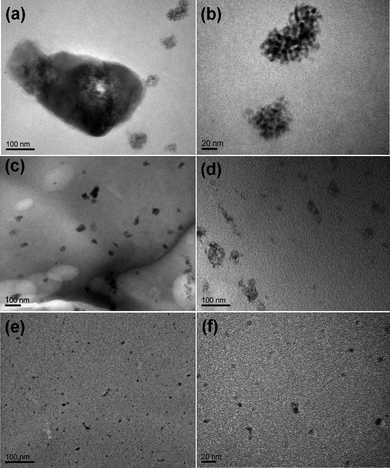 | ||
| Fig. 4 TEM images of CdSe–silicone nanocomposites under low and high magnifications: (a and b) 0.2 wt% unmodified bare CdSe; (c and d) 0.2 wt% CdSe grafted with mono-modal 36 kg mol−1 and 10 kg mol−1 PDMS, respectively; (e and f) 0.4 wt% CdSe grafted with bimodal 36 and 10 kg mol−1 PDMS. | ||
The strong energetic van der Waals attraction between the high refractive index CdSe (n ≈ 2.54)29 QDs and large surface energy mismatch between silicones (∼20 mJ m−2)30 and CdSe (1.15–1.45 J m−2)29 lead to the formation of agglomerates of CdSe QDs within silicones. The van der Waals attraction of oleic acid capped core–shell structured CdSe QDs within silicone medium (Fig. S6†) can be described by eqn (1):31
 | (1) |
 | (2) |
Grafting polymer chains with the same chemical composition as the matrix polymer would screen the QD core attraction, resulting in improved dispersion. Grafting density and the ratio of grafted/matrix chain molecular weight are the two most important parameters in determining the dispersion state of polymer grafted particles within a polymer matrix.16,33,34 For homogenous dispersion within a high molecular weight polymer matrix, the grafted brushes should have an intermediate grafting density, which is large enough to screen the particle surface, but low enough to suppress the attractions between grafted chains, and the brushes should have a length comparable to that of the matrix. The poor dispersion of the mono-modal grafted QDs can be qualitatively explained by not enough surface coverage for the grafted QDs with 36 kg mol−1 brushes and the small ratio of grafted to matrix chain lengths for the grafted QDs with 10 kg mol−1. The compromise between the maximum achievable grafting densities and grafted chain length in the “grafting to” method inevitably results in a narrow window for dispersion of the mono-modal grafted particles in high molecular weight matrices. The good dispersion of the bimodal grafted QDs can be attributed to the combined stabilization contribution from the dense short brushes which prevent direct QD–QD contact, and the sparse long brushes which favor the penetration and entanglement with long matrix chains. A theoretical modeling work from Pryamtisyn et al.35 showed that the dispersion state of grafted particles in the same polymer matrix is determined by the competition between inner particle–particle enthalpic attraction and entropic repulsion associated with the deformation of the grafted chains. The strong Hamaker interactions between the high refractive index CdSe QDs decay rapidly with increasing interparticle distance. Assuming that the grafted inner short PDMS chains (10 kg mol−1) take a random coil conformation and their thickness being the radius of gyration ( ),36 where NPDMS is the number of repeating units for the PDMS brush, the van der Waals attraction between short PDMS-grafted QDs decreased to 1.8 kBT, which is much smaller than the oleic-acid capped QDs. The decreased inner core–core attraction coupled with effective suppression of the autophobic interactions from the longer PDMS brushes leads to good dispersion of the bimodal PDMS-grafted QDs within high molecular weight silicone matrices. It should also be pointed out that the strong curvature effect from the QDs also favors the penetration and wetting of long chain silicone matrix chains into the grafted polymer brushes even though the grafted long PDMS chains (36 kg mol−1) are shorter than the matrix chains (100 kg mol−1).37 In our experiment, it was also found that with the bimodal grafted chain design, in addition to the 10 kg mol−1 inner brush, QDs grafted with the combination of 5 kg mol−1 and 36 kg mol−1 bimodal brush were also dispersible, whereas when the inner brush molecular weight decreased to 1 kg mol−1 it was too short to effectively shield the strong particle–particle attraction. The key to dispersing the bimodal-brush-grafted particles in high molecular weight matrices is the combination of effective screening of inter-particle van der Waals attraction with dense inner brushes and favorable penetration of the long matrix chains with sparse long brushes.38,39
3.4 Optical transparency of CdSe–silicone nanocomposites
The transparency of the neat silicone and QD–silicone nanocomposite samples on glass substrates was characterized by an UV-vis transmittance spectrometer (Fig. 5). The dispersion of the nanofillers plays a vital role in determining the optical transparency loss of the nanocomposites due to scattering. According to the Raleigh scattering law, the scattering loss of transparency for polymer nanocomposites can be described by eqn (3):40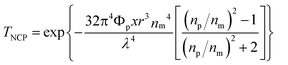 | (3) |
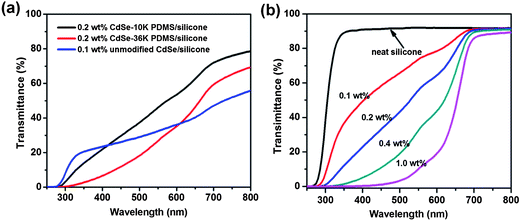 | ||
| Fig. 5 Transmittance spectra of CdSe–silicone nanocomposites with a thickness of 400 μm on a glass substrate filled with: (a) unmodified bare and mono-modal PDMS-grafted CdSe and (b) bimodal PDMS-grafted CdSe. | ||
Fig. 5(b) shows that all the bimodal samples showed almost the same transparency (∼90%) as the neat silicone in the wavelength range of 650–800 nm. Unlike the unmodified and mono-modal grafted counterparts, the transmittance spectra of the bimodal samples are flat, implying the successful suppression of scattering loss, which is wavelength dependent. At wavelengths shorter than 650 nm, the incorporated QDs were excited, and therefore the composites showed an abrupt decrease in transparency. Further increasing the loading concentration, the bimodal grafted QD–silicone sample maintained the same high transparency above the absorption edge and demonstrated stronger absorption and excitation of the light below 650 nm. Theoretical calculations of the transmittance of the nanocomposites filled with homogeneous bimodal-PDMS-brush grafted QDs in Fig. S7† further support the experimental results of the flat transmittance spectra and the homogeneous dispersion shown by TEM images.
3.5 PL of the CdSe–silicone nanocomposite
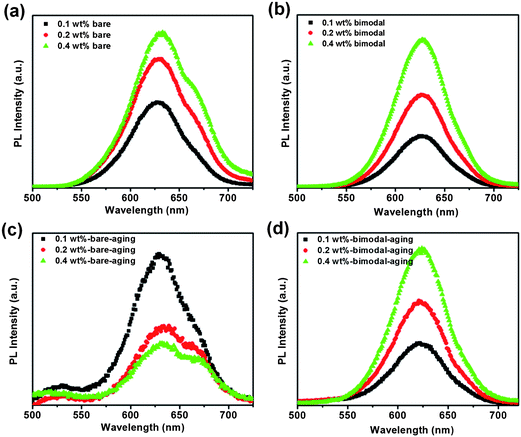
To investigate the influence of dispersion of CdSe QDs on the PL behavior of the resultant nanocomposites, we further studied the PL properties of the strongly agglomerated unmodified and the homogeneously dispersed bimodal nanocomposites. Fig. 6(a) and (b) compare the PL spectra of the bare and bimodal PDMS-grafted CdSe–silicone nanocomposites with an excitation wavelength of 460 nm. The bare CdSe QD–silicone nanocomposites (0.1 wt%) showed a broad emission peak centered at 625 nm. Upon increasing the loading to 0.2 wt%, the peak became broader and an additional emission peak around 670 nm was observed. The peak shoulder at 670 nm is more obvious for the 0.4 wt% CdSe–silicone nanocomposites. Different from the unmodified bare QDs, only the single 625 nm emission peak was observed within the bimodal PDMS-grafted CdSe–silicone nanocomposites at all these three loading concentrations. The additional emission at 670 nm can be ascribed to the red-shifted emission from larger QDs which evolved from the as-synthesized QDs within the agglomerates. An estimation of the increased average particle size can be obtained according to the dependence of the emission peak on the particle size as described by eqn (4):41,42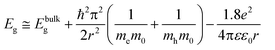 | (4) |
 | ||
| Fig. 6 Photoluminescence of CdSe–silicone nanocomposites before and after thermal annealing: (a) unmodified bare CdSe; (b) bimodal PDMS-grafted CdSe; (c) unmodified bared CdSe after thermal annealing; (d) bimodal PDMS-grafted CdSe after thermal annealing. | ||
Quantitative analysis of the emission intensity shows that the bimodal PDMS-grafted CdSe–silicone nanocomposites showed a proportionate PL intensity with increasing loading. However, the increment in emission intensity becomes smaller for the unmodified bare CdSe–silicone nanocomposite samples. With the same 0.4 wt% loading concentration, further increasing the sample thickness (not shown) leads to even weaker emission intensity. This can be primarily explained by significant scattering of the emitted light by the large agglomerates. In addition, the stronger PL quenching resulting from the aggregation of the individual QDs in the high loading sample could be another factor.43,44
PL stability of color conversion materials is another critical requirement for successful optoelectronic device fabrication and long-term operation. To evaluate the impact of aging, the bare and bimodal PDMS-grafted CdSe–silicone nanocomposites were put into an Isotemp oven at 150 °C for 24 h under ambient atmosphere. Fig. 6c shows that the emission shoulder, which was initially observed within the high loading unmodified CdSe–silicone sample, becomes more pronounced. The 0.1 wt% sample demonstrated a similar emission profile as before annealing. After annealing, the 0.2 wt% and 0.4 wt% samples showed an even lower emission intensity than the 0.1 wt% sample. Fig. 6(d) shows that the well-dispersed bimodal grafted CdSe–silicone nanocomposites maintained their emission characteristic in terms of the peak position and the relative intensity between samples with different loading concentrations. A decrease in the PL intensity of the CdSe QDs in the silicone matrix was observed after thermal annealing. Thermally activated nonradiative carrier quenching was generally thought to be the main reason.44,45 The lack of effective passivation of the surface of the QDs would lead to the deteriorated PL performance.
As shown by the TEM images in Fig. 4a and b, the oleic acid ligand stabilized CdSe QDs formed agglomerates, which consist of closely packed individual QDs. During the course of the heating process, the weakly bound ligands will gradually desorb and the QDs would only be partially passivated. Considering the close proximity of the aggregated QDs, the partially passivated QDs would be in direct contact and grow into larger size particles upon thermal heating. As the loading concentration increases, the unmodified QDs will have an increasing probability of forming agglomerates. This is consistent with the observation of the obvious red-shifted emission shoulder within the more highly loaded samples. Long time thermal annealing would facilitate the diffusion of atoms and finally result in more serious particle coarsening and PL quenching. Similar coarsening behavior of ligand stabilized gold nanoparticles in poly(methyl methacrylate) thin films has been reported in the literature,46 in which broader particle size distribution after prolonged annealing was observed. In our case, the broader QD particle size distribution explains the broader emission spectra. The bimodal grafted QDs were homogeneously dispersed with an average inter-particle distance of more than 10 nm. At this separation distance, the QDs are not able to come into sufficient proximity to fuse into large particles. The atomic diffusion of the well-dispersed bimodal grafted QDs was also restricted by the presence of both grafted PDMS chains and silicone matrix chains. Clearly, in the well-dispersed bimodal PDMS-grafted CdSe QD–silicone nanocomposites, the coarsening process of the QDs was delayed and the aging of the whole nanocomposite was slowed.
4. Conclusions
In the present work, CdSe QD surfaces were grafted with phosphate-terminated PDMS chains with mono-modal and bimodal chain length distributions via a direct surface coupling reaction. The dispersion state, optical transparency and PL behavior of CdSe–silicone nanocomposites filled with unmodified, mono-modal and bimodal PDMS-grafted CdSe QDs were studied and compared. Improved dispersion was observed in the PDMS-grafted CdSe–silicone nanocomposites. Unlike the sub-micrometer sized aggregates seen in the unmodified QD nanocomposites, the mono-modal PDMS-grafted QDs formed 50–100 nm clusters. By contrast, the bimodal PDMS-grafted QDs showed a homogenous dispersion within the high molecular weight silicone matrix even at higher loading concentrations. Highly transparent thick nanocomposites were successfully obtained using the bimodal PDMS-grafted CdSe QDs as fillers. Good dispersion of the bimodal PDMS-grafted QDs in silicone also minimized the scattering loss of PL emission and enabled homogenous light conversion in thick and highly loaded nanocomposites. Furthermore, owing to good dispersion, the coarsening process of the QDs was delayed and the PL of the nanocomposites was more stable against thermal annealing. It is also anticipated that this versatile surface modification strategy would be applicable to dispersing the nontoxic and high efficiency core–shell structured QD nanophosphors within silicone matrices to accelerate the adoption and application of QD–silicone nanocomposites as advanced light conversion materials on LED devices.Acknowledgements
This work was supported by the Engineering Research Center Program (ERC) of the National Science Foundation under Cooperative Agreement EEC-0812056 and in part by New York State under NYSTAR contract C090145. The authors also acknowledge financial support by the Nanoscale Science and Engineering Initiative of the National Science Foundation under NSF award number DMR-0642573 and NSF-MRI grant support for multipurpose X-ray diffractometer. We also thank Anand Viswanath and Professor Brian Benicewicz for their help in NMR measurement and valuable suggestions.Notes and references
- N. Tomczak, D. Jańczewski, M. Han and G. J. Vancso, Prog. Polym. Sci., 2009, 34, 393 CrossRef CAS.
- M. A. Schreuder, J. D. Gosnell, N. J. Smith, M. R. Warnement, S. M. Weiss and S. J. Rosenthal, J. Mater. Chem., 2008, 18, 970 RSC.
- E. Jang, S. Jun, H. Jang, J. Lim, B. Kim and Y. Kim, Adv. Mater., 2010, 22, 3076 CrossRef CAS.
- T. Nann and W. M. Skinner, ACS Nano, 2011, 5, 5291 CrossRef CAS.
- C. C. Lin and R.-S. Liu, J. Phys. Chem. Lett., 2011, 2, 1268 CrossRef CAS.
- X. Peng, M. Schlamp and A. Kadavanich, J. Am. Chem. Soc., 1997, 7863, 7019 CrossRef.
- X. Wang, W. Li and K. Sun, J. Mater. Chem., 2011, 21, 8558 RSC.
- S. Kim, T. Kim, M. Kang, S. K. Kwak, T. W. Yoo, L. S. Park, I. Yang, S. Hwang, J. E. Lee, S. K. Kim and S.-W. Kim, J. Am. Chem. Soc., 2012, 134, 3804 CrossRef CAS.
- W. Zou, Z. Du and H. Li, J. Mater. Chem., 2011, 21, 13276 RSC.
- Y. Yang, H.-Q. Shi, W.-N. Li, H.-M. Xiao, Y.-S. Luo, S.-Y. Fu and T. Liu, Compos. Sci. Technol., 2011, 71, 1652 CrossRef CAS.
- J. Ziegler, S. Xu, E. Kucur, F. Meister, M. Batentschuk, F. Gindele and T. Nann, Adv. Mater., 2008, 20, 4068 CrossRef CAS.
- K. Sill and T. Emrick, Chem. Mater., 2004, 16, 1240 CrossRef CAS.
- P. Tao, A. Viswanath, Y. Li, A. Rungta, B. C. Benicewicz, R. W. Siegel and L. S. Schadler, MRS Online Proc. Libr., 2011, 1359, 163–168 Search PubMed.
- Z.-R. Shen, Y.-L. Li, J.-B. Liu, M.-X. Chen, F. Hou and L.-Q. Wang, Nanoscale, 2012, 4, 1652 RSC.
- P. Akcora, H. Liu, S. K. Kumar, J. Moll, Y. Li, B. C. Benicewicz, L. S. Schadler, D. Acehan, A. Z. Panagiotopoulos, V. Pryamitsyn, V. Ganesan, J. Ilavsky, P. Thiyagarajan, R. H. Colby and J. F. Douglas, Nat. Mater., 2009, 8, 354 CrossRef CAS.
- P. Green, Soft Matter, 2011, 7, 7914 RSC.
- P. Tao, Y. Li, A. Rungta, A. Viswanath, J. Gao, B. C. Benicewicz, R. W. Siegel and L. S. Schadler, J. Mater. Chem., 2011, 21, 18623 RSC.
- P. Tao, A. Viswanath, L. S. Schadler, B. C. Benicewicz and R. W. Siegel, ACS Appl. Mater. Interfaces, 2011, 3, 3638 CAS.
- W. H. Binder, R. Sachsenhofer, C. J. Straif and R. Zirbs, J. Mater. Chem., 2007, 17, 2125 RSC.
- S. R. Edgecombe, J. M. Gardiner and M. W. Matsen, Macromolecules, 2002, 35, 6475–6477 CrossRef CAS.
- L. Liu, Q. Peng and Y. Li, Inorg. Chem., 2008, 47, 5022 CrossRef CAS.
- R. Gomes, A. Hassinen, A. Szczygiel, Q. Zhao, A. Vantomme, J. C. Martins and Z. Hens, J. Phys. Chem. Lett., 2011, 2, 145 CrossRef CAS.
- B. Fritzinger, R. K. Capek, K. Lambert, J. C. Martins and Z. Hens, J. Am. Chem. Soc., 2010, 132, 10195 CrossRef CAS.
- P. D. Cozzoli, A. Kornowski and H. Weller, J. Am. Chem. Soc., 2003, 125, 14539 CrossRef CAS.
- M. N. Tchoul, S. P. Fillery, H. Koerner, L. F. Drummy, F. T. Oyerokun, P. A. Mirau, M. F. Durstock and R. A. Vaia, Chem. Mater., 2010, 22, 1749 CrossRef CAS.
- C. Bullen and P. Mulvaney, Langmuir, 2006, 22, 3007 CrossRef CAS.
- F. Dubois, B. Mahler, B. Dubertret, E. Doris and C. Mioskowski, J. Am. Chem. Soc., 2007, 129, 482 CrossRef CAS.
- R. Hu, X. Luo, H. Feng and S. Liu, J. Lumin., 2012, 132, 1252 CrossRef CAS.
- F. Xu, W. Zhou and A. Navrotsky, J. Mater. Res., 2011, 26, 720 CrossRef CAS.
- P. Zheng and T. J. Mccarthy, Polymer, 2010, 26, 18585 CAS.
- S. R. Raghavan, J. Hou, G. L. Baker and S. A. Khan, Langmuir, 2000, 16, 1066 CrossRef CAS.
- J. N. Israelachvili, Intermolecular and Surface Forces, Academic Press, Waltham, Massachusetts, 2nd edn, 1992 Search PubMed.
- C. Chevigny, F. Dalmas, E. Di Cola, D. Gigmes, D. Bertin, F. Boué and J. Jestin, Macromolecules, 2011, 44, 122 CrossRef CAS.
- D. L. Green and J. Mewis, Langmuir, 2006, 22, 9546 CrossRef CAS.
- V. Pryamtisyn, V. Ganesan, A. Z. Panagiotopoulos, H. Liu and S. K. Kumar, J. Chem. Phys., 2009, 131, 221102 CrossRef.
- C.-K. Wu, K. L. Hultman, S. O'Brien and J. T. Koberstein, J. Am. Chem. Soc., 2008, 130, 3516 CrossRef CAS.
- G. D. Smith and D. Bedrov, Langmuir, 2009, 25, 11239 CrossRef CAS.
- Y. Li, P. Tao, A. Viswanath, B. C. Benicewicz and L. S. Schadler, Manuscript submitted for publication.
- N. Nair and N. Wentzel, J. Chem. Phys., 2011, 134, 194906 CrossRef.
- C. Lü and B. Yang, J. Mater. Chem., 2009, 19, 2884 RSC.
- L. Brus, J. Chem. Phys., 1984, 80, 4403 CrossRef CAS.
- L. Brus, J. Phys. Chem., 1986, 12, 2555 CrossRef.
- C. R. Kagan, C. B. Murray and M. G. Bawendi, Phys. Rev. B: Condens. Matter, 1996, 54, 8633 CrossRef CAS.
- A. Y. Nazzal, X. Wang, L. Qu, W. Yu, Y. Wang, X. Peng and M. Xiao, J. Phys. Chem. B, 2004, 108, 5507 CrossRef CAS.
- K. Pechers'ka, L. Germash and N. Korsunska, Ukr. J. Phys., 2010, 55, 403 CAS.
- L. Meli and P. F. Green, ACS Nano, 2008, 2, 1305 CrossRef CAS.
Footnote |
| † Electronic supplementary information (ESI) available: 31P NMR spectrum of phosphate-terminated PDMS; TGA curves of as-synthesized CdSe QDs and PDMS-grafted QDs; absorbance and PL spectrum of PDMS-grafted QD dispersion in chloroform; digital photographs of CdSe–silicone nanocomposites as coatings on glass substrates and thick bulk materials; and parameters used to calculate van der Waals attractions between CdSe QDs within the silicone matrix. See DOI: 10.1039/c2tc00057a |
| This journal is © The Royal Society of Chemistry 2013 |