 Open Access Article
Creative Commons Attribution 3.0 Unported Licence
Using POSS reagents to reduce hydrophobic character in polypropylene nanocomposites†
Emily R. Smith, Brendan J. Howlin and Ian Hamerton*
Department of Chemistry, Faculty of Engineering and Physical Sciences, University of Surrey, Guildford, Surrey GU2 7XH, UK. E-mail: i.hamerton@surrey.ac.uk
First published on 19th September 2013
Abstract
Three POSS reagents (1,2-propanediolisobutyl POSS, glycidylisooctyl POSS, and triglycidylisobutyl POSS, all 5 wt%) are incorporated into a commercial isotactic polypropylene, PP. Infrared and Raman spectroscopy show that the blending has been successful as evidenced by the presence of Si–O–Si bands at 1098–1110 cm−1, which are not present in the base polymer. The inclusion of 5 wt% of the various POSS reagents leads to a general increase in the loss modulus at the Tg (e.g. the greatest increase being from ca. 125 MPa to ca. 150 MPa) from DMTA data, although the Tg of the PP is slightly diminished by 4–8 K depending on the POSS used. The melting behaviour is also altered as the addition of POSS leads to a more diffuse and multimodal melting endotherm in the blends, although the melting temperature does increase slightly (7 K). TGA data confirm that the thermal and thermo-oxidative stability of PP is not adversely affected by the inclusion of the POSS reagents at this concentration. Tensile data show that the ultimate tensile strength (ca. 24.7 ± 0.1 MPa) remains the same, although the tensile modulus (ca. 1.24 ± 0.06 GPa) is reduced by up to 0.22 GPa and the maximum load does reduce by ca. 80–160 N. Contact angle measurements for the PP (99.72° ± 0.73) show that the inclusion of the POSS reagents at this level does reduce its hydrophobic character as the greatest depression in contact angle is effected by the inclusion of 5 wt% triglycidylisobutyl-POSS (85.77° ± 1.39). Molecular modelling and QSPR techniques are used to predict selected physical properties of the PP/POSS nanocomposites.
Introduction
Polypropylene (PP) is one of the truly big players in the commodity polymer marketplace. In 2007, the global market for PP accounted for around 45.1 million tons and a turnover of ca. $65 billion (47.4 billion €).1 The polymer is widely used in a variety of commodity and higher performance applications in bulk, film, and fibre forms, with a balance of desirable properties such as excellent resistance to attack from dilute and concentrated acids, alcohols, bases and mineral oils; good resistance to attack from aldehydes, esters, aliphatic hydrocarbons, ketones and vegetable oils. With a wide range of use temperatures (0–135 °C), a density of 0.9 g cm−3 and a melting temperature of 170 °C (melt flow index 0.9–1000 g/10 min depending on grade), the translucent rigid polymer is suitable for autoclave moulding. Typical tensile strength for the isotactic polymer is 4500 psi, making it suitable for housings for domestic appliances, extrusion of fibres and filaments for clothing and medical fabric and in generic bottle lids. With an alkylene backbone and methyl substituents the bulk polymer is hydrophobic with typical contact angles of 87.5°–117° being recorded for PP.2 As PP possesses an inherently low surface energy, it can be rendered unsuitable in certain applications wherein for instance, the polymer needs to be coated with conventional polar paints or coatings (particularly more modern, low VOC water based systems). Consequently, the surface free energy would need to be increased in order for the material to adhere successfully and investigations have been made into making the PP surface more polar. One of the most common ways of modifying the surface free energy of PP is to use plasma treatment. While this is effective and can lead to reductions in contact angles from ca. 110° to ca. 70° after exposure to a particular plasma treatment for 150 seconds,3 it can leave surfaces with considerable surface roughness. If this is ultimately undesirable, the use of POSS reagents (polyhedral oligomeric silsesquioxanes) has been used to resolve this problem by using their physical bulk to ‘fill’ the surface imperfections and therefore generate a comparatively smooth surface.4As POSS reagents are typically structurally very different to the polymer within which they are incorporated, it is important to consider dispersion upon mixing. This is particularly prudent if the incorporation is purely physical entrapment, as opposed to reactive blending. It has been proposed that the POSS molecules migrate to the surface of the PP, as a result of the relative energies involved. The cohesive energy of the POSS molecule and the matrix chains are, in relative terms, lower than the cohesion energy of the polymeric chains, causing the POSS molecules to be effectively propelled to the surface of polymer.5 While there are few investigations into increasing the surface energy of PP by the utilisation of functionalised POSS, there are various examples of adopting this approach to other polymeric materials. For instance, trisilanolphenyl POSS has been shown to effect a small (1 mN m−1) increase in the surface energy of polystyrene at low concentrations (5–10 wt%).6 Similarly, the hydrophilicity of selected polyamides have increased by introducing up to 10 wt% POSS, with the finding that the contact angle was reduced from (62.9 ± 0.9)° to (38.6 ± 0.4)° with the highest loading.7 The aim of the present work is to examine the effects of introducing selected POSS reagents into the bulk polymer in order to reduce the hydrophobicity of the resulting nanocomposite, preferably without diminishing other physical and mechanical properties. Moreover, we attempt to explore whether a combination of QSPR (quantitative structure property relationships) and molecular simulation will enable us to predict the properties of these and related nanocomposites.
Experimental
Materials
The commercial metallocene grade isotactic polypropylene (PP) of density 0.900 g cm−3 and melt flow index 24.0 g/10 minutes (at load 2.16 kg, 230 °C) was used as received. The POSS reagents (1,2-propanediolisobutyl POSS AL0130; glycidylisooctyl POSS, EP0419; and triglycidylisobutyl POSS, EP0423, Fig. 1) were all supplied by Hybrid Plastics Inc., Hattiesburg, who undertook the initial blending in house. Both AL0130 and EP0423 are structurally related, containing a cubic inorganic cage structure with silicon atoms at the apices and oxygen atoms on the vertices. Both POSS reagents are monofunctional containing a glycidyl ether moiety (EP0419) or a 1,2-propanediol moiety (AL0130) bonded to one of the silicon atoms; the remaining apices bear either isooctyl (EP0419) or isobutyl (AL0130) moieties. In contrast, EP0423 represents a more open structure (from which the final closing silicon atom is missing to complete the cage). This triglycidyl ether contains isobutyl groups on the remaining silicon atoms. Blends of PP comprising 5 wt% of each POSS reagent were produced as described below.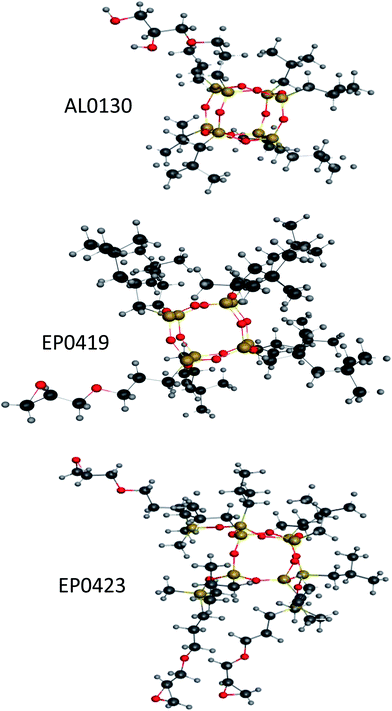 | ||
| Fig. 1 Representations of POSS reagents used in this work (structures produced using MOE 2010.11). N.B., carbon atoms are dark grey, hydrogen atoms are light grey, oxygen atoms are red and silicon atoms are golden. | ||
![[thin space (1/6-em)]](https://www.rsc.org/images/entities/char_2009.gif) :
:![[thin space (1/6-em)]](https://www.rsc.org/images/entities/char_2009.gif) 1. The compounding temperature zones ranged from 150 to 180 °C. All extruded strands were passed through a water trough and pelletised/dried during palletisation. The AL0130 (Lot # 042710, 0.15 kg) and PP (2.85 kg) were added to the extruder throat via weight loss feeders and 2 kg of PP-POSS material was made. Since EP0419 (Lot # 09071073, 0.15 kg) is a liquid it was tumble mixed with PP pellets to achieve uniform coating of pellets. The resulting mixed material was then added to the extruder using a weight loss feeder and compounded, dried, pelletized as above. Since EP0423 (Lot # 06291029, 0.15 kg) is a liquid it was tumble mixed with PP pellets (2.85 kg) to achieve uniform coating of pellets. The resulting mixed material was then added to the extruder using a weight loss feeder and compounded, dried, pelletized as above.
1. The compounding temperature zones ranged from 150 to 180 °C. All extruded strands were passed through a water trough and pelletised/dried during palletisation. The AL0130 (Lot # 042710, 0.15 kg) and PP (2.85 kg) were added to the extruder throat via weight loss feeders and 2 kg of PP-POSS material was made. Since EP0419 (Lot # 09071073, 0.15 kg) is a liquid it was tumble mixed with PP pellets to achieve uniform coating of pellets. The resulting mixed material was then added to the extruder using a weight loss feeder and compounded, dried, pelletized as above. Since EP0423 (Lot # 06291029, 0.15 kg) is a liquid it was tumble mixed with PP pellets (2.85 kg) to achieve uniform coating of pellets. The resulting mixed material was then added to the extruder using a weight loss feeder and compounded, dried, pelletized as above.Apparatus
Fourier transform infrared spectra were recorded using a Perkin-Elmer system 2000 spectrometer. The samples (thin films) were presented in the ATR module. In each case 16 scans, at a resolution of 4 cm−1, were recorded (4000–550 cm−1) and co-added to produce the final spectrum. Raman spectra at a resolution of 1.0 cm−1 were acquired on the same spectrometer at room temperature using a Nd-YAG laser (excitation wavelength 1064 nm, 810 mW).Sample alignment was monitored using the sulphur band at 217 cm−1. Samples were presented in Durham tubes, having filled these with molten PP.
Differential scanning calorimetry (DSC) was undertaken using a TA Instruments Q1000, on samples (cut thin film samples) of 5 ± 0.5 mg in hermetically-sealed aluminium pans. Experiments were conducted at a heating rate of 10 K min−1 from room temperature to 300 °C under flowing nitrogen (50 cm3 min−1). The samples were then cooled at 10 K min−1 from 300 to 20 °C before a rescan was run at 10 K min−1 (25–300 °C) to reveal glass transition temperature (Tg) for samples (taken as the midpoint of the transition).
Thermogravimetric analysis (TGA) was undertaken using a TA Instruments Q500, on samples of 9 mg in a platinum crucible. Experiments were conducted at a heating rate of 10 K min−1 from room temperature to 700 °C under nitrogen (balance gas, nitrogen: 40 cm3 min−1, sample gas, air: 60 cm3 min−1) and air (balance gas, nitrogen: 40 cm3 min−1, sample gas, air: 60 cm3 min−1).
Dynamic mechanical thermal analysis (DMTA) experiments were run on the TA Instruments Q800 DMA. Samples (35 × 12 × 3 mm3, cross sectional area 36 mm2) were oscillated in a dual cantilever clamp in a three-point flexural mode at a fixed frequency, of 1 Hz (0.1% strain) while being scanned over a temperature range of −30 to 200 °C. The heating rate for DMTA experiments was 4 K per minute and the samples were heated under a nitrogen atmosphere (40 cm3 min−1).
Mechanical measurements were made using an Instron 6600 tensile tester accompanied by a 25 mm (occasionally 50 mm) extensometer on injection moulded ‘dogbone’ samples (3 mm × 12 mm × 25 mm). The crosshead speed was 1 mm per minute and the maximum load was recorded against time as well as strain at 1%. The experiment was concluded when the material began to undergo ‘necking’ and the peak at maximum load began to fall. At least 10 replicate samples were analysed in each case.
Surface wetting was measured on excess material removed from the injection moulded samples used for tensile measurements by determining contact angles using a Kruss ‘EasyDrop’ goniometer using specialist software. All samples were cleaned with isopropyl alcohol prior to analysis and placed on the moveable stage in the goniometer. A drop of water (deposited by syringe) was placed on the polymer surface and the readings were taken after a period of stabilisation (15 seconds) and for a further 15 seconds. The contact angle was recorded at the point at which the graph begins to deviate; 10 replicate analyses were performed in each case (at a variety of points on the sample's surface) and the average number recorded.
Scanning electron microscopy (SEM) was performed using a Hitachi TM3000, coupled with a Bruker Quantax 70 for the collection of energy dispersive X-ray (EDX) spectroscopic data. Sample sections for the EDX analysis were taken at 15 keV and the acquisition period was 120 seconds.
For the analysis of the fracture surfaces using scanning electron microscopy (SEM), the sample was nicked, before being submerged in liquid N2 for approximately 25 minutes. It was removed and fractured as quickly as possible, before being fixed to an SEM stub and coated with chromium (Emitech k575x Peltier Cooled). Three coatings of 1.5 nm were used, with a sputter time of 40 seconds and a 150 mA clean current. The sample was then warmed to room temperature and taken to the SEM (JSM-7100F), before being mounted and inserted into the specimen chamber. The fracture surface was imaged using the prescribed setting for 'coated plastic sample', with an accelerating voltage of either 1 kV or 5 kV, at magnification of 10![[thin space (1/6-em)]](https://www.rsc.org/images/entities/char_2009.gif) 000×.
000×.
Molecular modelling
Modelling was performed using Materials Studio v.6.0.0 (Accelrys, 2012) on a server (CHEM-4, an 8 core Xenon, 2.33 GHz with 8 GB RAM running Windows server 2008, 64 bit). Potential energies were calculated using the COMPASS Force Field.8 Polypropylene chains were built up using the polymer builder using isotactic sequences of monomers. 10 repeat units were joined to form chains. POSS reagents were built manually and minimised before use. The required amount of POSS (5 wt%) was added to the PP chains and the latter were packed into cells using the amorphous cell module to reproduce the literature values for the density of PP (0.900 g cm−3). The resulting amorphous cells comprised between 8178 and 11![[thin space (1/6-em)]](https://www.rsc.org/images/entities/char_2009.gif) 284 atoms. A minimization of 500 iterations was carried out to relieve the strain using the Discover minimization module to a convergence of 1000 kcal mol−1 Å−1. A conjugate gradients algorithm was carried out to a convergence of 100 kcal mol−1 Å−1. The legacy temperature cycle in the amorphous cell module was used for the molecular dynamics simulation. The NPT ensemble with a time step of 1 fs was utilized with the Anderson thermostat in combination with the Berendsen barostat.9 PCFF was used with the atomic van der Waals summation, a cut-off of 10.00 Å, a spline width of 3.00 Å and a buffer width of 1.00 Å. 51 MD simulations were run between 77 °C and −23 °C in decrements of 10 K; at each temperature stage a 50 ps MD simulation was carried out. The first 25 ps of each simulation were used to equilibrate the system and the subsequent 50 ps simulation was used to record the results. A plot of calculated cell density was plotted against simulation temperature to determine both the Tg and the degradation onset temperature.
284 atoms. A minimization of 500 iterations was carried out to relieve the strain using the Discover minimization module to a convergence of 1000 kcal mol−1 Å−1. A conjugate gradients algorithm was carried out to a convergence of 100 kcal mol−1 Å−1. The legacy temperature cycle in the amorphous cell module was used for the molecular dynamics simulation. The NPT ensemble with a time step of 1 fs was utilized with the Anderson thermostat in combination with the Berendsen barostat.9 PCFF was used with the atomic van der Waals summation, a cut-off of 10.00 Å, a spline width of 3.00 Å and a buffer width of 1.00 Å. 51 MD simulations were run between 77 °C and −23 °C in decrements of 10 K; at each temperature stage a 50 ps MD simulation was carried out. The first 25 ps of each simulation were used to equilibrate the system and the subsequent 50 ps simulation was used to record the results. A plot of calculated cell density was plotted against simulation temperature to determine both the Tg and the degradation onset temperature.Results and discussion
Selection and incorporation of the POSS reagents into polypropylene
The selection of the POSS reagents was made in order to ensure the greatest degree of compatibility between matrix and additive, while reducing the hydrophobicity of the blend. Unsurprisingly, literature studies10 have shown that the dispersion of POSS reagents into the PP matrix and the resulting morphology is often influenced by PP chain length and the structural similarity between the polymer and the POSS reagent. From an extensive catalogue of POSS reagents, those containing isobutyl and isooctyl residues bonded to the silicon atoms at the apices. At the same time, the selection of the functional groups was made in order that the ability to introduce an alcohol (AL0130) directly into the PP could be compared with a latent alcohol (analogous to a synthon as an epoxide, EP0419, or tri-epoxide, EP0423). The reasoning being that the less polar epoxide rings could be introduced and dispersed more readily in the non polar PP, before undergoing ring opening during the molten blending process to introduce sites for hydrogen bonding. Epoxy resins, particularly in the form of glycidyl ethers, are known to be sensitive to both acid- and base-catalysed ring-opening reactions with mild heating and ultraviolet radiation.11,12 Owing to the geometry of the oxirane moiety, in which the 3-membered ring is highly strained, this can be accomplished at comparatively low temperatures (i.e. during the blending step) in the presence of adventitious moisture or even with residual polymerisation catalyst in the PP (Fig. 2), where there is the possibility of nucleophilic species being present. As the compounding temperature zones during extrusion ranged from 150 to 180 °C, the ring-opening reaction would be not only favoured but rapid (in a previous study13 the diglycidyl ether of bisphenol A displayed a k1 value of 4.48 × 10⁻⁴ s−1 at 150 °C for the oxirane ring opening reaction in the presence of 2-ethyl-4-methylimidazole).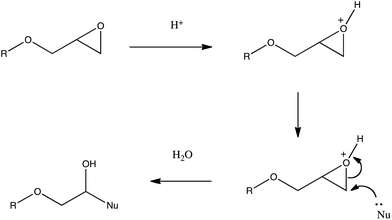 | ||
| Fig. 2 General mechanism for the acid catalysed ring opening of the epoxide group. | ||
Vibrational spectroscopy (Fig. 3) was used to confirm the incorporation of the POSS reagents prior to further thermal and mechanical analysis. According to previous studies on octamethyl-POSS,14,15 the bands between 1000 and 1125 cm−1 are characteristic of the Si–O–Si stretches and, whilst these were absent in the PP sample (as expected), they were observed in the PP samples blended with the POSS reagents at 1103 cm−1 (AL0130), 1110 cm−1 (EP0419), and 1098 cm−1 (EP0423) respectively.
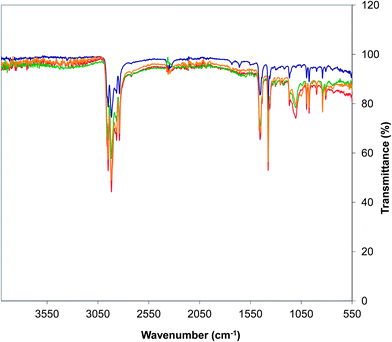 | ||
| Fig. 3 Infrared spectra (recorded in transmission) of (a) PP standard (blue), (b) PP/EP0419 (red), (c) PP/AL0130 (green), and (d) PP/EP0423 (gold). | ||
Raman spectroscopy was also used in a complementary fashion to observe Si–O–Si deformations at 453, 532 cm−1 (AL0130), 451, 524 cm−1 (EP0419), and 451, 523 cm−1 (EP0423) respectively. Some indication of the presence of OH groups were found using infrared through weak bands (3550–3250 cm−1), suggesting that the even the epoxy-based POSS reagents (EP0419 and EP0423) had indeed undergone ring opening during the blending process. This is a useful attribute since the epoxides (being significantly less polar than the alcohol) should be somewhat easier to introduce into the PP, prior to ring opening to yield hydroxylation.
The degree of dispersion of nanofillers plays an important role in influencing the properties of the resulting nanocomposites and energy dispersive X-ray spectroscopy (EDX), combined with scanning electron microscopy, was employed to analyse the elemental composition on the virgin surface and following microtoming through the bulk of the sample. With a PP matrix, comprising carbon and hydrogen, the presence of oxygen and silicon (Fig. 4) offers a good measure of the presence of the POSS reagents (not only in the cage, but also the glycidyl or hydroxylated functional groups).
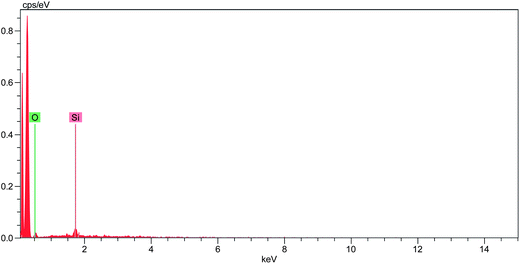 | ||
| Fig. 4 EDX spectrum of the virgin surface of the PP nanocomposite containing 5 wt% AL0130. | ||
Further analysis of the bulk surface involved the progressive removal of around 300 microns of the matrix to produce a crude depth profile (Fig. 5a–c). The evidence of the elemental analysis suggests that the nanofiller is well dispersed within and throughout the bulk PP matrix, supporting the observation that the blending process was thorough and effective.
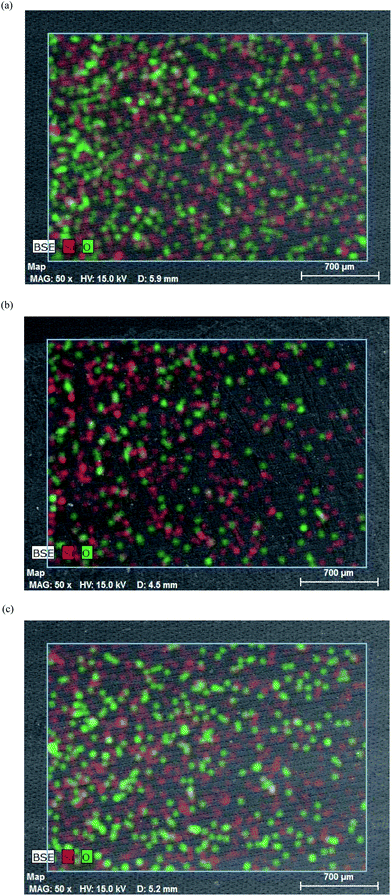 | ||
| Fig. 5 (a) Elemental maps, magnification 50× from SEM-EDX of (a) the virgin surface of the PP/AL0130 nanocomposite showing the distribution of silicon (red) and oxygen (green) atoms (b) following removal of 10% of the surface depth, (c) following removal of 50% of the surface depth of the bulk polymer. | ||
At the same time the samples were submerged in liquid N2 before being fractured to expose fresh surfaces. The latter were coated using chromium prior to analysis using SEM and representative images (magnification 10![[thin space (1/6-em)]](https://www.rsc.org/images/entities/char_2009.gif) 000×) are shown for two different nanocomposites when subjected to accelerating voltages of 1 kV (Fig. 6a) and 5 kV (Fig. 6b); the analysis of the other samples resulted in similar images. The sample bar is 1 μm indicating that any agglomerates present are sub micron in size.
000×) are shown for two different nanocomposites when subjected to accelerating voltages of 1 kV (Fig. 6a) and 5 kV (Fig. 6b); the analysis of the other samples resulted in similar images. The sample bar is 1 μm indicating that any agglomerates present are sub micron in size.
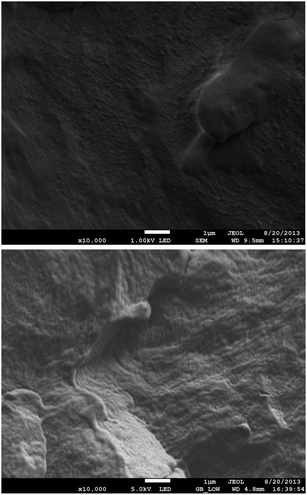 | ||
Fig. 6 SEM micrographs (magnification 10![[thin space (1/6-em)]](https://www.rsc.org/images/entities/char_2009.gif) 000×) of fracture surfaces of (a) PP/EP0423 using a beam voltage of 1 kV and (b) PP/AL0130 using a beam voltage of 5 kV. 000×) of fracture surfaces of (a) PP/EP0423 using a beam voltage of 1 kV and (b) PP/AL0130 using a beam voltage of 5 kV. | ||
Although the dispersion of the POSS reagents appears to be relatively uniform, differential scanning calorimetry (DSC) was also employed to demonstrate the homogeneity of the nanocomposites, specifically through examination of the melting behaviour. The DSC thermograms (Fig. 7) for the rescan experiments for each of the samples under examination show the effect of introducing the POSS reagents. The melting endotherm observed for PP commences at a relatively low temperature (100 °C), but results in a comparatively sharp melting temperature (peak minimum 151 °C at 10 K min−1) accounting for ΔHm = 71 J g−1 indicating the presence of both crystalline and amorphous domains in the PP matrix. The enthalpy of melting compares favourably with other published values for isotactic PP.16 The presence of POSS reagents serves to increase the melting temperature very slightly and yield two overlapping endothermic peaks, although the ΔHm appears to undergo a slight reduction (64–65 J g−1, peak minimum 158 °C) meaning that processing appears little affected by the addition of the additive at this level. The thermogram shown in Fig. 7b (for PP/EP0419) appears to represent the most homogeneous blend with the simplest endotherm (with less bimodal character).
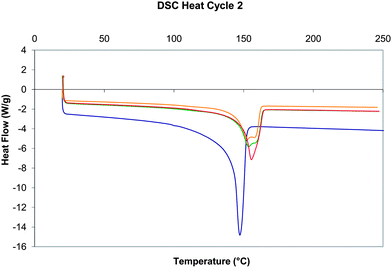 | ||
| Fig. 7 Differential scanning data (W g−1versus temperature, Exo upwards) for the second heating experiment (heat/cool/heat from 20 °C to 250 °C at 10 K min−1, under nitrogen) for (a) PP standard (blue), (b) PP/EP0419 (red), (c) PP/AL0130 (green), and (d) PP/EP0423 (gold). | ||
In this preliminary study, the nanofillers were simply blended with the commercial polyolefin, without concentrating on employing reactive compatibilisation. Other published studies17 have demonstrated that the use of PP-methyl POSS as a compatibiliser within a PP matrix can yield enhancements in mechanical performance and Fina et al.18 have comprehensively reviewed the area of POSS-based hybrids produced through melt/reactive blending in great depth. Indeed, we have employed this approach in a similar fashion to produce linked-interpenetrating networks in thermoset matrices with enhanced physical properties and improved hydrolytic stability.19,20 Nevertheless, the nanofillers appear to be well dispersed within the thermoplastic matrix and attention turned to the properties of the nanocomposites.
Examination of the influence of nanofillers on the thermal and mechanical behaviour of the PP/POSS nanocomposites
Although the main thrust of the work was to modify the hydrophobicity of the resin matrices, it was key that the existing physical and mechanical properties of the isotactic PP should not be degraded in the process. Having examined the homogeneity of the nanocomposites using DSC, the thermo-mechanical behaviour of the materials was examined using DMTA. This was intended as a preliminary study to examine the Tg behaviour since the effect of the POSS on tensile modulus would be determined with greater rigour using ‘dogbone’ samples. The data for the storage modulus for both PP and the nanocomposites are shown in Fig. 8.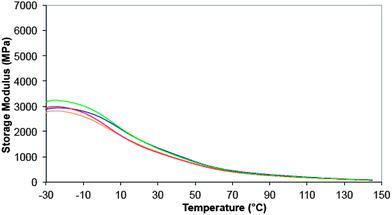 | ||
| Fig. 8 DMTA data shown as storage modulus (E′, MPa) (dual cantilever, 1 Hz, 0.1% strain) for (a) PP standard (blue), (b) PP/EP0419 (red), (c) PP/AL0130 (green), and (d) PP/EP0423 (gold). All experiments were performed from −30 °C to 150 °C at 10 K per minute, in nitrogen. | ||
All of the samples display similar features: the PP displays a drop in the storage modulus at ca. 5–9 °C, consistent with the Tg and the area under the thermogram (loss modulus, not shown) is ca. 247 MPa min−1; a second reduction in the loss modus occurs at around 30–70 °C. The introduction of AL0130 reduces the peak in the loss modulus (the Tg) and the area under the thermogram rises to ca. 302 MPa min−1; the second reduction in the loss modus appears unchanged. This is seen in the context of all of the nanocomposites in Fig. 8, from which it can be seen that Tg is most affected by the introduction of EP4019 and EP4023, although it is not clear from this study whether this is due to a change in morphology. Molecular simulations were performed over a wider range of temperature than is our normal habit in order to capture not only low temperature mechanical motions (as evidenced by the DMTA measurements), but also processes that might herald the onset of thermal degradation. Fig. 9 shows the results of the temperature ramped molecular dynamics simulation for PP/EP0423. The plot clearly shows a change in the density of the model between 0 and 50 °C, which corresponds closely with the experimental value determined using DMTA; the results of the other simulations all yielded Tg values of 10 °C (Table 1). The experimentally measured values of Tg all fall between 0 and 10 °C, i.e. for PP 9 °C, PP/AL0130 5 °C, PP/EP0419 2 °C, PP/EP0423 1 °C, indicating that the incorporation of these POSS reagents selected in this study has little effect on the observed Tg values (at a level of 5 wt%) and the simulations also show this insensitivity to change in Tg.
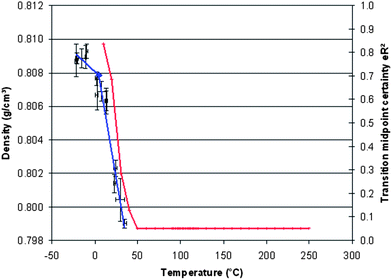 | ||
| Fig. 9 Plot of simulated density versus temperature for PP/EP0423. | ||
| POSS reagent | Tg (°C) | Td (°C) |
|---|---|---|
| AL0130 | 10 | 200 |
| EP0419 | 10 | 230 |
| EP0423 | 10 | 200 |
Preliminary measurements of the thermal and thermo-oxidative stability of the PP were made using TGA as a measure of internal consistency and the thermograms are shown in Fig. 10.
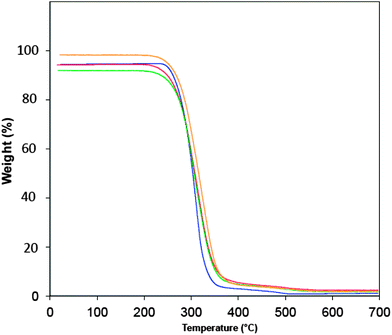 | ||
| Fig. 10 TGA data for (a) PP standard (blue), (b) PP/EP0419 (red), (c) PP/AL0130 (green), and (d) PP/EP0423 (gold). All experiments were performed in air from room temperature to 700 °C at 10 K per minute. | ||
The data presented for the unmodified PP are in agreement with published literature: the onset of degradation in air occurs at ca. 240 °C and is almost complete by 340 °C; onset commences at 450 °C in nitrogen and is virtually complete by 475 °C at this heating rate (lit. 475 °C (ref. 21)). The introduction of the POSS reagents to form the nanocomposites gave rise to a slight reduction (and more gradual mass loss) in the initial onset of degradation. However, the most significant enhancement occurs at temperatures above 341 °C, where the completion of degradation is delayed, although at these relatively low concentrations this is not particularly marked. This finding is in line with other reports in which the introduction of phenyl-substituted POSS, delayed the completion of degradation from 341 °C to between 350 and 376 °C, depending on the concentration employed.22 Furthermore, the profile the thermal degradation serves to confirm that the apparent mechanism does not appear to vary significantly in the early stages of decomposition. Temperature ramped molecular dynamics simulation was also employed to probe the onset of thermal degradation (Td) – the latter is a comparatively recent.23 addition to our panoply of simulation techniques and has been employed with some success to examine the degradation behaviour of thermosetting polymers such as cyanate esters,24 polybenzoxazines,25 and epoxy resins.26 TGA revealed that Td was found empirically to be relatively insensitive to incorporation of POSS at this level and this again borne out by the simulations, which indicates that there are no interactions taking place in the nanocomposites that are not accounted for in the model.
During the production of the dogbone samples for the tensile measurements, initial visual observations suggested that the incorporation of POSS reagents into the PP led to a reduction in the thermo-oxidative stability. The translucent white pellets became slightly more brown in colour during the injection moulding process and increased the degree of shrinkage, which is in keeping with the TGA data for the onset of degradation. At least 7 samples of each material were tested in this fashion and the data are presented in Table 2.
| Sample | UTS (MPa) | TM (MPa) | Maximum load (N) | Strain at 1% (GPa) |
|---|---|---|---|---|
| a Key: UTS = ultimate tensile strength, TM = tensile modulus. | ||||
| PP | 24.73 ± 0.10 | 13.51 ± 1.55 | 890.12 ± 3.76 | 1.24 ± 0.06 (n = 9) |
| PP/AL0130 | 21.95 ± 0.10 | 10.23 ± 0.29 | 790.04 ± 13.38 | 1.23 ± 0.03 (n = 8) |
| PP/EP0419 | 22.52 ± 0.44 | 11.03 ± 0.72 | 810.76 ± 15.67 | 1.03 ± 0.03 (n = 7) |
| PP/EP0423 | 21.06 ± 0.28 | 10.23 ± 1.13 | 758.15 ± 10.03 | 1.02 ± 0.13 (n = 10) |
In addition to the data presented, the PP base polymer took ca. 10 minutes to fail, compared with 15–20 minutes for the PP/POSS nanocomposites; the maximum load was also reduced significantly on the addition of the POSS reagents, with the greatest reduction observed for the triglycidyl ether. The UTS data for the base polymer show good agreement with other studies (e.g. 24.8 MPa (ref. 27) and 22.2 MPa (ref. 28)) validating the comparison study. In this work the introduction led to a small reduction in ultimate tensile strength, while tensile modulus appeared little changed. In other studies Young's modulus has been found to be influenced by the nature of the POSS reagent being incorporated e.g., the introduction of octa-methyl POSS led to an increase in this property in PP, whereas octa-isobutyl or octa-isoctyl POSS had the opposite effect.29 This was postulated to be due to the lengthy alkyl chains enveloping the hard, silicon cage and constituting a softer outer shell, which might limit the stress transfer from the polymer matrix to the hard core. This is less marked in our own work, but appears to hold for the maximum load in which the POSS reagents containing isobutyl groups (AL0130 and EP0419) have similar values, but are markedly greater than the isooctyl residue (EP0423).
Examination of the wetting behaviour and hydrophobicity of the PP/POSS nanocomposites
In summary, the incorporation of the POSS reagents had demonstrably yielded PP nanocomposites with similar thermal and mechanical properties to the unmodified isotactic PP homopolymer. On this basis, the effect of the addition of POSS reagents on the wetting behaviour of the PP through contact angle measurements was examined. The surface free energy is effectively a measure of the hydrophobicity of a material, and is calculated by using an obtained value of the contact angle. The lower the contact angle, the higher the surface free energy and the less hydrophobic a material. This relationship was first established by Young in 1805 and the resulting equation (eqn (1)), or a derivation of it known as “Young's Equation” (eqn (2)),30 is employed in many commercial instruments that quantify surface free energy.| Wa = γS + γL − γSL | (1) |
γL![[thin space (1/6-em)]](https://www.rsc.org/images/entities/char_2009.gif) cos cos![[thin space (1/6-em)]](https://www.rsc.org/images/entities/char_2009.gif) θ = γS − γSL θ = γS − γSL | (2) |
Young's equation considers a water droplet on a solid surface and interfacial tensions at three locations: γL (the liquid–vapour interface), γS (the solid–vapour interface) and γSL (the solid–liquid interface). It is derived by taking into account all forces acting along the line of contact, which at equilibrium must cancel each other out and result in a net figure of zero. Practically, the determination of contact angles with precision is known to present challenges (only γL can be measured as the surface tension of the solid can be determined experimentally only against a series of known liquids31) and the data reported are often hotly disputed. From the studies that have been conducted, it is clear that in order to collect data most reliably it is key that the surface must not be too rough, as a super-hydrophobic environment may be formed (and γSL will be heavily dependent on the contact angle formed). Unfortunately, during this work it was not possible to gain access to dynamic measurements, although the authors accept that there would be merit in evaluating the advancing and receding contact angles, from which the extent of any hysteresis might be determined. The collected data for the standard PP samples and the nanocomposites are shown in Table 3.
| Sample | PP | PP/AL0130 | PP/EP0419 | PP/EP4023 |
|---|---|---|---|---|
| 1 | 100.54 | 86.47 | 94.56 | 86.86 |
| 2 | 99.49 | 88.75 | 94.27 | 84.22 |
| 3 | 99.13 | 88.99 | 97.11 | 86.23 |
| Average | 99.72 | 85.77 | 95.32 | 88.07 |
The relatively high contact angle of the PP standard results from its lack of hydrogen bonding sites and great number of van der Waals interactions. For instance, a strongly hydrophobic surface will display a contact angle in excess of 90°; a strongly hydrophilic surface ≪90° and more commonly moderately polar surfaces fall somewhere in between. Thus, in this study the strongly hydrophobic PP standard was rendered slightly less hydrophobic with the incorporation of either triglycidylisobutyl POSS (EP4023), which would be present as a triol following extrusion, or 1,2-propanediolisobutyl POSS (AL0130).
An approach involving quantitative structure property relationships (QSPR) was investigated to probe the hydrophobicity of the surface and relate this to the nature of the POSS reagents that had been selected. The ultimate aim of this aspect of this preliminary work would be to yield a model capable to predicting the most suitable POSS reagent to yield favourable wetting properties whilst maintaining desirable physical and mechanical performance. The QSPR method was initially pioneered by Van Krevelen culminating in a book published32 in 2009 and in previous publications we have reported the use of QSPR to predict variously the Tg values of poly(arylene ether sulphone)s,33,34 char yield35 and thermal properties36 of polybenzoxazines. QSPR works well when one has access to a large dataset of compounds, but in this case we have effectively four experimental points, the unmodified polymer and the three POSS additives. When there are only three experimental points then a linear fit is always possible, so we are just barely in the regime where partial least squares (PLS) is applicable. With a scarcity of data many possible equations are potential solutions, so we have taken the approach of fitting to the minimum number of parameters and chosen the parameters that we want to fit to carefully so that they will provide information on the structural properties of the POSS materials. It is known that the inherent hydrophilicity in polymer structures results from a combination of several parameters, notably hydrogen bonding opportunities per unit length and the number of van der Waals interactions. Thus, the method was to perform multiple linear regression on all the data available to include the accessible surface area, the hydrogen bond acceptor count, and the van der Waals (non bonded energy); the parameters were calculated (Table 4) with the Moe 2011.10 program.37
| POSS reagent | Accessible SA (m2) | HB acceptor count | vdW energy (kcal mol−1) |
|---|---|---|---|
| a Key: accessible SA = accessible surface area, HB acceptor count = hydrogen bond acceptor count, vdW energy = van der Waals energy. | |||
| AL0130 | 1136.3 | 3 | 28.2 |
| EP0419 | 1727.5 | 2 | 90.2 |
| EP0423 | 1538.5 | 6 | 25.4 |
The parameters were chosen carefully on the basis of knowledge of the factors that generally affect the chosen physical properties of the polymers (i.e. tensile modulus, Tg, and the maximum load to break). The hydrogen bond acceptor count represents the ability of the POSS reagent to form hydrogen bonds. The tensile modulus scales with the accessible surface area of the POSS reagents: a more open structure giving the highest value of the tensile modulus. The load to break depends upon the non-bonded energy, with the largest values seen for the POSS reagents having the greatest portion of their structures contributing to van der Waals interactions. Likewise the UTS depends strongly on the van der Waals interaction energy. As this arises because of dispersion forces and the formation of induced dipoles, having a strongly polar moiety in the structure serves to enhance this interaction and conversely reduces the UTS slightly from that of PP. The regression equations were performed by partial least squares in Moe selecting the one parameter that gave the largest correlation coefficient. This result suggests that the selection of a particular POSS reagent to optimise a given parameter might be routinely possible from calculation of just three properties from molecular modelling. Work is currently underway to extend this study further and select more suitable POSS reagents based on the QSPR approach explored herein and will be reported in a future publication.
Conclusions
The addition of comparatively small quantities (5 wt%) of a variety of POSS reagents to isotactic PP is possible without degrading the existing properties of the polymer too greatly (there is a small impact on Tg and the maximum load recorded). Given the polarity of the additive, there is a practical limit to the amount of POSS that can be introduced to a polyolefin. However, the reduction in hydrophobicity possible is significant (a reduction in contact angle of some 14° is observed) with the use of a triglycidylisobutyl-POSS. This reagent offers the benefit of being introduced and dispersed in its glycidyl ether form, but undergoes ring opening (the oxirane rings are extremely strained) to yield three hydroxyl groups per POSS molecule. The QSPR modelling shows that the tensile properties of the PP/POSS nanocomposites depend strongly on the accessible surface area of the POSS moieties and their electronic interactions. The Molecular simulation shows that it is possible to model these composites and produce simulated thermal properties that are congruent with literature values. The success of the simulation approaches confirms the power of the approach and consequently these methods will be used to predict the properties of PP/POSS nanocomposites using other POSS reagents prior to procurement and blending/analysis.Acknowledgements
We thank Dr Joe Lichtenhahn (Hybrid Plastics, Hattiesburg, USA), for advice given during the procurement of the POSS reagents, Mr Toby Kemp (Instron) for assistance with the evaluation of the mechanical data, and at the University of Surrey: Mr Peter Haynes and Dr David Jesson (Faculty of Engineering and Physical Sciences) for facilitating access to analytical equipment, Mr Chris Burt for assistance with microscopy, and Ms. Violeta Doukova (Surrey Materials Institute). We are particularly grateful to Professor John Watts (Faculty of Engineering and Physical Sciences) for constructive discussions about surface analysis during the preparation of the manuscript.References
- http://www.ceresana.com/en/studies/market-studies/plastics/polypropylene, accessed 23 April 2011.
- http://www.accudynetest.com/polymer_surface_data/polypropylene.pdf, accessed 30 May, 2012.
- O.-J. Kwon, S. Tang, S.-W. Myung, N. Lu and H.-S. Choi, Surf. Coat. Technol., 2005, 192, 1–10 CrossRef CAS PubMed.
- C. Wanke, J. Feijó, L. Barbosa, L. Campo, R. Oliveira and F. Horowitz, Polymer, 2011, 52, 1797–1802 CrossRef CAS PubMed.
- S. Kuo and F. Chang, Prog. Polym. Sci., 2011, 36, 1649–1696 CrossRef CAS PubMed.
- R. Mistra, A. Alidedeoglu, W. Jarrett and S. Morgan, Polymer, 2009, 50, 2906–2918 CrossRef PubMed.
- Q. Zhou, K. P. Pramoda, J.-M. Lee, K. Wang and L. S. Loo, J. Colloid Interface Sci., 2011, 355, 222–230 CrossRef CAS PubMed.
- H. Sun, J. Phys. Chem. B, 1998, 102, 7338–7364 CrossRef CAS.
- H. J. C. Berendsen, J. P. M. Postma, W. F. van Gunsteren, A. DiNola and J. R. J. Haak, Chem. Phys., 1984, 81, 3684–3690 CAS.
- S. Li, G. P. Simon and J. G. Matisons, Polym. Eng. Sci., 2009, 50, 991–999 Search PubMed.
- N. Egger, K. Schmidt-Rohr, B. Blümich, W.-D. Domke and B. Stapp, J. Appl. Polym. Sci., 2003, 44, 289–295 CrossRef.
- J. V. Crivello and J. H. W. Lam, The photoinitiated cationic polymerisation of epoxy resins, in Epoxy Resin Chemistry, ACS, Washington DC, 1979, ch. 1, pp. 1–16 Search PubMed.
- G. J. Buist, I. Hamerton, B. J. Howlin, J. R. Jones, S. Liu and J. M. Barton, J. Mater. Chem., 1994, 4, 1793–1797 RSC.
- A. Fina, D. Tabunai, F. Carniato, A. Franche, E. Boccaleri and G. Camino, Thermochim. Acta, 2006, 440, 36–42 CrossRef CAS PubMed.
- Y. Liu, Y. Huang and L. Liu, Compos. Sci. Technol., 2007, 67, 2864–2870 CrossRef CAS PubMed.
- F. Zhang, Y. Gong and T. He, Eur. Polym. J., 2003, 39, 2315–2322 CrossRef CAS PubMed.
- L. O. Hui, Z. A. Mohd Ishak and H. M. Akil, Mater. Des., 2009, 30, 748–751 CrossRef PubMed.
- A. Fina, O. Monticelli and G. Camino, J. Mater. Chem., 2010, 20, 9297–9305 RSC.
- A. Chaplin, I. Hamerton, H. Herman, A. K. Mudhar and S. J. Shaw, Polymer, 2000, 41, 3945–3956 CrossRef CAS.
- I. Hamerton, H. Herman, K. T. Rees, A. Chaplin and S. J. Shaw, Polym. Int., 2001, 50, 475–483 CrossRef CAS.
- I. Krupa and A. S. Luyt, Polym. Degrad. Stab., 2001, 71, 505–508 CrossRef.
- A. Fina, D. Tabunai and G. Camino, Eur. Polym. J., 2010, 46, 14–23 CrossRef CAS PubMed.
- A. Baggott, J. R. Bass, I. Hamerton, B. J. Howlin, L. Mooring and D. Sparks, A novel method to predict thermal degradation behaviour in cyanate esters and nanocomposites using molecular dynamics simulation, 2012, submitted Search PubMed.
- A. O. Crawford, B. J. Howlin, G. Cavalli and I. Hamerton, React. Funct. Polym., 2012, 72, 596–605 CrossRef CAS PubMed.
- I. Hamerton, B. J. Howlin, A. L. Mitchell, S. A. Hall and L. T. McNamara, Using molecular simulation to predict the physical and mechanical properties of polybenzoxazines, in Handbook of Benzoxazine Resins, ed. H Ishida and T Agag, Elsevier, Amsterdam, 2011, ch. 5, pp. 127–142 Search PubMed.
- S. A. Hall, B. J. Howlin, I. Hamerton, A. Baidak, C. Billaud and S. Ward, PLoS One, 2012, 7(8), e42928 CAS.
- R. Strapasson, S. Amico, M. Pereira and T. Sydenstricker, Polym. Test., 2005, 46, 468–473 CrossRef PubMed.
- A. Suarez, F. Coutihno and T. Sydenstricker, Polym. Test., 2003, 22, 819–824 CrossRef.
- F. Baldi, F. Bignotti, A. Fina, D. Tabunai and T. Ricco, J. Appl. Polym. Sci., 2007, 105, 935–943 CrossRef CAS.
- T. Tadros, Applied Surfactants: Principles and Applications, John Wiley & Sons, Morlenbach, 2005, pp. 353–355 Search PubMed.
- I. Prigogine and S. A. Rice, Advances in Chemical Physics, John Wiley & Sons, New Jersey, 2005, vol. 131, p. 75 Search PubMed.
- D. W. van Krevelen and K. te Nijenhuis, Properties of Polymers. Their Correlation with Chemical Structure, Their Numerical Estimation and Prediction from Additive Group Contribution, Elsevier, Amsterdam, 2009 Search PubMed.
- I. Hamerton, B. J. Howlin and V. Larwood, J. Mol. Graphics, 1995, 13, 14–17 CrossRef CAS.
- I. Hamerton, B. J. Howlin and G. Kamyszek, PLoS One, 7(6), e38424, DOI:10.1371/journal.pone.0038424.
- P. Mhlanga, W. A. Wan Hassan, I. Hamerton and B. J. Howlin, Polym. Degrad. Stab., 2013, 98, 446–452 CrossRef PubMed.
- P. Mhlanga, W. A. Wan Hassan, I. Hamerton and B. J. Howlin, PLoS One, 8(1), e53367, DOI:10.1371/journal.pone.0053367.
- Chemical Computing Ltd., http://www.chemcomp.com/, accessed 25 May, 2012.
Footnote |
| † This paper is dedicated to the memory of Mr Dennis Smith, MBE. |
| This journal is © The Royal Society of Chemistry 2013 |
