 Open Access Article
Creative Commons Attribution 3.0 Unported Licence
Bimetallic molybdenum tungsten oxynitride: structure and electrochemical properties
Olga
Kartachova
a,
Alexey M.
Glushenkov
*a,
Yanhui
Chen
b,
Hongzhou
Zhang
b and
Ying
Chen
a
aInstitute for Frontier Materials (IFM), Deakin University, Waurn Ponds 3216, VIC, Australia. E-mail: alexey.glushenkov@deakin.edu.au; Fax: +61 3 5227 1103; Tel: +61 3 5227 2931
bSchool of Physics and Centre for Research on Adaptive Nanostructures and Nanodevices (CRANN), Trinity College Dublin, Dublin 2, Ireland. E-mail: hozhang@tcd.ie; Fax: +353 1 896 3033; Tel: +353 1 896 4655
First published on 3rd May 2013
Abstract
Mesoporous molybdenum tungsten oxynitride was synthesised by the temperature-programmed reduction of the bimetallic oxide precursor in ammonia and its electrochemical properties were investigated in 1 M H2SO4 aqueous electrolyte. The reaction product is a single-phase material, in which molybdenum and tungsten are distributed throughout the sample, with mesoporous morphology. The maximum of the pore size distribution is located at approximately 4 nm. Nearly rectangular voltammograms with the presence of small redox peaks were detected by cyclic voltammetry measurements in the acidic aqueous electrolyte, indicating properties relevant to electrochemical supercapacitors. The capacitance of 124 F g−1 was measured by galvanostatic charge–discharge and 43% of the initial capacitance can be retained upon the 400-fold increase in the current density from 0.05 to 20 A g−1. The electrochemical properties and the rate capability of the synthesised material are compared with those of monometallic oxynitrides of molybdenum and tungsten. A symmetric cell assembled with molybdenum tungsten oxynitride electrodes is also evaluated.
Introduction
Transition metal nitrides and oxynitrides possess a unique set of physico-chemical characteristics including high conductivity, resistance to corrosion and catalytic activity.1 In recent years, these nitrides and oxynitrides have been actively studied as electrode materials for various energy conversion and storage devices including dye-sensitised solar cells (DSSCs),2–4 metal-air batteries,5,6 lithium-ion batteries7–13 and supercapacitors.14–28 More specifically, the electrocatalytic activity of transition metal nitrides such as TiN5 or MoN6 has made them promising candidates for replacing noble metals catalysts for the oxygen reduction reaction. Additionally, the Pt-like electrocatalytic activity of transition metal nitrides enables their application in the counter electrodes of dye-sensitised solar cells, as an alternative to the expensive Pt for the reduction of triiodide ions in the electrolyte.2–4 Studies have confirmed that DSSCs with counter electrodes consisting of Mo2N, W2N or VN have reached 91%, 83% and 92%, respectively, of the photovoltaic performance of the DSSCs using Pt as a counter electrode.2–4 Furthermore, transition metal nitrides have been successfully applied in electrochemical energy storage devices. For example, vanadium nitride and chromium nitride thin films used as anode materials in lithium ion batteries have reached reversible capacity values of approximately 800 mA h g−1 for VN7 and 1200 mA h g−1 for CrN8 through a conversion reaction mechanism, while Co3N and Fe3N thin films attained reversible capacity values fluctuating between 324 and 420 mA h g−1 for Co3N and between 323 and 440 mA h g−1 for Fe3N, respectively.9 Furthermore, bulk CrN nanoparticles have demonstrated a reversible capacity of approximately 500 mA h g−1,10 while bulk CoN nanoparticles and CoN nanoflake films have reached a reversibly capacity of 660 mA h g−1 and 990 mA h g−1, respectively.11,12 Additionally, a reversible capacity of 400 mA h g−1 has been reported for (Ni0.33Co0.67)N nanoparticles.13Among applications in energy conversion and storage devices, the use of transition metal nitrides and oxynitrides in supercapacitor electrodes has been promising due to their high intrinsic conductivity and their resistance to corrosion.14 Nitrides and oxynitrides of vanadium,14–18 tungsten,19–21 molybdenum22–24,27 and titanium25,26,28 have demonstrated pseudocapacitive behaviour, with typical capacitance values between 30 and 350 F g−1 in aqueous electrolytes. Rate capability of the active materials is an important performance criterion, as supercapacitors used in the high power applications such as the automotive sector, smart grids or power backup systems are required to deliver energy in the pulse form and work at high discharge currents.29,30 Unlike many transition metal oxides, nitrides and oxynitrides possess high conductivities and therefore good rate capabilities. For example, W0.75(N,O) has demonstrated about 40% of the capacitance retention upon the increase of the current load from 0.05 to 10 A g−1,21 while VN has shown 79% of its initial capacitance at 0.05 A g−1, at a current load of 1 A g−1.17 TiN–VN core–shell mesoporous fibres retained 64% of the initial capacitance after increasing the current from 2 to 10 A g−1.28
It has been previously observed that a partial substitution of one transition metal by another in the crystal lattice of nitrides or oxynitrides could alter their physico-chemical properties.31–33 For instance, bimetallic compounds such as cobalt molybdenum nitride31 or vanadium molybdenum oxynitride33 have demonstrated superior catalytic properties when compared to the corresponding monometallic compounds. However, for supercapacitor electrode materials, studies have been almost exclusively focusing on the monometallic nitride compounds so far, and only limited information exists on the electrochemical performance of bimetallic transition metal nitrides and oxynitrides. Experimental data have been reported on the mixed γ-Mo2N and Co3Mo3N “composite material” demonstrating higher capacitance values than those of the pure γ-Mo2N compound.24 Meanwhile, the electrochemical performance of the pure bimetallic compound has not been studied. It is, in our view, interesting to study how the introduction of the second metal into the crystal lattice of nitrides and oxynitrides influences their electrochemical performance in supercapacitors.
In this article, a bimetallic molybdenum tungsten oxynitride is characterised as a supercapacitor electrode material. The oxynitride is synthesised by a temperature-programmed reduction (TPR) of the oxide precursor in NH3. The synthesised material is extensively characterised by X-ray diffraction (XRD), scanning electron microscopy (SEM), low temperature N2 adsorption and transmission electron microscopy (TEM). Electrochemical properties of the material are studied in 1 M H2SO4 electrolyte by performing cyclic voltammetry and galvanostatic charge–discharge measurements in the three-electrode configuration as well as in the symmetric cell, emulating an accepted design of an electrochemical capacitor. Furthermore, samples are analysed by electrochemical impedance spectroscopy (EIS). The electrochemical performance of molybdenum tungsten oxynitride is compared to those of the monometallic molybdenum oxynitride and tungsten oxynitride synthesised from the oxides of the corresponding metals by a temperature-programmed reduction under similar experimental conditions.
Experimental
Synthesis
Molybdenum tungsten oxynitride was synthesised by a solid state route similar to the method described by C. C. Yu and S. T. Oyama.32 13.5 g of WO3 (Sigma-Aldrich, 95410) and MoO3 (Sigma-Aldrich, 267856) mixture in a 1![[thin space (1/6-em)]](https://www.rsc.org/images/entities/char_2009.gif) :
:![[thin space (1/6-em)]](https://www.rsc.org/images/entities/char_2009.gif) 1 ratio was placed inside a planetary ball mill (Fritsch Pulverisette 5) and milled for 50 hours in order to achieve a high homogeneity of the mixture. Steel balls with 20 mm diameter were used with the 1
1 ratio was placed inside a planetary ball mill (Fritsch Pulverisette 5) and milled for 50 hours in order to achieve a high homogeneity of the mixture. Steel balls with 20 mm diameter were used with the 1![[thin space (1/6-em)]](https://www.rsc.org/images/entities/char_2009.gif) :
:![[thin space (1/6-em)]](https://www.rsc.org/images/entities/char_2009.gif) 20 powder to ball ratio and the rotor speed was set to 150 rpm. The milled powder was subsequently pressed into pellets with 13 mm diameter dye under the pressure load of 8 tonnes. The pellets were annealed in an alumina crucible inside a horizontal tube furnace with open ends of the tube (Tetlow Kilns & Furnaces Pty Ltd, Australia) at 785 °C for 6 hours and naturally cooled down to room temperature. The annealed pellets were crushed into powder again with an agate mortar in order to proceed to the temperature-programmed reduction process. Temperature-programmed reduction of the mixed oxide powder was performed in the same tube furnace (Tetlow Kilns & Furnaces Pty Ltd, Australia) under ammonia flow. First, the furnace was heated to approximately 700 °C with the heating rate of 5 °C min−1, kept at that temperature for 3 hours and cooled down to room temperature naturally. The NH3 flow was set to 0.4 l min−1 throughout the experiment. Finally, the sample was passivated with a special gas mixture (Ar with 0.1% O2) for 1 hour at a flow rate of 0.5 l min−1 prior to the exposure to air. In order to compare the electrochemical performance of the bimetallic oxynitride to those of the monometallic compounds, tungsten and molybdenum oxynitrides were synthesised by the temperature-programmed reduction of the corresponding oxides. Synthesis details of the TPR for monometallic oxynitrides are described elsewhere.21,34–37 For simplicity, the synthesised materials are denoted as MoW(N,O), W(N,O) and Mo(N,O).
20 powder to ball ratio and the rotor speed was set to 150 rpm. The milled powder was subsequently pressed into pellets with 13 mm diameter dye under the pressure load of 8 tonnes. The pellets were annealed in an alumina crucible inside a horizontal tube furnace with open ends of the tube (Tetlow Kilns & Furnaces Pty Ltd, Australia) at 785 °C for 6 hours and naturally cooled down to room temperature. The annealed pellets were crushed into powder again with an agate mortar in order to proceed to the temperature-programmed reduction process. Temperature-programmed reduction of the mixed oxide powder was performed in the same tube furnace (Tetlow Kilns & Furnaces Pty Ltd, Australia) under ammonia flow. First, the furnace was heated to approximately 700 °C with the heating rate of 5 °C min−1, kept at that temperature for 3 hours and cooled down to room temperature naturally. The NH3 flow was set to 0.4 l min−1 throughout the experiment. Finally, the sample was passivated with a special gas mixture (Ar with 0.1% O2) for 1 hour at a flow rate of 0.5 l min−1 prior to the exposure to air. In order to compare the electrochemical performance of the bimetallic oxynitride to those of the monometallic compounds, tungsten and molybdenum oxynitrides were synthesised by the temperature-programmed reduction of the corresponding oxides. Synthesis details of the TPR for monometallic oxynitrides are described elsewhere.21,34–37 For simplicity, the synthesised materials are denoted as MoW(N,O), W(N,O) and Mo(N,O).
Characterisation
The morphology of the synthesised material was examined by scanning electron microscopy (SEM, Carl Zeiss SUPRA 55VP). Surface area and porosimetry measurements were performed using a Micrometrics Tristar 3000 analyser. From the low temperature N2 adsorption isotherm, pore size distribution and surface area were calculated by Barrett–Joiner–Helenda (BJH) and Branauer–Emmett–Teller (BET) methods, respectively. A PANalytical X’Pert PRO diffractometer with Cu K-alpha radiation (λ = 0.15418 nm) was used to measure the X-ray diffraction pattern of the material.The transmission electron microscopy (TEM) examination was carried out in an FEI Titan instrument operating at 300 kV accelerating voltage. The TEM instrument is equipped with a scanning unit (STEM), a Gatan Imaging Filter (GIF), and an energy dispersive X-ray (EDX) spectrometer. For energy-filtered TEM (EFTEM) imaging, a three-window method was employed to acquire tungsten, nitrogen, and oxygen elemental distributions.
Electrochemical testing
For the electrochemical characterisation of the synthesised material, electrode slurry was prepared by mixing molybdenum tungsten oxynitride, carbon nanopowder (Sigma-Aldrich, #699632) and poly(vinylidene)fluoride (PVDF, Sigma-Aldrich) in a 90![[thin space (1/6-em)]](https://www.rsc.org/images/entities/char_2009.gif) :
:![[thin space (1/6-em)]](https://www.rsc.org/images/entities/char_2009.gif) 5
5![[thin space (1/6-em)]](https://www.rsc.org/images/entities/char_2009.gif) :
:![[thin space (1/6-em)]](https://www.rsc.org/images/entities/char_2009.gif) 5 ratio. NMP (N-methyl-2-pyrrolidone, anhydrous, 99.5%, Sigma-Aldrich) was used as a solvent. Electrode slurries were coated onto titanium foils and dried in a vacuum at 90 °C overnight in a conventional oven. The weight of the active material on the dried electrodes was between 2 and 4 mg cm−2. Electrodes were assembled into three-electrode cells using a Pt wire as a counter electrode and Ag/AgCl as a reference electrode. Symmetric cells were prepared by immersing two nearly identical electrodes separated by a microporous polyethene film (MTI Corp., USA) into the electrolyte. Cells were filled with 1 M H2SO4 electrolyte under vacuum and characterised by galvanostatic charge–discharge as well as cyclic voltammetry measurements using a Solartron Analytical 1470E potentiostat/galvanostat. The impedance spectroscopy was performed in the symmetric cell configuration at the open circuit potential (OCP) from 50 kHz to 0.05 Hz using an Ivium-n-stat electrochemical analyser. The amplitude of the modulation signal was set to 10 mV. Experimental data were fitted with ZView software.
5 ratio. NMP (N-methyl-2-pyrrolidone, anhydrous, 99.5%, Sigma-Aldrich) was used as a solvent. Electrode slurries were coated onto titanium foils and dried in a vacuum at 90 °C overnight in a conventional oven. The weight of the active material on the dried electrodes was between 2 and 4 mg cm−2. Electrodes were assembled into three-electrode cells using a Pt wire as a counter electrode and Ag/AgCl as a reference electrode. Symmetric cells were prepared by immersing two nearly identical electrodes separated by a microporous polyethene film (MTI Corp., USA) into the electrolyte. Cells were filled with 1 M H2SO4 electrolyte under vacuum and characterised by galvanostatic charge–discharge as well as cyclic voltammetry measurements using a Solartron Analytical 1470E potentiostat/galvanostat. The impedance spectroscopy was performed in the symmetric cell configuration at the open circuit potential (OCP) from 50 kHz to 0.05 Hz using an Ivium-n-stat electrochemical analyser. The amplitude of the modulation signal was set to 10 mV. Experimental data were fitted with ZView software.
Results and discussion
Characterisation
The XRD pattern of the synthesised compound (Fig. 1) shows five diffraction peaks located at 37.4°, 43.3°, 63.0°, 75.9° and 80.0°, matching the diffraction lines of MoWN2.1O2.4 (Powder Diffraction File #: 50-0134). It is in agreement with the assumption that the dominant phase in the sample is molybdenum tungsten oxynitride with a cubic structure.32 The broadening of the diffraction peaks indicates a small crystalline size and a possible high surface area of molybdenum tungsten oxynitride, consistent with the previous reports.32 Indeed, the surface area of 72.6 m2 g−1 is measured by the BET method.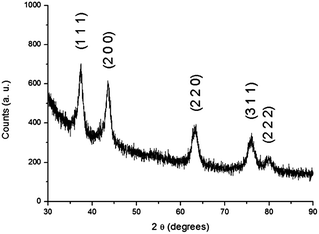 | ||
| Fig. 1 XRD pattern of the synthesised material with the characteristic diffraction peaks of molybdenum tungsten oxynitride (Powder Diffraction File #: 50-0134). | ||
Low temperature nitrogen adsorption–desorption isotherm (Fig. 2a) demonstrates a hysteresis and belongs to type IV, indicating that the material is mesoporous. BJH measurements show a narrow pore size distribution, with the maximum located at around 4 nm (Fig. 2b) and virtually no pores larger than 12 nm are present in the sample.
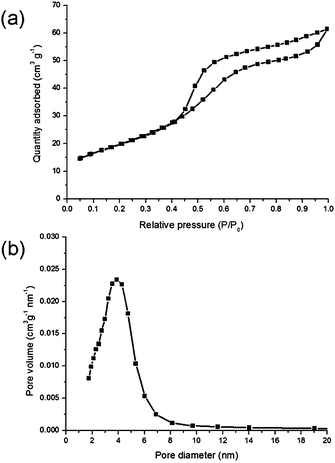 | ||
| Fig. 2 Low temperature nitrogen adsorption measurements: adsorption–desorption isotherm (a) and the pore size distribution (b). | ||
The low magnification SEM image (Fig. 3a) shows that particle sizes of the synthesised powder do not exceed 1 μm, while the high resolution image (Fig. 3b) indicates that particles are porous, with the visible pore sizes less than 10 nm, consistent with the low temperature nitrogen adsorption measurements. In order to characterise the structure of molybdenum tungsten oxynitride in more detail, the synthesised material is investigated by TEM. A bright field TEM images confirms the nanocrystalline structure of the synthesised material (Fig. 3c and e). The electron diffraction pattern (Fig. 3d) shows five diffraction rings, in agreement with the XRD pattern (Fig. 1). EFTEM maps of W, Mo, N and O (Fig. 3f) taken from the area depicted in Fig. 3e show that the elements are distributed throughout the sample.
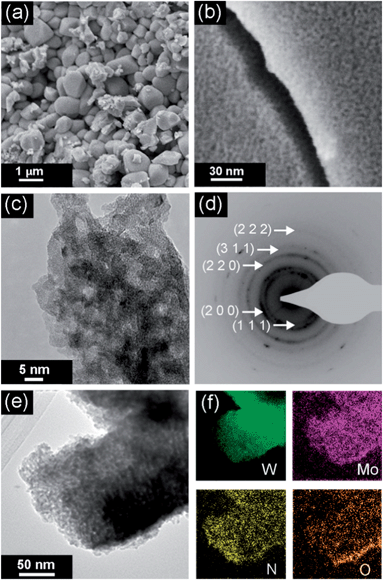 | ||
| Fig. 3 Electron microscopy characterisation: SEM images (a and b); bright field TEM image and the electron diffraction pattern (c and d); a TEM image and the corresponding EFTEM maps depicting the distribution of W, Mo, N and O elements (e and f). | ||
Electrochemical properties
It follows from the analysis of the selected specific capacitance values reported in the literature for the monometallic nitrides and oxynitrides14,19–23,27 of molybdenum and tungsten (Table 1) that the electrochemical properties of these phases vary considerably depending on the precursor and synthesis conditions.| Surface area (m2 g−1) | Precursor for TPR | Potential window (V) | Maximum specific capacitance | Ref. | |
|---|---|---|---|---|---|
| γ-Mo2N | 152 | (NH4)6Mo7O24·4H2O | 0.8 (H2SO4 0.1 M) | 380 F g−1 | 14 |
| γ-Mo2N | 16 | MoO3 | 0.8 (H2SO4 3.5 M) | 125 F g−1 | 23 |
| γ-Mo2N | 98 | — | 0.6 (H2SO4 4.5 M) | 70 F g−1 | 27 |
| γ-Mo2N | — | MoO3 | 1.1 (H2SO4 1 M) | 172 F g−1 | 22 |
| WN | 46.7 | Amorphous W-N | 0.8 (KOH 1M) | 30 F g−1 | 19 |
| W2N | 50.2 | Layered WO3·H2O | 0.8 (KOH 1M) | ∼100 F g−1 | 20 |
| W0.75(N,O) | 42 | WO3 | 0.8 (KOH 1 M) | 57 F g−1 | 21 |
For example, the capacitance of γ-Mo2N may vary in a wide range between 70 and 380 F g−1.14,22,23,27 For consistency, here we compare the electrochemical properties of molybdenum tungsten oxynitride with those of molybdenum and tungsten oxynitrides synthesised from their corresponding oxide powders under similar nitridation conditions (TPR in ammonia with a maximum temperature of 700 °C). The detailed characterisation of these Mo(N,O) and W(N,O) samples is presented elsewhere.37
Cyclic voltammetry (CV) measurements in the three-electrode cell configuration (Fig. 4a) indicate that the operating potential window of molybdenum tungsten oxynitride is between −0.2 and 0.55 V vs. Ag/AgCl in 1 M H2SO4 aqueous electrolyte. The CV curves have nearly rectangular shapes at various scan rates, with small reversible redox peaks present in cyclic voltammograms, typical for pseudocapacitive materials.
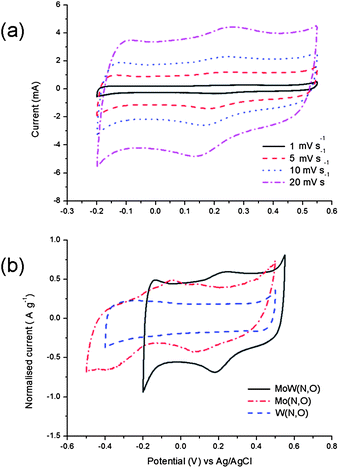 | ||
| Fig. 4 Electrochemical characterisation of MoW(N,O) as a supercapacitor electrode material in 1 M H2SO4 electrolyte. Cyclic voltammetry measurements (third cycle) at various scan rates (a) and CV of the bimetallic oxynitride compared to the cyclic voltammograms of the monometallic compounds at a scan rate of 5 mV s−1; the current is normalised with the weight of the active material (b). | ||
It could be observed that the operating potential window of the bimetallic oxynitride as well as the shape of the CV curves in 1 M H2SO4 electrolyte differ from both molybdenum and tungsten monometallic compounds synthesised from the pure oxide precursors (Fig. 4b). In fact, tungsten oxynitride produced from the WO3 precursor has an ideal rectangular CV curve in the voltage window between −0.4 and 0.5 V vs. Ag/AgCl with no visible redox peaks, while molybdenum oxynitride synthesised from the MoO3 precursor operates between −0.5 and 0.5 V vs. Ag/AgCl and possesses several redox peaks as well as a less rectangular cyclic voltammogram (Fig. 4b).
The shape of the galvanostatic charge and discharge curves (Fig. 5a) is close to triangular. This shape is preserved when increasing the current load from 0.5 to 10 A g−1, although an IR drop is observed at high currents. 43% of the capacitance is retained upon increasing the current density from 0.05 to 20 A g−1. The maximum reversible specific capacitance value measured at 0.05 A g−1 in 1 M H2SO4 electrolyte is 124 F g−1 (172 μF cm−2). This value is orders of magnitude higher when compared to the typical 20–50 μF cm−2, characteristic of the electrical double layer charge storage mechanism,38 indicating the presence of pseudocapacitive processes.39 Cyclic stability measurements (Fig. 6) reveal that molybdenum tungsten oxynitride retains 46% of its initial capacitance after 5000 galvanostatic charge and discharge cycles at a current load of 5 A g−1.
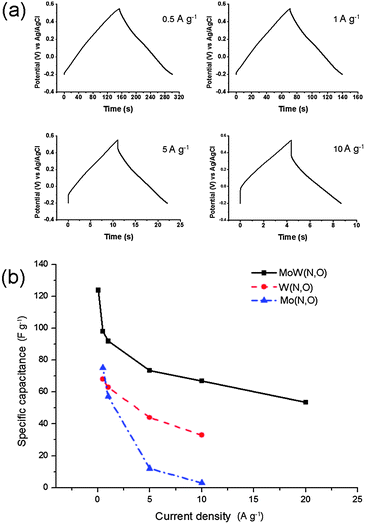 | ||
| Fig. 5 Galvanostatic charge and discharge curves of molybdenum tungsten oxynitride (a) and its rate capability in 1 M H2SO4 electrolyte (b). Rate capabilities of molybdenum and tungsten oxynitrides are given for comparison in (b). | ||
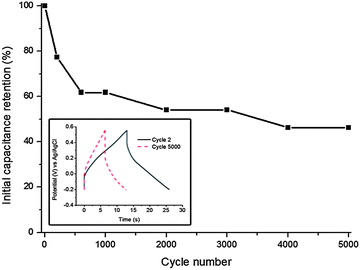 | ||
| Fig. 6 Cyclic stability of molybdenum tungsten oxynitride in 1 M H2SO4 electrolyte cycled at a current load of 5 A g−1: initial capacitance retention and galvanostatic charge and discharge curves (inset). | ||
It can be noted that, at the same charge–discharge current densities, the bimetallic compound possesses higher specific capacitance values as well as a better rate capability when compared to both oxynitrides synthesised from MoO3 or WO3 (Fig. 5b). At a high current load of 10 A g−1, MoW(O,N) possesses a specific capacitance of 67 F g−1, twice the corresponding value for tungsten oxynitride,21 while the capacitance of molybdenum oxynitride quickly fades and reaches only 2 F g−1 at a current density of 10 A g−1. In order to investigate the difference between the electrochemical performances of the samples further, the electrochemical impedance spectroscopy data were collected for molybdenum tungsten oxynitride electrodes and compared to the corresponding data measured for the monometallic compounds.
Nyquist plots of the impedance spectra are presented in Fig. 7a–c. A depressed semi-circle is observed at high frequencies, attributed to the charge transfer resistance and the double layer charging of the electrode surface, followed by an inclined straight line, characteristic of the Warburg region.40–43 In order to describe the impedance at high-medium frequencies, experimental data are fitted to a Randles-type equivalent circuit (Fig. 7d), where the double layer capacitance as well as the diffusion impedance within the pores of the electrode material are represented by constant phase elements (CPE).43–45 The proposed equivalent circuit fits the experimental data well in the high-frequency region (Fig. 7d).
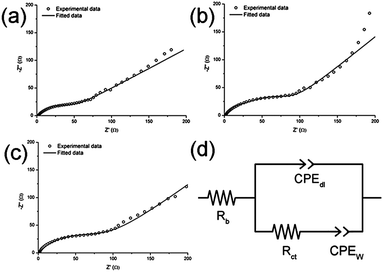 | ||
| Fig. 7 Nyquist plots of the impedance spectra of molybdenum tungsten (a), tungsten (b) and molybdenum (c) oxynitrides and the equivalent circuit used to fit the experimental data (d). | ||
The equivalent circuit contains the following variables: the bulk resistance (Rb), distributed double-layer capacitance within the pores (CPEdl), charge transfer resistance (Rct) and the diffusion impedance in the porous electrode (CPEW). Equivalent circuit data are fitted with ZView software and are summarised in Table 2. The impedance of the CPE element is defined as:40,43
 | (1) |
| R b (Ω) | R ct (Ω) | R W (Ω)/α (−) | C dl (F)/α (−) | |
|---|---|---|---|---|
| MoW(N,O) | 1.6 | 60.5 | 111/0.46 | 0.00059/0.61 |
| Mo(N,O) | 1.0 | 90.8 | 141/0.50 | 0.00039/0.68 |
| W(N,O) | 1.2 | 101.3 | 118/0.58 | 0.00056/0.66 |
The charge transfer resistance Rct represents the charge transfer resistance at the electrode–electrolyte interface. More specifically, the charge transfer reaction is often determined by the rate of electron transfer towards the interface, and is associated with intrinsic properties if the active electrode material such as the electronic conductivity, since electrons are the reactants in the charge transfer process.40–43 The lowest value of Rct for molybdenum tungsten oxynitride electrodes could be attributed to their superior electronic conductivity in respect to those of both monometallic compounds.
Symmetric cell
The assembled supercapacitor devices could be classified into several categories according to the cell design and active materials used.30,46,47 In this work, two molybdenum tungsten oxynitride electrodes were tested in the symmetric configuration as an approximation of a real device.The cyclic voltammetry curve demonstrates an ideal rectangular shape in the potential range between 0 and 0.75 V in 1 M H2SO4 electrolyte at the scan rates of 1, 5, 10 and 20 mV s−1 (Fig. 8a). Interestingly, no redox peaks can be observed in the cyclic voltammograms of the symmetric device. Galvanostatic charge and discharge curves form nearly ideal triangular shapes (Fig. 8b) at the current densities of 0.5, 1, 5, and 10 A g−1, with a small IR drop being observed at 10 A g−1. The maximum specific capacitance value, measured at a current load of 0.05 A g−1, is 23 F g−1 and approximately 50% of this value is maintained when increasing the current density from 0.05 to 20 A g−1 (Fig. 8c).
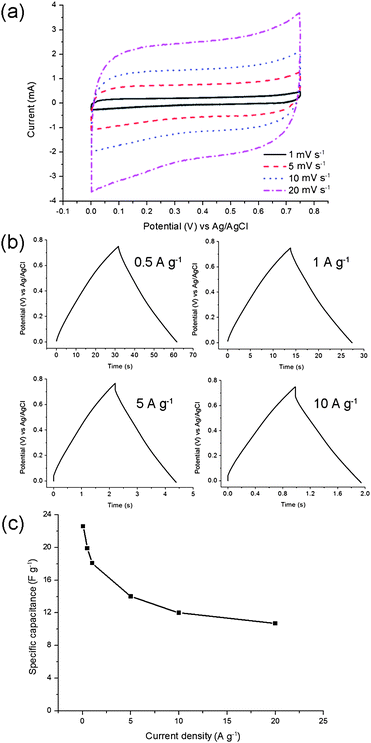 | ||
| Fig. 8 Molybdenum tungsten oxynitride electrodes in a symmetric cell. Cyclic voltammetry measurements at the scan rates of 1, 5, 10 and 20 mV s−1 (a); galvanostatic charge and discharge curves at different current densities (b); the rate capability at the current densities between 0.05 and 20 A g−1 (c). | ||
Conclusions
Bimetallic molybdenum tungsten oxynitride has been synthesised by a TPR in ammonia and extensively characterised by XRD, low-temperature N2 adsorption, SEM and TEM. XRD and TEM analyses indicate that the synthesised material consists of a molybdenum tungsten oxynitride phase and no obvious unreacted oxide is present in the sample. It has been concluded that the material has mesoporous morphology with the maximum of the pore size distribution at around 4 nm. Mo, W, N and O elements are distributed throughout the sample. Electrochemical characteristics of MoW(N,O) in 1 M H2SO4 aqueous electrolyte differ from both molybdenum and tungsten monometallic oxynitrides synthesised under similar experimental conditions. The material demonstrates a capacitance of 124 F g−1 at a current density of 0.05 A g−1 in galvanostatic charge–discharge experiments. 43% of this capacitance can be retained upon the 400-fold increase in the current density from 0.05 to 20 A g−1. The symmetric cell with two molybdenum tungsten oxynitride electrodes exhibits a capacitance of 23 F g−1 and is able to operate up to a high current of 20 A g−1.Acknowledgements
This research project is supported by the ARC Centre of Excellence for Functional Nanomaterials, an ARC Discovery grant and a grant from Deakin University (Central Research Grant Scheme). The authors thank Mr Robert Lovett and Dr Andrew Sullivan for their help. The authors also thank Dr Mick Fielding for his contribution in creating the cover artwork.Notes and references
- L. E. Toth, Transition Metal Carbides and Nitrides, Academic Press, New York, 1971 Search PubMed.
- M. Wu, Q. Zhang, J. Xiao, C. Ma, X. Lin, C. Miao, Y. He, Y. Gao, A. Hagfeldt and T. Ma, J. Mater. Chem., 2011, 21, 10761 RSC.
- Y. Wang, M. Wu, X. Lin, Z. Shi, A. Hagfeldt and T. Ma, J. Mater. Chem., 2012, 22, 4009 RSC.
- G. R. Li, J. Song, G. L. Pan and X. P. Gao, Energy Environ. Sci., 2011, 4, 1680 CAS.
- Y. Wang, R. Ohnishi, E. Yoo, P. He, J. Kubota, K. Domen and H. Zhou, J. Mater. Chem., 2012, 22, 15549 RSC.
- S. Dong, X. Chen, K. Zhang, L. Gu, L. Zhang, X. Zhou, L. Li, Z. Liu, P. Han, H. Xu, J. Yao, C. Zhang, X. Zhang, C. Shang, G. Cui and L. Chen, Chem. Commun., 2011, 47, 11291 RSC.
- Q. Sun and Z.-W. Fu, Electrochim. Acta, 2008, 54, 403 CrossRef CAS.
- Q. Sun and Z.-W. Fu, Electrochem. Solid-State Lett., 2007, 10, A189 CrossRef CAS.
- Z.-W. Fu, Y. Wang, X.-L. Yue, S.-L. Zhao and Q.-Z. Qin, J. Phys. Chem. B, 2004, 108, 2236 CrossRef CAS.
- B. Das, M. V. Reddy, G. V. Subba Rao and B. V. R. Chowdari, RSC Adv., 2012, 2, 9022 RSC.
- B. Das, M. V. Reddy, G. V. Subba Rao and B. V. R. Chowdari, J. Mater. Chem., 2012, 22, 17505 RSC.
- B. Das, M. V. Reddy, P. Malar, T. Osipowicz, G. V. Subba Rao and B. V. R. Chowdari, Solid State Ionics, 2009, 180, 1061 CrossRef CAS.
- B. Das, M. V. Reddy and B. V. R. Chowdari, Nanoscale, 2013, 5, 1961 RSC.
- P. Pande, P. G. Rasmussen and L. T. Thompson, J. Power Sources, 2012, 207, 212 CrossRef CAS.
- D. Choi, G. E. Blomgren and P. N. Kumta, Adv. Mater., 2006, 18, 1178 CrossRef CAS.
- X. Zhou, H. Chen, D. Shu, C. He and J. Nan, J. Phys. Chem. Solids, 2009, 70, 495 CrossRef CAS.
- A. M. Glushenkov, D. Hulicova-Jurcakova, D. Llewellyn, G. Q. Lu and Y. Chen, Chem. Mater., 2010, 22, 914 CrossRef CAS.
- F. Cheng, C. He, D. Shu, H. Chen, J. Zhang, S. Tand and D. E. Finlow, Mater. Chem. Phys., 2011, 131, 268 CrossRef CAS.
- D. Choi and P. N. Kumta, J. Am. Ceram. Soc., 2007, 90, 3113 CrossRef CAS.
- A.-R. Ko, S.-B. Han, Y.-W. Lee and K.-W. Park, Phys. Chem. Chem. Phys., 2011, 13, 12705 RSC.
- O. Kartachova, A. M. Glushenkov, Y. Chen, H. Zhang, X. J. Dai and Y. Chen, J. Power Sources, 2012, 220, 298 CrossRef CAS.
- X. L. Li, Y. Xing, H. Wang, H. L. Wang, W. D. Wang and X. Y. Chen, Trans. Nonferrous Met. Soc. China, 2009, 19, 620 CrossRef CAS.
- C. Z. Deng and K. C. Tsai, in Proceedings of the Symposium on Electrochemical Capacitors II, ed. M. F. Delnick, Electrochemical Society, Pennington, 1997, vol. 96–25, pp. 75–84 Search PubMed.
- C. Chen, D. Zhao, D. Xu and X. Wang, Mater. Chem. Phys., 2006, 95, 84 CrossRef CAS.
- D. Choi and P. N. Kumta, J. Electrochem. Soc., 2006, 153, A2298 CrossRef CAS.
- S. Dong, X. Chen, L. Gu, X. Zhou, H. Xu, H. Wang, Z. Liu, P. Han, J. Yao, L. Wang, G. Cui and L. Chen, ACS Appl. Mater. Interfaces, 2011, 3, 93 CAS.
- M. Wixom, L. Owens, J. Parker, J. Lee, I. Song and L. Thompson, Proceedings of the Symposium on Electrochemical Capacitors II, 1997, vol. 96, p. 63 Search PubMed.
- X. Zhou, C. Shang, L. Gu, S. Dong, X. Chen, P. Han, L. Li, J. Yao, Z. Liu, H. Xu, Y. Zhu and G. Cui, ACS Appl. Mater. Interfaces, 2011, 3, 3058 CAS.
- R. Kötz and M. Carlen, Electrochim. Acta, 2000, 45, 2483 CrossRef.
- M. Conte, Fuel Cells, 2010, 10, 806 CrossRef CAS.
- Y. Li, Y. Zhang, R. Raval, C. Li, R. Zhai and Q. Xin, Catal. Lett., 1997, 48, 239 CrossRef CAS.
- C. C. Yu and S. T. Oyama, J. Mater. Sci., 1995, 30, 4037 CrossRef CAS.
- C. C. Yu, S. Ramanathan, F. Sherif and S. T. Oyama, J. Phys. Chem., 1994, 98, 13038 CrossRef CAS.
- L. Volpe and M. Boudart, J. Solid State Chem., 1985, 59, 332 CrossRef CAS.
- S. Li, W. B. Kim and J. S. Lee, Chem. Mater., 1998, 10, 1853 CrossRef CAS.
- J. B. Claridge, A. P. E. York, A. J. Brungs and M. L. H. Green, Chem. Mater., 2000, 12, 132 CrossRef CAS.
- C. Pozo-Gonzalo, O. Kartachova, A. A. J. Torriero, P. C. Howlett, A. M. Glushenkov, D. Fabijanic, Y. Chen, S. Poissonnet and M. Forsyth, Electrochim. Acta, 2013, 103, 151 CrossRef.
- A. G. Pandolfo and A. F. Hollenkamp, J. Power Sources, 2006, 157, 11 CrossRef CAS.
- B. E. Conway, V. Briss and J. Wojtowicz, J. Power Sources, 1997, 66, 1 CrossRef CAS.
- C. Jo, I. Hwang, J. Lee, C. W. Lee and S. Yoon, J. Phys. Chem. C, 2011, 115, 11880 CAS.
- W. Sugimoto, H. Iwata, K. Yokoshima, Y. Murakami and Y. Takasu, J. Phys. Chem. B, 2005, 109, 7330 CrossRef CAS.
- S.-E. Chun, S.-I. Pyun and G.-J. Lee, Electrochim. Acta, 2006, 51, 6479 CrossRef CAS.
- V. F. Lvovich, Impedance Spectroscopy: Applications to Electrochemical and Dielectric Phenomena, John Wiley and Sons, Inc., Hoboken, 2012 Search PubMed.
- R. de Levie, Electrochim. Acta, 1963, 8, 751 CrossRef.
- G. J. Brug, A. L. G. van den Eeden, M. Sluyters-Rehbach and J. H. Sluyters, J. Electroanal. Chem., 1984, 176, 275 CrossRef CAS.
- B. E. Conway, Electrochemical Supercapacitors: Scientific Fundamentals and Technological Applications, Kluwer Academic, New York, 1999 Search PubMed.
- P. Simon and Y. Gogotsi, Nat. Mater., 2008, 7, 845 CrossRef CAS.
| This journal is © The Royal Society of Chemistry 2013 |
