 Open Access Article
Creative Commons Attribution 3.0 Unported Licence
Large-scale synthesis of hexagonal corundum-type In2O3 by ball milling with enhanced lithium storage capabilities
Dan
Liu
a,
Weiwei
Lei
*a,
Si
Qin
a,
Liting
Hou
b,
Zongwen
Liu
c,
Qiliang
Cui
d and
Ying
Chen
*a
aInstitute for Frontier Materials, Deakin University, Geelong Waurn Ponds Campus, Victoria 3216, Australia. E-mail: weiwei.lei@deakin.edu.au; ian.chen@deakin.edu.au
bAdvanced Technology & Materials Co. Ltd, Beijing 100081, People's Republic of China
cAustralian Key Centre for Microscopy and Microanalysis University of Sydney, NSW 2006, Australia
dState Key Laboratory of Superhard Materials, Jilin University, Changchun 130012, People's Republic of China
First published on 28th February 2013
Abstract
Hexagonal corundum-type indium oxide (h-In2O3) is the structure that normally exists in a high-temperature and pressure environment. This structure has been realised from ambient environment stable cubic indium oxide (c-In2O3) using a high-energy ball milling approach at room temperature, in which the rearrangements of InO6 polyhedral units take place via plastic deformation and large defect creation during the milling process. More interestingly, the high-temperature h-In2O3 structure as anode materials in lithium-ion batteries exhibits lithium storage capabilities enhanced by up to 8 times compared to the c-In2O3 phase. This study demonstrates an effective ambient environmental approach for the production of high-pressure/temperature structures, h-In2O3, which may be extended to explore new phases and novel properties in other oxide systems.
Introduction
Metal oxides have recently attracted particular attention because of their unique physical and chemical properties.1–3 As an important functional material, indium oxide (In2O3), an n-type semiconducting binary oxide with a wide band-gap (3.5–3.7 eV), has attracted much interest for several decades due to its high electrical conductivity and good optical transparency.4,5 There are three different crystal structures of In2O3: cubic bixbyite-type (c-In2O3) stable under ambient conditions, hexagonal corundum-type (h-In2O3) and orthorhombic Rh2O3(II)-type structures stable only under high pressures and temperatures.6 Most previous research has been performed on the most stable c-In2O3 of specific morphologies for enhancing their properties using various techniques.7–9 With the recent report by Idota et al. that some tin-based oxides exhibit high capacities in lithium ion batteries (LIBs), new opportunities seem to be opening for exploring new anode materials based on metal oxide materials.10 The electrochemical reactivity of c-In2O3 with lithium at room temperature has been investigated because of its high theoretical capacities.11–14 The reversible lithium storage performance of h-In2O3 has not been reported so far.h-In2O3 has been found to exhibit stable electric conductivity and high sensitivity to gases, compared to c-In2O3. However, the synthesis of h-In2O3 is very difficult because of the very high temperature and pressure synthesis conditions.15–18 There are two main methods for fabricating h-In2O3 in the literature: the static or shock-induced phase transformation method involving high pressures (>15.3 GPa) or high temperatures and high pressures (>1000 °C and >6.5 GPa)6,19,20 and special chemical methods under ambient pressure.15,18,21,22 These methods need not only an elevated temperature for the decomposition of metal salts, but also complex reaction conditions, which are disadvantageous from the manufacturing point of view.
In this letter, a large-scale and room-temperature production approach is demonstrated. The high-pressure phase h-In2O3 can be produced from the c-In2O3 phase via a high-energy ball milling process at room temperature. The low-environmental footprint synthesis method is based on a simple mechanical milling process with advantages of medium pressure range, low production temperature, and no need of any solvents and catalysts. More interestingly, the h-In2O3 phase exhibits enhanced reversible storage capacity up to 8 times higher and good cycling performance in lithium ion batteries compared to the initial c-In2O3, indicating the advantages of high-pressure structures as electrode materials for energy storage.
Experimental section
Synthesis of h-In2O3 powders
In a typical process, 9 g of c-In2O3 powders (99.995%, Alfa Aesar) were loaded into a stainless steel container with four hardened steel balls (diameter of 25 mm), and then filled with N2–15%H2 gas to a pressure of 300 kPa. A vertical rotating ball mill was used for the milling experiments under high-energy impact mode, which was realized by placing an external magnet under the container at a 45° position in relation to the vertical direction and the use of the mill rotation speed around 150 rpm.23 The temperature of the container surface was about 40 °C during the milling process. The milling action was turned off every 2 days for 2 h for cooling purposes.Characterization
The phase changes of milled samples were monitored with an X-ray powder diffraction (XRD) spectrometer (Panalytical X'Pert PRO system) using Cu Kα radiation at a wavelength of 1.5418 Å. Simulation and analysis of the XRD patterns of various phases were performed using the Material Studio program. Unit-cell parameters were obtained using DICVOL91, and structure refinement was carried out using the Pawley method.24 Scanning electron microscopy (SEM) analysis was performed on a Zeiss Supra 55 VP instrument. Transmission electron microscopy (TEM) analysis was performed on a JEOL 2100 (operating at 110 kV) apparatus. High resolution TEM studies were carried out with a JEOL JEM 2011 LaB6 (operating at 200 kV) instrument. Raman spectra were recorded on a Horiba Jobin Yvon Raman microscope in a backscattering geometry at the 532 nm line of an argon ion laser, provided with a CCD detector system.Electrochemical measurements
The working electrodes of Li-ion battery cells were fabricated by mixing 70 wt% active material (h-In2O3 powders), 15 wt% acetylene black (Super-P), and 15 wt% polyvinylidene fluoride (PVDF) binder in N-methyl-2-pyrrolidone (NMP) to form homogeneous slurry. A thin layer of the slurry was coated on Cu foil to form the anode electrode; the electrode was dried overnight at 120 °C in vacuum to remove the solvent. Coin cells (CR2032) were assembled using Li metal as the counter electrode in a dry glove box filled with argon. The electrolyte consisted of 1 M LiPF6 in a non-aqueous solution of ethylene carbonate and dimethyl carbonate in a volume ratio of 1![[thin space (1/6-em)]](https://www.rsc.org/images/entities/char_2009.gif) :
:![[thin space (1/6-em)]](https://www.rsc.org/images/entities/char_2009.gif) 1. Cyclic voltammetry (CV) measurements were carried out using a Solartron 1470E electrochemical workstation at a scanning rate of 0.1 mV s−1. A galvanostatic cycling test of the assembled cells was performed using the voltage window of 0.01–3.0 V versus Li/Li+.
1. Cyclic voltammetry (CV) measurements were carried out using a Solartron 1470E electrochemical workstation at a scanning rate of 0.1 mV s−1. A galvanostatic cycling test of the assembled cells was performed using the voltage window of 0.01–3.0 V versus Li/Li+.
Results and discussion
Typical XRD patterns of In2O3 were collected and are plotted in Fig. 1 as a function of milling time. All diffraction peaks of the initial material can be indexed to a pure cubic bixbyite-type structure (Ia![[3 with combining macron]](https://www.rsc.org/images/entities/char_0033_0304.gif) ) In2O3 (c-In2O3) crystal with space group no. 206, lattice constants a = b = c = 10.11(1) Å, and unit cell volume V0 = 64.8(1) Å3, in good agreement with those previously reported in the literature.25 As shown in Fig. 2a, it has two different types of In3+ (In1 and In2) occupying both octahedral and trigonal prismatic interstices within the lattice of O2− ions, and O atoms at the 8b, 24d, and 48e Wyckoff positions, respectively (inset of Fig. 2a). No changes were observed in the XRD patterns of the samples after milling for 2 and 4 days except peak intensity reduction and shape broadening. The significant peak shape changes are caused by grain size reduction and structural distortion as the typical effect of ball milling treatment. Three new diffraction peaks emerging around 32.8, 57.7, and 58.9° are indicative of a transformation to a new phase after milling for 6 days.
) In2O3 (c-In2O3) crystal with space group no. 206, lattice constants a = b = c = 10.11(1) Å, and unit cell volume V0 = 64.8(1) Å3, in good agreement with those previously reported in the literature.25 As shown in Fig. 2a, it has two different types of In3+ (In1 and In2) occupying both octahedral and trigonal prismatic interstices within the lattice of O2− ions, and O atoms at the 8b, 24d, and 48e Wyckoff positions, respectively (inset of Fig. 2a). No changes were observed in the XRD patterns of the samples after milling for 2 and 4 days except peak intensity reduction and shape broadening. The significant peak shape changes are caused by grain size reduction and structural distortion as the typical effect of ball milling treatment. Three new diffraction peaks emerging around 32.8, 57.7, and 58.9° are indicative of a transformation to a new phase after milling for 6 days.
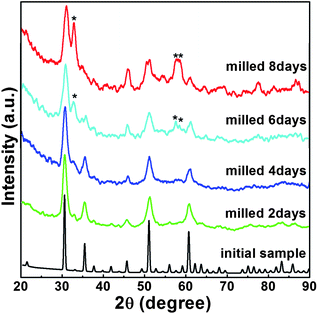 | ||
| Fig. 1 XRD patterns of the In2O3 recorded at different milling times. | ||
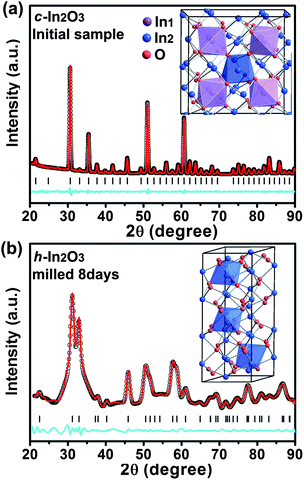 | ||
| Fig. 2 Pawley full-profile refinements of the diffraction patterns collected from the In2O3 powders before milling (a) and after milling for 8 days (b). In the case of the high pressure phase, a good fitting with Rwp = 5.2% is obtained for the diffraction pattern in (b). Red, black, blue solid lines, and tick marks represent experimental, calculated, residual patterns, and the positions of calculated Bragg reflections, respectively. The insets show the respective crystal structure, and the different types of indium atoms are marked with different colors. | ||
With further milling up to 8 days, the diffraction patterns of the sample show distinctive features indicating phase transition completion (Fig. 1). The Pawley refinement for this new phase using an R![[3 with combining macron]](https://www.rsc.org/images/entities/char_0033_0304.gif) c structural model yields a very good fit with Rwp = 5.2% (Fig. 2b) corresponding to the high pressure and high temperature h-In2O3. The lattice parameters refined within this space group for the new phase are a = 5.438(2) Å, c = 14.474(3) Å, and unit cell volume V0 = 61.78(1) Å3 (Z = 6). h-In2O3 has a different atomic arrangement, containing only trigonal biprism coordinated In3+ ions within the lattice of O2− ions, with O atoms located at Wyckoff positions 12c and 18e, as shown in Fig. 2b. It can be explained that plastic deformation and increased defect concentrations created by ball milling play important roles in the occurrence of phase transformations in the In2O3 system. This mechanical activation initiates the lattice change of O2− ions and the shift of In3+ ions from octahedral and trigonal prismatic to trigonal biprism sites (Fig. 2), resulting in distortion and redistribution of InO6 octahedra units which are the building blocks of the h-In2O3 structure.
c structural model yields a very good fit with Rwp = 5.2% (Fig. 2b) corresponding to the high pressure and high temperature h-In2O3. The lattice parameters refined within this space group for the new phase are a = 5.438(2) Å, c = 14.474(3) Å, and unit cell volume V0 = 61.78(1) Å3 (Z = 6). h-In2O3 has a different atomic arrangement, containing only trigonal biprism coordinated In3+ ions within the lattice of O2− ions, with O atoms located at Wyckoff positions 12c and 18e, as shown in Fig. 2b. It can be explained that plastic deformation and increased defect concentrations created by ball milling play important roles in the occurrence of phase transformations in the In2O3 system. This mechanical activation initiates the lattice change of O2− ions and the shift of In3+ ions from octahedral and trigonal prismatic to trigonal biprism sites (Fig. 2), resulting in distortion and redistribution of InO6 octahedra units which are the building blocks of the h-In2O3 structure.
To further examine the different crystalline structures of the milled In2O3, Raman spectroscopy measurements were performed on the samples before and after milling for 8 days. Group theory predicts the following representation for the center of Brillouin zone (q = 0) optical vibrational modes of c-In2O3.26 The irreducible representation is given as
| Γ = 4Ag + 4Eg + 14Tg + 5Au +5Eu +16Tu |
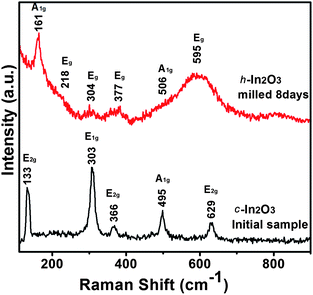 | ||
| Fig. 3 Micro-Raman spectra of In2O3 powders before milling and after milling for 8 days in the 100–900 cm−1 frequency regions. | ||
The SEM image (Fig. 4a) shows that most h-In2O3 particles are spherical and have diameters in the range of 0.1–1 μm. The histogram (Fig. 4b) shows that most particles have a diameter around 200 nm. The TEM image in Fig. 5a shows typical morphology and sizes of the starting c-In2O3 particles. The high-resolution TEM image in Fig. 5b presents an interdistance of 0.407 nm between the parallel fringes corresponding to the d-spacing of the (211) plane of c-In2O3. The TEM image presented in Fig. 5c reveals the smaller particle and grain sizes of h-In2O3 particles. A typical selected area diffraction (SAD) pattern is shown in Fig. 5c. All electron diffraction rings can be indexed to the h-In2O3 phase which is consistent with the XRD analysis results. The HRTEM image (Fig. 5d) of an h-In2O3 particle shows the interdistance of the fringes of 0.283 nm, in agreement with the lattice distance of the (104) planes of the h-In2O3. These results further confirm the phase transition from c-In2O3 to h-In2O3 during the high-energy ball milling process.
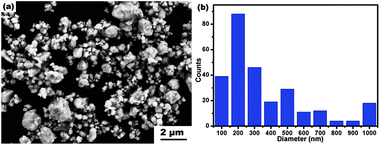 | ||
| Fig. 4 SEM image of h-In2O3 particles (a) and histogram of diameter distribution of the particles (b). | ||
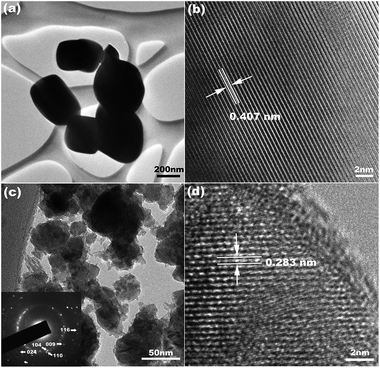 | ||
| Fig. 5 TEM images of the In2O3 powders (a) before milling and (c) after milling for 8 days; the SAD pattern corresponding to part c is shown in the inset. HRTEM images of the In2O3 powders (b) before milling and (d) after milling for 8 days. | ||
It is well known that energy barriers often exist in chemical reactions and phase transformations. The reaction or transformation becomes possible when sufficient energy is provided to overcome these barriers. A huge energy barrier should exist for the transformation from c to h-In2O3 as it normally takes place at high temperatures and high pressures.5 In the case of the room-temperature milling process, a huge amount of energy is injected into the materials by repeated high-energy impacts and the energy is stored in the form of structural defects and large surface energy. After 6 days of milling, when the stored energy in the system is sufficiently high, c to h-In2O3 transformation takes place even at room temperature. Continuous milling is still needed to help with transformation kinetics until full transformation at the end of 8 days.28–30
The electrochemical performance of the h-In2O3 in the cell configuration of Li/h-In2O3 was evaluated. The CV measurement (Fig. 6a) was carried out to investigate the electrode reaction processes at a scan rate of 0.1 mV s−1. In the first cycle, two apparent peaks are observed at 0.58 V and 1.06 V in the discharge process. The peak at 0.58 V could be assigned to the formation of LixIn alloy proceeding in a multi-step process during lithium insertion.12,13 These two peaks disappear in further cycles, indicating the irreversible reduction of h-In2O3 with a large irreversible capacity in the first cycle. New reduction peaks at 0.78 and 0.46 V appear after the first cycle and shift to a lower voltage during further cycles. Two oxidation peaks at 0.51 and 0.70 V could be ascribed to the de-alloying of Li/In which form in the discharge process. Another two broad oxidation peaks at 1.18 and 1.78 V are observed, which may be ascribed to the reverse alloying reaction among LixIn alloys of different stoichiometry and the further formation of metallic phase indium. These two peaks fade away quickly after the first several cycles indicating the poor reversibility of this reaction. Fig. 6b shows the 1st, 2nd, 5th, and 50th cycles charge–discharge curves of the h-In2O3 at a constant current density of 30 mA g−1 and a cutoff voltage window of 3.0 and 0.01 V. The curves show different plateaus due to the redox reactions associated with Li+ insertion and extraction and are consistent with the CV results. The ramp above 0.87 V in the discharge curve possibly derives from the irreversible reduction of h-In2O3. The discharge plateaus around 0.42 V indicate the formation of LixIn alloy phases and the charge plateaus around 0.69 V are also in agreement with the cyclic voltammogram profile.
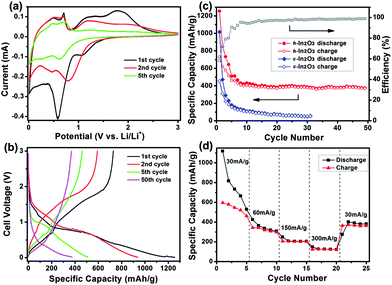 | ||
| Fig. 6 Electrochemical properties of h-In2O3: (a) cyclic voltammogram of the h-In2O3 electrode; (b) discharge–charge voltage curves under a current density of 30 mA g−1; (c) cycling performance and coulombic efficiency of h-In2O3 and initial c-In2O3 at 30 mA g−1 for 50 and 30 cycles, respectively; (d) rate performance of h-In2O3 at rates from 30 to 300 mA g−1. | ||
The h-In2O3 electrode delivers initial discharge–charge capacities of 1256 and 729 mA h g−1, respectively, which are higher than the corresponding capacities (1016 and 453 mA h g−1) from c-In2O3 as shown in Fig. 6c. Subsequently, the charge and discharge capacities of the h-In2O3 electrode approach a constant level at about 390 mA h g−1 after 50 cycles with a coulombic efficiency of 98.8%. This reversible capacity is much higher than that of the c-In2O3 (49 mA h g−1) electrode after 30 cycles and some other oxides such as MnO2 (about 200 mA h g−1 after 10 cycles),31 Co3O4 (about 200 mA h g−1 after 20 cycles)32 and Mn3O4 (below 200 mA h g−1 after 10 cycles).33 In addition to the improved reversible capacity and excellent cycling behavior of the h-In2O3, the rate capabilities at various current rates from 30 to 300 mA g−1 are illustrated in Fig. 6d. A reversible capacity of 125 mA h g−1 can be sustained at the highest current rate of 300 mA g−1. A capacity of 382 mA h g−1 at 30 mA g−1 is retained after 25 cycles of charge and discharge at various current densities, demonstrating good reversibility and structural stability of the h-In2O3.
The better performance in terms of capacity and cyclability of h-In2O3 compared to c-In2O3 may be attributed to three aspects. First, the structure of c-In2O3 is composed of an edge-connected network of InO6 octahedra and trigonal prisms, as shown in Fig. 7a, in which Li ions occupy the interstitial sites in this lattice framework. Consequently, the restricted Li diffusion in three-dimensional volume leads to poor electrochemical performance of c-In2O3 as the LIB anode. In contrast, the h-In2O3 structure consists of a three-dimensional array of edges and corners sharing InO6 trigonal prisms, giving rise to channels and cavities perpendicular to the c-axis (Fig. 7b) and these channels provide elegant pathways for diffusion and storage of Li-ions. Second, the h-In2O3 has a better electrical conductivity than c-In2O3 which is advantageous for high capacity and fast charging and discharging processes.34 Third, the large quantities of defects and smaller grain size in the h-In2O3 particles, as shown in Fig. 5d, not only provide additional sites for the insertion of Li ions, but also facilitate the diffusion of ions.35 All these properties suggest that h-In2O3 is an outstanding candidate for anode materials of LIBs.
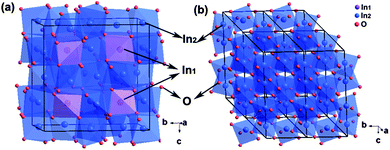 | ||
| Fig. 7 Polyhedral representations of (a) c-In2O3 and (b) h-In2O3, perpendicular to the c-axis. | ||
Conclusions
High-energy ball milling is a high yield, less hazardous and straightforward route to produce the h-In2O3 from c-In2O3 at room temperature. The structural transition is supported by XRD analysis, Raman measurements, and HRTEM examinations. The structural relationships and the possible transformation mechanisms can be explained in terms of the continuous topological variation of atom coordination or continuous displacement of the atoms induced by distortion and redistribution of InO6 polyhedra units under high-energy milling impacts. As anode materials for lithium-ion batteries the h-In2O3 exhibits an enhanced and stable capacity of 390 mA h g−1 (after 50 cycles) compared to c-In2O3 (49 mA h g−1, after 30 cycles). The high energy ball milling method can induce solid-state phase transformations and produce new metastable structures with enhanced or new properties.Acknowledgements
The authors acknowledge the financial support from the Australian Research Council under the Centre of Excellence program and Deakin University's Alfred Deakin Postdoctoral Research Fellowship and Central Research Grant Scheme (CRGS). Dr Dan Liu thanks Dr Hongwei Liu for HRTEM support.Notes and references
- D. Portehault, S. Cassaignon, E. Baudrin and J. P. Jolivet, J. Mater. Chem., 2009, 19, 7947 RSC.
- J. K. Zhang, Y. H. Han, C. L. Liu, W. B. Ren, Y. Li, Q. L. Wang, N. N. Su, Y. Q. Li, B. H. Ma, Y. Z. Ma and C. X. Gao, J. Phys. Chem. C, 2011, 115, 20710 CAS.
- Z. Li, P. W. Yi, Q. Sun, H. Lei, H. L. Zhao, Z. H. Zhu, S. C. Smith, M. B. Lan and G. Q. Lu, Adv. Funct. Mater., 2012, 22, 2387 CrossRef CAS.
- J. Lao, J. Huang, D. Wang and Z. F. Ren, Adv. Mater., 2004, 16, 65 CrossRef CAS.
- M. Bender, N. Katsarakis, E. Gagaoudakis, E. Hourdakis, E. Douloufakis, V. Cimalla and G. Kiriakidis, J. Appl. Phys., 2001, 90, 5382 CrossRef CAS.
- D. Liu, W. W. Lei, B. Zou, S. D. Yu, J. Hao, K. Wang, B. B. Liu, Q. L. Cui and G. T. Zou, J. Appl. Phys., 2008, 104, 083506 CrossRef.
- C. H. Liang, G. W. Meng, Y. Lei, F. Phillipp and L. D. Zhang, Adv. Mater., 2001, 13, 1330 CrossRef CAS.
- C. Li, D. H. Zhang, S. Han, X. L. Liu, T. Tang and C. W. Zhou, Adv. Mater., 2003, 15, 143 CrossRef CAS.
- Q. S. Liu, W. G. Lu, A. H. Ma, J. K. Tang, J. Lin and J. Y. Fang, J. Am. Chem. Soc., 2005, 127, 5276 CrossRef CAS.
- Y. Idota, T. Kubota, A. Matsufuji, Y. Maekawa and T. Miyasaka, Science, 1997, 276, 1395 CrossRef CAS.
- H. Li, X. J. Huang and L. Q. Chen, Solid State Ionics, 1999, 123, 189 CrossRef CAS.
- Y. Zhou, H. Zhang, M. Xue, C. Wu, X. Wu and Z. Fu, J. Power Sources, 2006, 162, 1373 CrossRef CAS.
- W. H. Ho, C. F. Li, H. C. Liu and S. K. Yen, J. Power Sources, 2008, 175, 897 CrossRef CAS.
- K. R. Prasad, K. Koga and N. Miura, Chem. Mater., 2004, 16, 1845 CrossRef CAS.
- M. Epifani, P. Siciliano, A. Gurlo, N. Barasan and U. Weimar, J. Am. Chem. Soc., 2004, 126, 4078 CrossRef CAS.
- C. H. Lee, M. Kim, T. Kim, A. Kim, J. Paek, J. W. Lee, S. Y. Choi, K. Kim, J. B. Park and K. Lee, J. Am. Chem. Soc., 2006, 128, 9326 CrossRef CAS.
- J. Q. Xu, Y. P. Chen, Q. Y. Pan, Q. Xiang, Z. X. Cheng and X. W. Dong, Nanotechnology, 2007, 18, 115615 CrossRef.
- C. Chen, D. Chen, X. Jiao and C. Wang, Chem. Commun., 2006, 4632 RSC.
- C. T. Prewitt, R. D. Shannon, D. B. Rogers and A. W. Sleight, Inorg. Chem., 1969, 8, 1985 CrossRef CAS.
- T. Atou, K. Kusaba, K. Fukuoka, M. Kiduchi and Y. Syono, J. Solid State Chem., 1990, 89, 378 CrossRef CAS; M. Epifani, P. Siciliano, A. Gurlo, N. Barsan and U. Weimar, J. Am. Chem. Soc., 2004, 126, 4078 CrossRef.
- S. S. Farvid and P. V. Radovanovic, J. Am. Chem. Soc., 2012, 134, 7015 CrossRef CAS.
- D. Yu, S. H. Yu, S. Zhang, J. Zuo, D. Wang and Y. Qian, Adv. Funct. Mater., 2003, 13, 497 CrossRef CAS.
- Y. Chen, A. T. Halstead and J. S. Williams, Mater. Sci. Eng., A, 1996, 206, 24 CrossRef.
- D. Liu, W. W. Lei, Y. W. Li, Y. M. Ma, J. Hao, X. H. Chen, Y. X. Jin, D. D. Liu, S. D. Yu, Q. L. Cui and G. T. Zou, Inorg. Chem., 2009, 48, 8251 CrossRef CAS.
- Powder Diffraction File No. 71-2194, M. Marezio, Acta Crystallogr., 1966, 20, 723 CrossRef CAS.
- W. B. White and V. G. Keramidas, Spectrochim. Acta, Part A, 1972, 28, 501 CrossRef CAS.
- R. K. Gupta, K. Ghosh, S. R. Mishra and P. K. Kahol, Mater. Lett., 2008, 62, 1033 CrossRef CAS.
- Y. Chen, J. S. Williams and G. M. Wang, J. Appl. Phys., 1996, 79, 3956 CrossRef.
- Y. Chen, T. Hwang, M. Marsh and J. S. Williams, Metall. Mater. Trans. A, 1997, 28, 1115 CrossRef.
- M. Puttaswamy, Y. Chen, B. Jar and J. S. Williams, J. Metastable Nanocryst. Mater., 1999, 2, 79 CrossRef.
- X. L. Li, H. F. Song, H. Wang, Y. L. Zhang, K. Du, H. Y. Li and J. M. Huang, J. Appl. Electrochem., 2012, 42, 1065 CrossRef CAS.
- Z. S. Wu, W. C. Ren, L. Wen, L. B. Gao, J. P. Zhao, Z. P. Chen, G. M. Zhou, F. Li and H. M. Cheng, ACS Nano, 2010, 4, 3187 CrossRef CAS.
- H. L. Wang, L. F. Cui, Y. Yang, H. S. Casalongue, J. T. Robinson, Y. Y. Liang, Y. Cui and H. J. Dai, J. Am. Chem. Soc., 2010, 132, 13978 CrossRef CAS.
- M. Sorescu, L. Diamandescu, D. Tarabasanu-mihaila and V. S. Teodorescu, J. Mater. Sci., 2004, 39, 675 CrossRef CAS.
- X. H. Huang, J. P. Tu, B. Zhang, C. Q. Zhang, Y. Li, Y. F. Yuan and H. M. Wu, J. Power Sources, 2006, 161, 541 CrossRef CAS.
| This journal is © The Royal Society of Chemistry 2013 |
