Yttrium-modified Li4Ti5O12 as an effective anode material for lithium ion batteries with outstanding long-term cyclability and rate capabilities†
Yu-Jun
Bai
*ab,
Chen
Gong
a,
Ning
Lun
a and
Yong-Xin
Qi
*a
aKey Laboratory for Liquid–Solid Structural Evolution and Processing of Materials (Ministry of Education), Shandong University, Jinan 250061, PR China. E-mail: byj97@126.com; Fax: +86 53188392315; Tel: +86 53188392315
bState Key Laboratory of Crystal Materials, Shandong University, Jinan, 250100, PR China
First published on 22nd October 2012
Abstract
Yttrium-modified Li4Ti5O12 (YLTO) was fabricated by a coprecipitation method using tetrabutyl titanate, Y(NO3)3·6H2O and LiOH·H2O as reactants, followed by simply sintering the dried mixture at 600 °C. The products and their lithiation–delithiation process were characterized by a combination of electrochemical measurements, X-ray diffraction, transmission electron microscopy and nitrogen adsorption. The YLTO exhibits excellent long-term cycling stability (over 1000 cycles) at a high current rate of 10 C and outstanding rate capabilities. Particularly, the YLTO demonstrates remarkable cyclability even if directly cycled at a rate of 10 C without low-rate activation and with no relaxation between charge and discharge. Even without utilizing carbon black as conductive material, the YLTO still shows prominent rate capabilities and long-term cyclic performance at a rate of 5 C. The excellent performance is ascribed to the increased lattice constant, improved electronic and ionic conductivities, refined grains with large surface area and uniform nanopores resulting from the Y-modification.
1. Introduction
Li4Ti5O12 (LTO) used as anode materials for lithium ion batteries (LIBs) has several unique merits, such as zero-strain during lithiation–delithiation,1 long-term cycling stability, good high-rate performance, and a wide voltage plateau around 1.55 V with enhanced safety,2–4 so LTO has become a research focus for large LIBs utilized in electric vehicles and energy storage. Poor electronic and Li ionic conductivities are the dominant disadvantages for the application of LTO, which will result in low performance at high current rates. To date, several methods have been proposed to improve the electrochemical performance of LTO, such as coating carbon on the surface or compositing with carbon.5–10 However, the rate capabilities are still unsatisfactory and can not meet the demand for high power density. Coating carbon on the surface or compositing with carbon materials could improve the electrical conductivity between the LTO particles, but could not enhance the intrinsic electronic and Li ionic conductivities, namely, the conductivities inside the LTO particles are still poor. Doping with appropriate elements might be a beneficial alternative to the conductivities, thus some attempts have been made to dope LTO, including doping with Mg2+,11 Al3+,12–14 Ni2+,15–17 Mn2+,16 Cr3+,17 Co2+,14,16 Fe3+,17 Ga3+,14 La3+,18–21 Zr4+,22 Zn2+,23,24 Mo6+,25 Mo4+,26 V5+,27,28 Sn2+,29 Ta5+,30 Nb5+,31,32 Ru4+,33 F−,12 and Br−.34 The electrochemical performance of the modified-LTO depends greatly upon the dopant and doping content. However, the effect is not so remarkable as expected in most of the previous work, the main reason lies in the selection of dopant and doping content. To date, information concerning the electrochemical performance of Y-modified LTO (YLTO) is absent.According to literature,35 doping zirconia with lower valence cation Y3+ yields oxygen ion vacancies, which could behave as ionic charge carriers to greatly enhance the ionic conductivity and electrolytic stability of zirconia. Inspired by this work, we prepared YLTO with various Y-doping contents, and systematically investigated the electrochemical performance and structure. YLTO could exhibit excellent long-term cycling stability (over 1000 cycles) at a high rate of 10 C and outstanding rate capabilities. More importantly, YLTO possesses appreciable cyclic performance even if directly cycled at a rate of 10 C without activation at low rates and with no relaxation between charge and discharge. Furthermore, even in the absence of carbon black as conductive materials, YLTO still demonstrates prominent rate capabilities and long-term cyclic performance at a rate of 5 C.
2. Experimental methods
2.1 Synthesis of YLTO
All the reagents involved in the present work are analytically pure. The preparation of YLTO includes four steps. (1) 12.8 g tetrabutyl titanate (TBT) was added into 20 mL ethanol to form solution A, 1.3 g LiOH and an appropriate amount of Y(NO3)3·6H2O were dissolved in deionized water to form solution B. (2) Solution A was titrated into solution B under magnetic stirring. (3) The mixture was dried at 105 °C thoroughly. (4) The dried mixture was calcined at 600 °C for 5 h. To obtain YxLTO (x = 0, 0.02, 0.04, 0.06, 0.08 and 0.1), the weight of Y(NO3)3·6H2O added was 0, 0.058, 0.115, 0.172, 0.23 or 0.29 g, respectively. The as-obtained YLTO was directly used to measure the electrochemical performance without any other treatments.2.2 Electrochemical measurement
The electrochemical performance of YLTO was tested in 2025 coin-type cells. Typically, YLTO, carbon black, and polyvinylidene fluoride (PVDF) with a weight ratio of 8![[thin space (1/6-em)]](https://www.rsc.org/images/entities/char_2009.gif) :
:![[thin space (1/6-em)]](https://www.rsc.org/images/entities/char_2009.gif) 1
1![[thin space (1/6-em)]](https://www.rsc.org/images/entities/char_2009.gif) :
:![[thin space (1/6-em)]](https://www.rsc.org/images/entities/char_2009.gif) 1 were mixed in n-methyl pyrrolidinone (NMP) to form a uniform slurry, which was then coated onto a Cu foil substrate and dried in a vacuum oven at 120 °C for 12 h. Half-cells were assembled in a glovebox using Li foil as counter electrode, Celgard 2300 as separator, and a mixture of 1 M LiPF6 in ethylene carbonate and dimethyl carbonate (1
1 were mixed in n-methyl pyrrolidinone (NMP) to form a uniform slurry, which was then coated onto a Cu foil substrate and dried in a vacuum oven at 120 °C for 12 h. Half-cells were assembled in a glovebox using Li foil as counter electrode, Celgard 2300 as separator, and a mixture of 1 M LiPF6 in ethylene carbonate and dimethyl carbonate (1![[thin space (1/6-em)]](https://www.rsc.org/images/entities/char_2009.gif) :
:![[thin space (1/6-em)]](https://www.rsc.org/images/entities/char_2009.gif) 1 by volume) as electrolyte. The performance of the cells was evaluated galvanostatically in the voltage range of 1–2.5 V at various current rates with a relaxation time of 3.0 min between charge and discharge unless otherwise indicated.
1 by volume) as electrolyte. The performance of the cells was evaluated galvanostatically in the voltage range of 1–2.5 V at various current rates with a relaxation time of 3.0 min between charge and discharge unless otherwise indicated.
2.3 Characterization of the products
A Rigaku Dmax-2500 diffractometer with Ni filtered Cu Kα radiation (V = 50 kV, I = 100 mA) was utilized to collect XRD patterns at a scanning rate of 4° min−1. The morphology and structure of the products were examined using a JEOL JEM-2100 high-resolution transmission electron microscope (HRTEM).Nitrogen adsorption–desorption isotherms were acquired in a Quadrasorb SI sorption analyzer at −196 °C. The samples were outgassed at 300 °C for 3 h under a vacuum in the degas port of the analyzer. The Brunauer–Emmett–Teller (BET) model was adopted to calculate specific surface area, and the Density Functional Theory (DFT) method to determine pore-size distribution from the adsorption–desorption data.
The electronic conductivity of the products was measured in a Hall effect measurement system (HEMS) by pressing the YLTO powders into thin disks under a pressure of 20 MPa.
3. Results and discussion
3.1 Electrochemical performance
To understand the lithiation–delithiation mechanism, the charge–discharge curves of the first cycle for YLTO with various Y-doping contents were measured at 0.1 C, as shown in Fig. 1. In comparison with the curves of undoped LTO, there are no other plateaus in the curves of YLTO. Despite the difference in reversible capacity of the first cycle, the similarity of the curves and the voltage plateau around 1.55 V demonstrate the analogous electrochemical pathway of YLTO to that of undoped LTO.36 From the curves, an interesting phenomenon is that the initial discharge capacities of Y0.06LTO and Y0.08LTO exceed the theoretical capacity of LTO, the reason for this will be explained associated with the following structure analysis.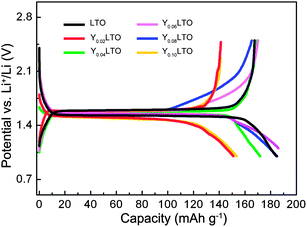 | ||
| Fig. 1 Charge–discharge curves of the first cycle for YLTO with various Y-doping contents. | ||
Owing to the low theoretical capacity of 175 mA h g−1, rate performance is extremely important for LTO. The rate capabilities of YLTO with various Y-doping contents were evaluated, as displayed in Fig. 2. From Fig. 2a, the reversible capacity of undoped LTO decreases markedly with increasing the current rate from 0.1 to 10 C. For Y-doping contents of 0.02–0.08, YLTO exhibits excellent rate performance even when cycled at a rate of 30 C (Fig. 2b–e). However, when the Y-doping content reaches 0.1, the rate performance worsens, demonstrative of over-doping of Y in LTO. The reversible capacities of YLTO at various current rates are collected in Table 1, clearly revealing the relationship between the rate capabilities and the Y-doping content. It can be noted that Y0.06LTO presents the best rate performance among the products. The corresponding charge–discharge curves of the first cycle at various rates are depicted in the insets of Fig. 2, further demonstrating the dependence of the rate performance on the Y-doping content in LTO.
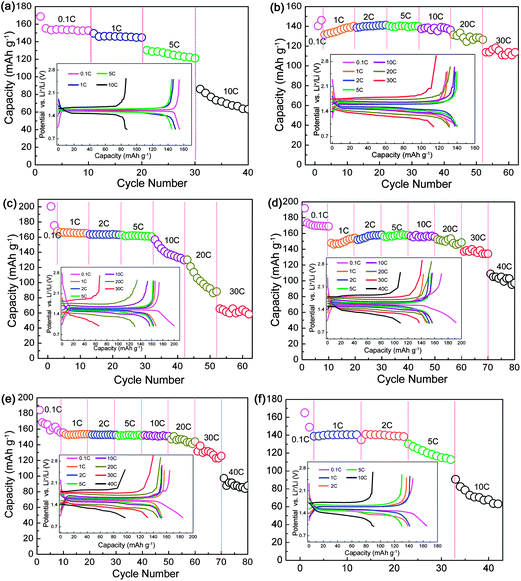 | ||
| Fig. 2 Rate capabilities of YxLTO for x = 0 (a), 0.02 (b), 0.04 (c), 0.06 (d), 0.08 (e) and 0.1 (f). The insets are the corresponding charge–discharge curves of the first cycle at various rates. | ||
| x in YxLTO | Current rate/C | |||||||
|---|---|---|---|---|---|---|---|---|
| 0.1 | 1 | 2 | 5 | 10 | 20 | 30 | 40 | |
| 0 | 172.2 | 146.2 | 130.3 | 73.4 | ||||
| 0.02 | 146.1 | 136.6 | 139.8 | 140.4 | 138.1 | 130.4 | 113.8 | |
| 0.04 | 173.3 | 165.8 | 163.3 | 161.3 | 146.8 | 115.5 | 67.0 | |
| 0.06 | 173.2 | 151.3 | 156.9 | 157.1 | 156.8 | 150.5 | 138.3 | 108.7 |
| 0.08 | 168.4 | 153.2 | 153.5 | 151.4 | 151.9 | 146.9 | 131.3 | 97.3 |
| 0.1 | 165.0 | 138.8 | 140.8 | 125.0 | 72.7 | |||
Long-term cycling stability is another significant performance for LTO. The YLTO cells were firstly subjected to a similar rate performance test to that in Fig. 2, and then a long-term charge–discharge cycling test at 10 C was conducted, as shown in Fig. 3. The reversible capacity of LTO decreases almost linearly to 70.5 mA h g−1 when cycled at 5 C 200 times (Fig. 3a). With respect to YxLTO cycled at 10 C, the reversible capacities are 105.6 mA h g−1 for x = 0.02 after 1000 cycles (Fig. 3b), 111.9 mA h g−1 for x = 0.04 after 1800 cycles (Fig. 3c), 141.3 mA h g−1 for x = 0.06 after 1800 cycles (Fig. 3d), 110.7 mA h g−1 for x = 0.08 after 1800 cycles (Fig. 3e), and 100.7 mA h g−1 for x = 0.1 after 1100 cycles (Fig. 3f), which are more stable than that of undoped LTO. From the corresponding charge–discharge curves for selected cycles shown in the insets of Fig. 3, the reaction mechanism does not alter during the long-term cycling. For the convenience of comparison, capacities for selected cycles are listed in Table 2. Also, Y0.06LTO exhibits the highest capacities for the identical cycles. Taking into consideration the long-term cyclability and rate capabilities, Y0.06LTO demonstrates optimal comprehensive performance, to confirm which we provide the rate capabilities and long-term cycling performance of another Y0.06LTO cell in Fig. S1† of the ESI.†
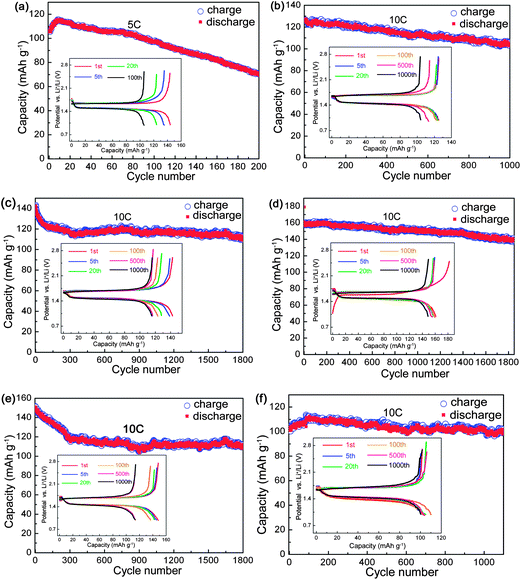 | ||
| Fig. 3 Long-term cyclic performance of YxLTO for x = 0 (a), 0.02 (b), 0.04 (c), 0.06 (d), 0.08 (e) and 0.1 (f). The insets are the corresponding charge–discharge curves of selected cycles. | ||
| x in YxLTO | Current rate/C | Cycle number | |||||
|---|---|---|---|---|---|---|---|
| 1 | 2 | 5 | 100 | 500 | 1000 | ||
| 0 | 5 | 105.8 | 108.2 | 111.4 | 97.1 | ||
| 0.02 | 10 | 138.6 | 135.7 | 134.3 | 127.9 | 113.8 | 105.6 |
| 0.04 | 10 | 144.4 | 144.9 | 140.1 | 122.6 | 115.8 | 115.4 |
| 0.06 | 10 | 161.1 | 158.7 | 157.3 | 158.7 | 155.8 | 149.5 |
| 0.08 | 10 | 151.5 | 149.5 | 149.0 | 138.3 | 117.0 | 109.7 |
| 0.1 | 10 | 103.7 | 101.2 | 100.7 | 110 | 104.1 | 102.2 |
In view of the excellent electrochemical performance, another Y0.06LTO cell was directly cycled at a current rate of 10 C without the activation at low current rates and with no relaxation between charge and discharge. From the cycling performance exhibited in Fig. 4, the cell still retains an outstanding reversible capacity of 120.5 mA h g−1 after 1800 cycles, which is only lower than that of Y0.06LTO activated at low rates with a relaxation time of 3 min, and higher that those of the other YLTO activated and relaxed, suggesting the good electronic and Li ionic conductivities of Y0.06LTO.
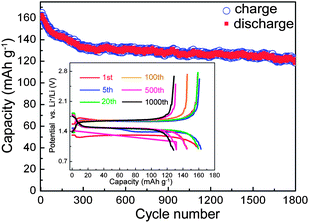 | ||
| Fig. 4 Long-term cyclic performance of Y0.06LTO directly cycled at a current rate of 10 C without low-rate activation and with no relaxation between charge and discharge. | ||
In general, the properties of materials are significantly dependent upon the structure and morphology, so several methods were adopted to characterize the products.
3.2 XRD analysis
The XRD patterns of YLTO with various Y-doping contents are displayed in Fig. 5. From Fig. 5a, the patterns are quite similar, and could be indexed to LTO with a spinel structure (JCPDS 49-0207). No diffractions other than LTO can be detected, demonstrating that Y has thoroughly doped into LTO. However, from the magnified patterns in the range of 2θ = 17.5–19.5°, a distinct shift to lower angles can be observed for the (111) diffraction peak owing to the Y-doping, indicative of the increment in lattice constant owing to the ionic radius of Y3+ (0.9 Å) being larger than those of Li+ (0.76 Å) and Ti4+ (0.605 Å);37 the constants are 8.338, 8.403, 8.392, 8.381, 8.362 and 8.356 Å for YxLTO with x = 0, 0.02, 0.04, 0.06, 0.08 and 0.1, respectively. The increased lattice constant resulting from the Y-modification could broaden the pathway for Li ion diffusion and enhance the diffusion coefficient, thus is conducive to the insertion–extraction of Li ions. Meanwhile, the large differences in the ionic radii will lead to lattice distorstion, thus introducing defects in LTO. In terms of literature, the defects in LTO,38 amorphous MoO2,39 and V2O5,40 could serve as Li+ storage sites for improved lithium capacity and rate performance. The increased capacity during the first discharge of Y0.06LTO and Y0.08LTO might also originate from lattice distortion induced defects. The average crystal size (D) can be calculated using the Scherrer equation,41 and the values are listed in Table 3, from which the Y-doping in LTO obviously gives rise to grain refinement. The refined particles are favorable for improving the electrochemical performance of electrode materials.42–46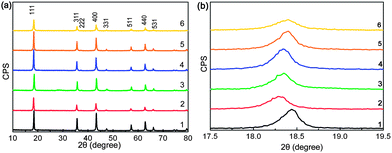 | ||
| Fig. 5 (a) XRD patterns of YxLTO for x = 0 (1), 0.02 (2), 0.04 (3), 0.06 (4), 0.08 (5) and 0.1 (6), and (b) (111) diffraction peak around 2θ = 18.5°. | ||
| x in YxLTO | ||||||
|---|---|---|---|---|---|---|
| 0 | 0.02 | 0.04 | 0.06 | 0.08 | 0.1 | |
| σ/S cm−1 | 5.14 × 10⁻⁸ | 5.81 × 10⁻⁷ | 6.56 × 10⁻⁷ | 7.51 × 10⁻⁷ | 6.44 × 10⁻⁷ | 2.50 × 10⁻⁷ |
| D σ/cm2 s−1 | 4.58 × 10⁻¹³ | 5.18 × 10⁻¹² | 5.85 × 10⁻¹² | 6.69 × 10⁻¹² | 5.74 × 10⁻¹² | 2.23 × 10⁻¹² |
| D/nm | 35.0 | 27.4 | 29.6 | 29.2 | 31.1 | 24.3 |
| t/s | 26.7 | 1.45 | 1.49 | 1.27 | 1.68 | 2.64 |
3.3 TEM examination
The TEM images of YLTO are exhibited in Fig. 6. Undoped LTO is comprised of nanoparticles ranging from 10 to 80 nm (Fig. 6a). With increasing the Y-doping content from 0.02 to 0.08, the particle sizes decrease gradually, and the sizes are distributed more uniformly (Fig. 6b–e). However, when the Y-doping content reaches 0.1, the particles reveal a wider dimension range from several nanometers to over 100 nm (Fig. 6f). From the corresponding diffraction patterns shown in the insets, all the products have a similar spinel structure. These results are in good accordance with those from the XRD patterns.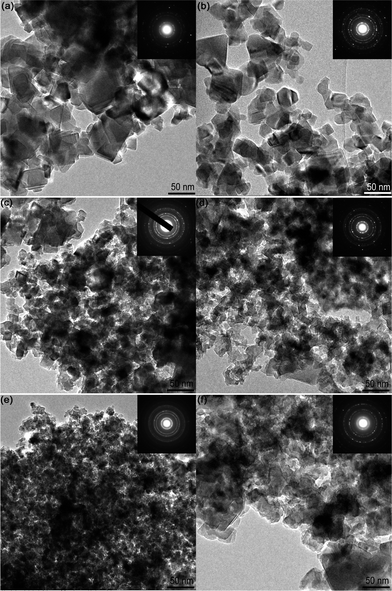 | ||
| Fig. 6 TEM images of YxLTO for x = 0 (a), 0.02 (b), 0.04 (c), 0.06 (d), 0.08 (e) and 0.1 (f). The insets are the corresponding electron diffraction patterns. | ||
Lattice fringe images were also examined to reveal the microstructural information, as displayed in Fig. 7. When the Y-doping content is no more than 0.02, clear images could be acquired with ease (Fig. 7a and b), however, it becomes more difficult to clearly image the lattices with increasing the Y-doping content over 0.04 (Fig. 7c–f). Particularly, with doping content of 0.06 and 0.08, some lattice defects, such as lattice twists (marked as A, B in Fig. 7d and C, D in Fig. 7e) can be frequently observed due to the lattice distortion induced by the substitution of Y3+ for Li+ and Ti4+, which might be responsible for the increased capacity during the first discharge of Y0.06LTO and Y0.08LTO.38–40 In Y0.1LTO, even dislocations (marked as E in Fig. 7f) could be observed owing to the severe lattice distortion, which might lead to the decrease in capacity.
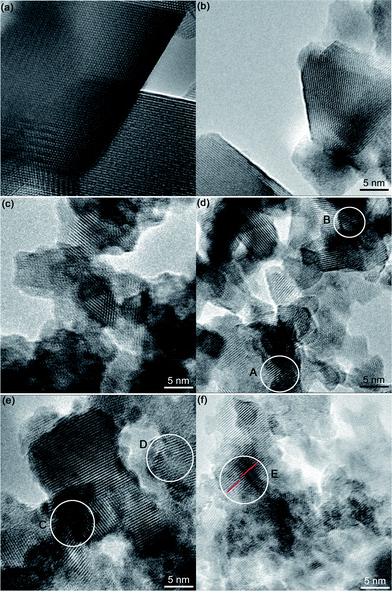 | ||
| Fig. 7 Lattice fringe images of YxLTO for x = 0 (a), 0.02 (b), 0.04 (c), 0.06 (d), 0.08 (e) and 0.1 (f). | ||
Accordingly, the appreciable electrochemical performance of YxLTO (0.02 < x < 0.08) is partially related to the uniform nanocrystals in the products, which may increase the specific surface area for full contact between electrode and electrolyte to enhance surface electrochemical reactivity, and to shorten the diffusion distance of electrons and Li ions, thus contributing to charging–discharging at high current rates.42–46 At the same time, the lattice distortion is favorable to improve the Li ion diffusion. But when x > 0.08, say x = 0.1, the occurrence of dislocations resulting from the severe lattice distortion gives rise to the increment in electric resistance, and ultimately to the decay in electrochemical performance.
3.4 Specific surface area and pore size distribution
From the TEM images, the products are comprised of nanocrystals, which should possess large specific surface areas. The nitrogen adsorption–desorption isotherms are shown in Fig. 8, which exhibit a typical IV-type curve with a small hysteresis loop at higher relative pressure, indicating a wide range of pore size distribution. From the pore size distribution curves depicted in the insets, undoped LTO displays a wider pore size distribution dominantly around 3.8 and 40 nm, and a lower surface area of 30.9 m2 g−1 (Fig. 8a). The Y-doping also gives rise to uniform pore size distribution. As exemplified in Fig. 8b and c, the pore sizes are mainly around 3.5 and 2.8 nm, and the specific surface areas are 35.8 and 54.9 m2 g−1 for Y0.06LTO and Y0.08LTO, respectively. The adsorption–desorption isotherms and pore size distribution curves of the other YLTO samples are analogous to those in Fig. 8b and c, and not presented here. The nanoparticles with large surface area are conducive to accelerating the electrode reaction, to shortening the diffusion path of Li-ions, and to facilitating charge transfer,42–46 while the uniform nanopores are favorable to electrolyte infiltration, thus contributing to lithiation–delithiation.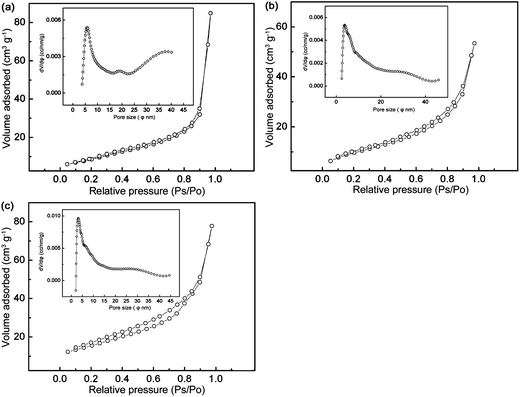 | ||
| Fig. 8 Nitrogen adsorption–desorption isotherms of YxLTO for x = 0 (a), 0.06 (b), and 0.08 (c). The insets are the corresponding DFT pore size distribution curves. | ||
3.5 Evidence for enhanced electronic and ionic conductivities of YLTO
In order to experimentally verify the improved electronic and ionic conductivities of YLTO, we designed some other comparative tests, in which no carbon black was added in the slurry (the weight ratio of Y0.06LTO or LTO to polyvinylidene fluoride is 9![[thin space (1/6-em)]](https://www.rsc.org/images/entities/char_2009.gif) :
:![[thin space (1/6-em)]](https://www.rsc.org/images/entities/char_2009.gif) 1) when fabricating the anodes. The rate capabilities and long-term cyclic performance are shown in Fig. 9. Even in the absence of conductive carbon black, the Y0.06LTO cells could still maintain a stable reversible capacity of 140 mA h g−1 or so at a rate of 5 C, and the capacities at 1, 2 and 5 C exhibit almost no reduction. The rate performance of the Y0.06LTO cell is obviously superior to that of the LTO cell using carbon black as conductive material (Fig. 2a), and is significantly enhanced over that of LTO cell without conductive carbon black at identical rates (Fig. 9b). The long-term cycling performance of the Y0.06LTO cells without the addition of carbon black was also measured at 5 C (Fig. 9c). After cycling 500 times, the reversible capacity is 111.9 mA h g−1, also markedly higher than that of the LTO cell using carbon black as conductive material (Fig. 3a). These experimental results provide clear evidence that the Y-modified LTO really possesses good electronic and ionic conductivities which have not been observed in other oxide anode materials.
1) when fabricating the anodes. The rate capabilities and long-term cyclic performance are shown in Fig. 9. Even in the absence of conductive carbon black, the Y0.06LTO cells could still maintain a stable reversible capacity of 140 mA h g−1 or so at a rate of 5 C, and the capacities at 1, 2 and 5 C exhibit almost no reduction. The rate performance of the Y0.06LTO cell is obviously superior to that of the LTO cell using carbon black as conductive material (Fig. 2a), and is significantly enhanced over that of LTO cell without conductive carbon black at identical rates (Fig. 9b). The long-term cycling performance of the Y0.06LTO cells without the addition of carbon black was also measured at 5 C (Fig. 9c). After cycling 500 times, the reversible capacity is 111.9 mA h g−1, also markedly higher than that of the LTO cell using carbon black as conductive material (Fig. 3a). These experimental results provide clear evidence that the Y-modified LTO really possesses good electronic and ionic conductivities which have not been observed in other oxide anode materials.
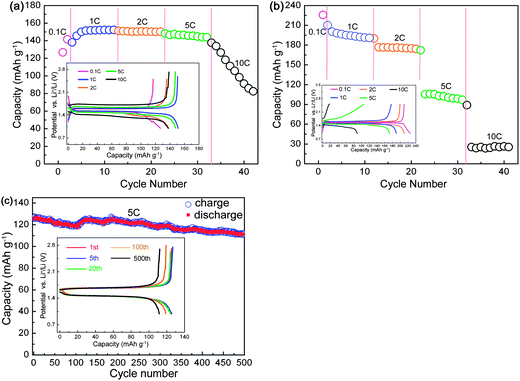 | ||
| Fig. 9 Rate performance of Y0.06LTO (a) and LTO (b), and long-term cycling performance of Y0.06LTO at 5 C (c) without using carbon black as conductive material. The insets are the first discharge–charge curves at various rates (a and b), and the curves for selected cycles (c). | ||
Because LTO is a nonmagnetic material, we measured the electronic conductivity (σ) of the YLTO with a new attempt by HEMS. The average values for each sample are tabulated in Table 3. The electronic conductivity acquired is comparable to those reported in the literature,13,14,21,30,31,47 demonstrating the feasibility of HEMS as a means to test the electronic conductivity of LTO. From Table 3, it is apparent that the electronic conductivity of Y-modified LTO is one order of magnitude higher than that of undoped LTO, and Y0.06LTO has the highest conductivity, while Y0.1LTO has the lowest one in the Y-modified LTOs; the result is in good agreement with that of the electrochemical performance. The decreased electronic conductivity of Y0.1LTO demonstrates the increment in electric resistance which resulted from the occurrence of dislocations, as observed by TEM (Fig. 7f).
Based on the Nernst–Einstein equation, the Li-ion diffusion coefficient (Dσ) can be approximately calculated from the electronic conductivity,
 | (1) |
Combining the electrochemical performance with the XRD results, TEM images, specific surface areas, pore-size distributions, electronic and Li ionic conductivities, the excellent performance of YLTO is attributed to the following reasons. (1) Doping Y in LTO could give rise to the increment in lattice constant (Fig. 5), thus broadening the diffusion pathway of Li ions and decreasing the diffusion obstacles. (2) Y-doping increases the electronic and Li ionic conductivities of LTO, as verified by Fig. 9 and Table 3. (3) Y-doping could refine the LTO particles (Fig. 5–7), thus improving the contact between electrode and electrolyte for enhanced surface electrochemical reactivity, and shortening the diffusion distance of electrons and Li ions.42–46 (4) The refined grains of Y-modified LTO with large surface area and uniform nanopores (Fig. 8) could facilitate charge transfer and electrolyte infiltration. (5) It seems that a slight lattice distortion resulting from appropriate Y-doping is beneficial to improving electronic and Li ionic conductivities, and to Li ion insertion–extraction, for instance in Y0.06LTO; however, a higher Y-doping content, say x ≥ 0.1, results in severe lattice distortion and the introduction of dislocations (Fig. 7f), leading to the increase in electronic resistance and the decay in electrochemical performance. As a consequence, the Y-doping content should be controlled within the range of 0.02–0.08 in LTO for achieving excellent electrochemical performance.
4. Conclusions
YLTO with various Y-doping contents was prepared via a coprecipitation route using tetrabutyl titanate, Y(NO3)3·6H2O and LiOH·H2O as raw materials, followed by simply sintering the dried mixture at 600 °C. The Y-modified LTO could exhibit excellent long-term cyclability (over 1000 cycles) at a high rate of 10 C and outstanding rate capabilities. Even when directly cycled at a current rate of 10 C without low-rate activation and with no relaxation between charge and discharge, an appreciable cyclic performance can still be achieved. In particular, YLTO could demonstrate prominent rate capabilities and long-term cycling performance at a rate of 5 C without using carbon black as conductive material. Accordingly, the Y-modified LTO could be directly utilized as an efficient anode material for high-rate and long-life large energy storage devices, such as electric vehicles, hybrid electric vehicles and electric grids.Acknowledgements
This work was supported by Independent Innovation Foundation of Shandong University, IIFSDU (2012ZD004), Open Project from State Key Laboratory of Crystal Material (KF1105), the National Natural Science Foundation of China (no. 50972076, and 50872072), and the Shandong Provincial Natural Science Foundation, China (Y2008F26 and Y2008F40).References
- T. Ohzuku, A. Ueda and N. Yamamota, J. Electrochem. Soc., 1995, 142, 1431 CrossRef CAS.
- G.-N. Zhu, Y.-G. Wang and Y.-Y. Xia, Energy Environ. Sci., 2012, 5, 6652 CAS.
- T. F. Yi, L. J. Jiang, J. Shu, C. B. Yue, R. S. Zhu and H. B. Qiao, J. Phys. Chem. Solids, 2010, 71, 1236 CrossRef CAS.
- Z. Chen, I. Belharouak, Y.-K. Sun and K. Amine, Adv. Funct. Mater., 2012 DOI:10.1002/adfm.201200698.
- L. Zhao, Y.-S. Hu, H. Li, Z. Wang and L. Chen, Adv. Mater., 2011, 23, 1385 CrossRef CAS.
- Y. Wang, H. Liu, K. Wang, H. Eiji, Y. Wang and H. Zhou, J. Mater. Chem., 2009, 19, 6789 RSC.
- H.-G. Jung, J. Kim, B. Scrosati and Y. K. Sun, J. Power Sources, 2011, 196, 7763 CrossRef CAS.
- T. Yuan, X. Yu, R. Cai, Y. Zhou and Z. Shao, J. Power Sources, 2010, 195, 4997 CrossRef CAS.
- M. M. Rahman, J.-Z. Wang, M. F. Hassan, D. Wexler and H. K. Liu, Adv. Energy Mater., 2011, 1, 212 CrossRef CAS.
- L. Shen, C. Yuan, H. Luo, X. Zhang, K. Xu and F. Zhang, J. Mater. Chem., 2011, 21, 761 RSC.
- C. H. Chen, J. T. Vaughey, A. N. Jansen, D. W. Dees, A. J. Kahaian, T. Goacher and M. M. Thackeray, J. Electrochem. Soc., 2001, 148, A102 CrossRef CAS.
- S. Huang, Z. Wen, Z. Gu and X. Zhu, Electrochim. Acta, 2005, 50, 4057 CrossRef CAS.
- Z. Wang, G. Chen, J. Xu, Z. Lv and W. Yang, J. Phys. Chem. Solids, 2011, 72, 773 CrossRef CAS.
- S. Huang, Z. Wen, X. Zhu and Z. Lin, J. Power Sources, 2007, 165, 408 CrossRef CAS.
- J. Kim, S.-W. Kim, H. Gwon, W.-S. Yoon and K. Kang, Electrochim. Acta, 2009, 54, 5914 CrossRef CAS.
- Y.-J. Hao, Q.-Y. Lai, J.-Z. Lu and X.-Y. Ji, Ionics, 2007, 13, 369 CrossRef CAS.
- A. D. Robertson, L. Trevino, H. Tukamoto and J. T. S. Irvine, J. Power Sources, 1999, 81–82, 352 CrossRef CAS.
- T.-F. Yi, Y. Xie, Q. Wu, H. Liu, L. Jiang, M. Ye and R. Zhu, J. Power Sources, 2012, 214, 220 CrossRef CAS.
- J. Gao, J. R. Ying, C. Y. Jiang and C. R. Wan, Ionics, 2009, 15, 597 CrossRef CAS.
- J. Gao, C. Y. Jiang and C. R. Wan, J. Electrochem. Soc., 2010, 157, 1039 Search PubMed.
- Y.-J. Bai, C. Gong, Y.-X. Qi, N. Lun and J. Feng, J. Mater. Chem., 2012, 22, 19054 RSC.
- X. Li, M. Qu and Z. Yu, J. Alloys Compd., 2009, 487, L12 CrossRef CAS.
- B. Zhang, H. Du, B. Li and F. Kang, Electrochem. Solid-State Lett., 2010, 13, A36 CrossRef CAS.
- T. F. Yi, H. Liu, Y. R. Zhu, L. J. Jiang, Y. Xie and R. S. Zhu, J. Power Sources, 2012, 215, 258 CrossRef CAS.
- T. F. Yi, Y. Xie, L. J. Jiang, J. Shu, C. B. Yue, A. N. Zhou and M. F. Ye, RSC Adv., 2012, 2, 3541 RSC.
- Z. Zhong, Electrochem. Solid-State Lett., 2007, 10, A267 CrossRef CAS.
- Z. Yu, X. Zhang, G. Yang, J. Liu, J. Wang, R. Wang and J. Zhang, Electrochim. Acta, 2011, 56, 8611 CrossRef CAS.
- T.-F. Yi, J. Shu, Y.-R. Zhu, X.-D. Zhu, C.-B. Yue, A.-N. Zhou and R.-S. Zhu, Electrochim. Acta, 2009, 54, 7464 CrossRef CAS.
- B. Zhang, Z.-D. Huang, S. Oh and J.-K. Kim, J. Power Sources, 2011, 196, 10692 CrossRef CAS.
- J. Wolfenstine and J. L. Allen, J. Power Sources, 2008, 180, 582 CrossRef CAS.
- B. Tian, H. Xiang, L. Zhang, Z. Li and H. Wang, Electrochim. Acta, 2010, 55, 5453 CrossRef CAS.
- T.-F. Yi, Y. Xie, J. Shu, Z. Wang, C.-B. Yue, R.-S. Zhu and H.-B. Qiao, J. Electrochem. Soc., 2011, 158, A266 CrossRef CAS.
- Y.-R. Jhan, C.-Y. Lin and J.-G. Duh, Mater. Lett., 2011, 65, 2502 CrossRef CAS.
- Y. Qi, Y. Huang, D. Jia, S.-J. Bao and Z. P. Guo, Electrochim. Acta, 2009, 54, 4772 CrossRef CAS.
- J. H. Lee, S. M. Yoon, B. K. Kim, J. Kim, H. W. Lee and H. S. Song, Solid State Ionics, 2001, 144, 175 CrossRef CAS.
- K. Ariyoshi, R. Yamato and T. Ohzuku, Electrochim. Acta, 2005, 51, 1125 CrossRef CAS.
- R. D. Shannon, Acta Crystallogr., Sect. A: Cryst. Phys., Diffr., Theor. Gen. Crystallogr., 1976, 32, 751 CrossRef.
- X. Chen, X. Guan, L. Li and G. Li, J. Power Sources, 2012, 210, 297 CrossRef CAS.
- J. H. Ku, J. H. Ryu, S. H. Kim, O. H. Han and S. M. Oh, Adv. Funct. Mater., 2012, 22, 3658 CrossRef CAS.
- K. E. Swider-Lyons, C. T. Love and D. R. Rolison, Solid State Ionics, 2002, 152–153, 99 CrossRef CAS.
- A. R. West, Solid State Chemistry and Its Applications. 1984, John Wiley & Sons, New York Search PubMed.
- P. Poizot, S. Laruelle, S. Grugeon, L. Dupon and J.-M. Tarascon, Nature, 2000, 407, 496 CrossRef CAS.
- A. S. Aricò, P. Bruce, B. Scrosati, J.-M. Tarascon and W. van Schalkwijk, Nat. Mater., 2005, 4, 366 CrossRef.
- M.-K. Song, S. Park, F. M. Alamgir, J. Cho and M. Liu, Mater. Sci. Eng., R, 2011, 72, 203 CrossRef.
- L. Ji, Z. Lin, M. Alcoutlabi and X. Zhang, Energy Environ. Sci., 2011, 4, 2682 CAS.
- K. Amine, I. Belharouak, Z. Chen, T. Tran, H. Yumoto, N. Ota, S.-T. Myung and Y.-K. Sun, Adv. Mater., 2010, 22, 3052 CrossRef CAS.
- H. Ge, N. Li, D. Y. Li, C. S. Dai and D. L. Wang, Electrochem. Commun., 2008, 10, 1031 CrossRef CAS.
- S. Takai, M. Kamata, S. Fujine, K. Yoneda, K. Kanda and T. Esaka, Solid State Ionics, 1999, 123, 165 CrossRef CAS.
Footnote |
| † Electronic supplementary information (ESI) available. See DOI: 10.1039/c2ta00048b |
| This journal is © The Royal Society of Chemistry 2013 |
