 Open Access Article
 This Open Access Article is licensed under a
 Creative Commons Attribution 3.0 Unported Licence
Transient shear banding in viscoelastic Maxwell fluids
Arttu
Lehtinen
a,
Antti
Puisto
*a,
Xavier
Illa
b,
Mikael
Mohtaschemi
a and
Mikko J.
Alava
a
aAalto University, Department of Applied Physics, P.O.Box 14100, FI-00076 AALTO, Espoo, Finland. E-mail: Antti.Puisto@aalto.fi; Fax: +358 9 855 4019; Tel: +358 50 433 3828
bDepartament d'Estructura i Constituents de la Matèria, Facultat de Física, Universitat de Barcelona, Martí i Franquès 1, E-08028 Barcelona, Spain
First published on 25th June 2013
Abstract
The fluidization of complex fluids is studied in the context of a Maxwell viscoelastic structural fluid model and compared to the purely viscous case. Solving iteratively the structural models together with the Navier–Stokes equation for the circular Couette flow gives spatially and temporally resolved velocity fields closely resembling those found experimentally for viscoelastic carbopol gels. Namely, transient shear banding is found during the initial fluidization phase. Although both structural models show transient shear bands, the viscoelastic one captures the experimental observations in greater detail, showing, for instance, the elastic backward flows during the transient shear band initialization stage.
1 Introduction
Complex fluids are often formed of a composition consisting of an internal phase and a surrounding liquid medium.1 The structure forming internal phase can be formed of either gas, solids, or a liquid of different viscosity. In the continuum, complex fluids appear to have states that resemble both solid and liquid phases depending on the externally applied stress.2 Under certain conditions, this complexity manifests itself in non-linear and non-homogeneous flow behavior.3 The transition from the solid to the liquid state is called yielding. In the yielding process, the internal structure of the complex fluid breaks under the influence of the external stress and strain as a response to the supplied mechanical energy.4 For shear thinning fluids, such as aggregating colloids, the structure is usually less organized at high shear rates, whereas at low shear rates, the internal phase tends towards a space-filling structure.5 If the concentration of the internal phase is high enough, below a certain applied stress, called the yield stress, the internal structure fills the surrounding medium completely preventing the flow in a dynamical arrest.6 Interestingly, the internal structure might also evolve without any applied shears, altering the value of the yield stress.7 The origins of such aging are somewhat unclear, but it is often thought that it is due to the thermal re-organization of the structure elements over time towards deeper potential wells, known to occur in glasses.8 Aging is also reflected in the rheological characterization, as the global and local flow curves tend to differ for aging samples,7,9 as determined using combined spatially resolved velocimetry and global rheology experiments.10,11For the so-called simple yield stress fluids, the thermal re-organization of the structure elements is absent. Moreover, since the rheology of simple yield stress fluids, unlike that of the thixotropic ones, allows no static shear bands, from a theoretical viewpoint their intrinsic steady state flow curves are monotonic having no critical shear rates that could be associated with shear banding.7,9 This definition of thixotropy does not consider the time-evolution of the flow behavior, but comes strictly from the existence of static shear bands. This simplifies the categorization of simple and thixotropic complex fluids, as also the simple yield stress fluids have been demonstrated to show time-dependent rheology.12 There are only a few materials that can be classified as simple yield stress fluids.13 These include carbopol gels and some emulsions. In such materials the internal space filling structure is formed of deformable or elastic soft elements with repulsive interactions.14 At yielding the soft elements change their shape or size, which allows them to pass by other elements enabling large scale structure deformations.14 At rest, the deformation of the soft elements quickly disappears and the system jams. Therefore, no noticeable aging at rest is observed.15
Despite the absence of the static shear bands, the dynamics of yielding of the simple yield stress fluids has recently been demonstrated to show non-trivial spatial and temporal behavior.16 During the yielding transient, shear banding is observed in a narrow gap Couette cell as well as in a cone and plate rheometer. The lifetime of this transient shear band (TSB) is observed to show critical slowing down with both the imposed shear rate and shear stress hinting towards a phase transition.17 Furthermore, the relationship of the scaling exponents between the stress and strain rate controlled experiments has been suggested to relate to the steady state flow curve of the complex fluid.18
Since experiments tend to be limited due to restrictions in the parameter space and timescale, simulations are an important part in the study of complex fluids. Such rheological simulations are mostly performed at the continuum level using simple phenomenological models, or at the mesoscopic scale using trap models. The trap models have physical interpretation closer to the simple yield stress fluids, since they can be thought of as resembling particles hopping between local energy minima.19 The SGR model (Soft Glass Rheology) is the most common example of these types of models.20
For bubbly flows there is a close-to ab initio model, describing the deformation of bubbles while they pass one another under shear, which also depicts a simple yield stress material with Herschel–Bulkley flow behavior.21 None of these models exhibit all the important properties of all complex fluids, and their limitations leave room for phenomenological continuum models. These are able to simulate the rheological characteristics of shear thinning, simple yield stress, thixotropic, and shear thickening fluids. In these models, such as the λ ones,22–25 the simple yield stress materials tend to appear as a special limiting case between shear thinning and thixotropic fluids if the parameters are suitably tuned.26,27 Since the λ-models are extremely simple and contain only few parameters, they provide a good means to analyze experimental data, thus giving tools for building more complicated and realistic models. Transient shear banding has been predicted by several of the continuum level models such as a simple viscous flow model28 and the Rolie–Poly model.29 Although the viscous model28 is able to simulate qualitatively transient properties of time-dependent materials, it lacks any description of the elastic deformation of the structure before yielding and the yield stress.
In this paper we address the elastic stress effects related to the start-up flow of yield stress fluids. The approach taken here extends our earlier attempts28 by including a dynamic yield stress and an elastic stress component describing the fluid at the level of a standard Maxwell viscoelastic model. In the model, the spatial aspects are considered by solving the structural part together with the Navier–Stokes equation for a concentric cylinder Couette device. Since the interest here lies in the start-up behavior of a simple yield stress material in general, the physical interpretation of the underlying rheology model is of minor importance. Hence, in the following we concentrate only on the interaction of the stress–strain time evolution and the Navier–Stokes equation.
The paper is constructed as follows: first the underlying λ-model is explained in detail followed by discussing the Maxwell stress model. The model description is completed with the implementation of the flow geometry and details of the applied numerical methods. The results section starts by addressing the differences between the viscous and viscoelastic models. The flow start-up behavior for the viscous and viscoelastic models is discussed in the context of recent experimental results related to fluidization dynamics. Special attention is paid to the early stage of the stress response owing to the fact that this is where the elastic stress component typically appears. Then, the scalings of the fluidization times in each case are investigated. Finally, the conclusions review the results setting them into the perspective of the model properties and suggest improvements for the models and outlooks for further research.
2 Model
To describe the fluid's internal structure, we choose a simple phenomenological rheology model, one of the commonly known λ-models.22–25,27 In these, the λ is a scalar structure parameter describing the degree of jamming of the fluid. This parameter might represent the degree of flocculation in clays, be a measure of the free energy landscape in glasses, give the fraction of particles in the potential well in colloidal suspensions,27 or represent the jammed volume fraction in unstable colloids. This particular λ-model has been demonstrated to capture the flow curves of shear thinning, simple YSF, as well as the thixotropic ones.26,27,30,31 Here, the viscosity relates to the material internal structure, the state of which depends on the history of the sample and the present flow field. In addition to the viscous dissipation, in the simplest Maxwell scheme, the elastic energy is stored in a Hookean spring having a constant elastic modulus. Following the lambda parameter the structure elasticity can also have different physical origins depending on the material under consideration. Here we discuss in depth the behavior of carbopol gels, where sponge-like elements elastically deform when sheared. In other systems such as colloidal suspensions, this structure elasticity might rise from the deformation of the aggregates, while in clays it could rise from the stretching and deformation of the flocs.The model consists of a relaxation equation for the structural parameter (λ) and a function connecting it to the fluid rheology (a constitutive equation). The time-evolution of the structure is given by a simple first order expression, which reads
 | (1) |
This equation includes the parameters τ, the characteristic timescale for structure build-up, and α, the scale of the structure destruction due to shear. The constitutive relationship connecting the λ-parameter to the suspension viscosity is:
| η(λ) = η0(1 + βλn), | (2) |
![[small gamma, Greek, dot above]](https://www.rsc.org/images/entities/i_char_e0a2.gif) → 0, is called the dynamical yield stress, which in this model is given by the ratio of α, β, and τ with
→ 0, is called the dynamical yield stress, which in this model is given by the ratio of α, β, and τ with | (3) |
In the following analysis, we choose the parameters such that as in the simple yield stress fluids, the structure recovery is fast (τ is small), the fluid responds reasonably fast to external shear (α), and the steady state flow curve follows approximately the one measured for a carbopol gel,16 fixing the other parameters (β and n). The following analysis is not particularly sensitive to the selection of these parameters, and we have conducted extensive testing by varying the parameters over several orders of magnitude (except for n), obtaining the same qualitative behaviors for the start-up flow. Naturally, the time-scales and shears can be adjusted by modifying these parameters.
In earlier work based on the same time kinetic eqn (1) the stress was selected to consist only of the viscous stress given by σ = η.26,27,30,31 In what follows we call this the viscous model. Unlike in the viscoelastic solids, the evolution of the stress in viscoelastic fluids, which are the focus here, is well captured by the Maxwell model. In the Maxwell viscoelastic model, the stress assumes a more complex shape due to the elastic stress component,32 and here reads
 | (4) |
 | ||
| Fig. 1 The time evolution of the stress in the viscous and viscoelastic models under homogeneous shear at = 5.4 s−1 with the parameters α = 10−1, β = 3 × 10⁻³, n = 1, and τ = 10−3 as applied in the following analysis. The simulation is initialized at λ0 = 2.5 × 10⁶. | ||
 | ||
| Fig. 2 Steady state flow curves computed with the parameters applied in the following analysis. | ||
To allow the simulation of spatial effects, such as shear banding, the model obviously needs to incorporate the “experimental geometry”. Experiments first reporting TSB in simple YSF were performed in a circular Couette geometry.16 We implemented the rheology model in a Couette cell to enable a direct comparison between these experiments and the model. The one-dimensional analytical solution of the Navier–Stokes equation in the radial direction for an incompressible laminar flow for this case reads31,35
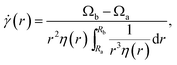 | (5) |
(r) is the local shear rate, Ωa (Ωb) is the angular velocity of the inner (outer) cylinder, and Ra (Rb) is the radius of the inner (outer) cylinder. In the simulations we use Ra = 2.39 cm and Rb = 2.50 cm which are typical values for a narrow gap Couette device and similar to the geometry used in the first observations of transient shear banding in carbopol gels,16 rotating only the inner cylinder (rotor) and fixing the outer cylinder (stator). The present approximation does not accommodate for taking into account the wall-slip effects by means other than reducing the rotational velocity by an effective slip velocity. In the following analysis, this would simply reduce the applied shear rate, and thus add a constant shift to all the results. Therefore, such an effect is neglected here. Furthermore, experimentally the fluidization time scalings, discussed in detail below, are robust against changes in the boundary conditions, well in line with this reasoning. To solve the joint system of the eqn (1)–(5), we discretize the geometry in 450 radial shells with equal Δr (other discretizations were used to make sure the results are independent of this). Each of the shells evolves a separate local Maxwell element. Thus, the local stress is given by the evolution of the structural model in the particular shell and the local variables are coupled between the shells only by the Navier–Stokes equation. The evolution of the local flow field is obtained by iteratively solving eqn (1) and (5) using an Adams–Moulton integration scheme as implemented in the SUNDIALS library package.36
We define the global shear rate as the radial average shear rate over the gap such that
 | (6) |
This quantity is used instead of defining the angular velocity of the rotating cylinder to make the simulations directly comparable with the corresponding experiments.
3 Results
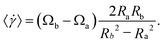
The simulations are performed using both the viscous and viscoelastic stress models to study the elastic stress effects during the start-up flow. We initialize the simulation model in a state where the viscosity of the suspension is close to jamming (complete jamming in a fluid model implies infinite viscosity) and spatially homogeneous. Simulations using such a fluid model neglect the effects related to the solid liquid transition. However, as the simulations later show, modeling the transition is not required to explain the long relaxation times and power-law scalings of the fluidization process. Furthermore, depending on the experimental protocol, like the pre-shearing and the relationship of the fluid structure relaxation time with the waiting time between the pre-shearing and the start-up initiation, such a transition does not necessarily take place even in the experiments. To define the initial state of the fluid one needs to define its pretreatment protocol as done in experiments. Since we are not quantitatively fitting our purely phenomenological model against any dataset this is not necessary here. Instead, we define the initial λ0 as appropriate for each case treating it as an input parameter for the simulations. Fig. 3 reports the typical behavior of the simulated shear rate and velocity profiles over the Couette gap during the flow start-up applying the viscous stress model. At the onset of shearing, the shear rate first localizes close to the rotor. Starting from extremely jammed initial configurations, this localization is so intense that it might be confused with wall-slip. However, this is a built-in property of the system caused by the fluids shear thinning interacting with the stress balance constraint coming from the Couette boundary conditions. After this, two bands associated with high and low shear rates are formed, and the shear band edge begins to travel towards the stator. Finally, the low shear rate shear band vanishes as the edge of the two bands reaches the stator resulting in a homogeneous flow profile. The fluidization in the viscous model as expected follows the route observed in a simple time-dependent Newtonian model.28 This is noteworthy, as the present model exhibits a dynamic yield stress as opposed to that model. This confirms that the yield stress does not play a significant role in the dynamic fluidization scenario, but rather the time dependent structural changes drive the process.28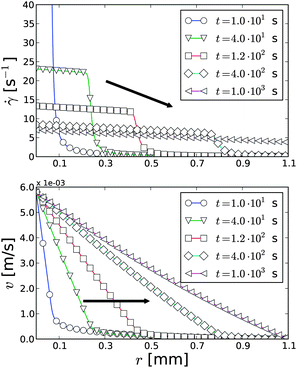 | ||
| Fig. 3 The simulated shear rate and velocity profiles during a start-up flow starting from a homogeneous, high-viscous initial configuration in the viscous model with 〈〉 = 5.4 s−1. The simulation parameters used for the velocity profiles are α = 0.1, τ = 0.001, η0 = 1.0, β = 0.003, and λ0 = 2.5 × 10⁶. | ||
The shear profiles also reflect these findings. The plot in Fig. 4 shows the time-evolution of the shear over the gap. In the different panels, the same symbols correspond to the same shear displacements in the inner shell. Comparing the curves for the different applied shear rates demonstrates that the shearing occurs in a shear rate invariant fashion for the high shear rate range in the viscous stress model. At lower shear rates, shear localization occurs.9,30 In these cases the fluidization is not complete due to the relationship between the steady state flow curve and the stress distribution in the Couette cell.
 | ||
| Fig. 4 Time evolution of the shear in the Couette gap using the viscous stress model with different imposed average shear rates. The transient shear banding occurs in a shear rate invariant fashion at high shear rates. At 〈〉 = 2.5 s−1 shear localization occurs preventing complete fluidization, which is reflected by the milder shearing of the parts close to the non-rotating cylinder. The same parameters as in Fig. 3 were used. | ||
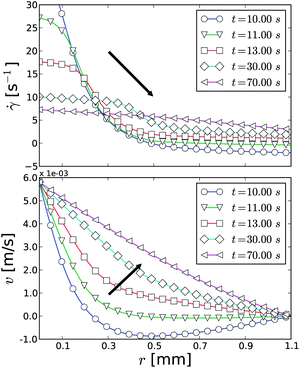
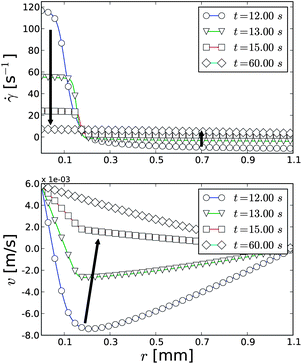
The velocity profiles during a start-up of the viscoelastic stress model contrast the ones for the viscous stress model. Some typical examples of the start-up flows are plotted in Fig. 5. Similar to the viscous case, the shear rate first gradually localizes close to the rotor. Depending on the shear rate, the elastic modulus, and λ0, this localization is either followed by a viscoelastic recoil flow (high initial viscosity, and small elastic modulus), or the growth of a transient shear band (intermediate viscosity, and high elastic modulus).
 | ||
| Fig. 5 The simulated shear rate and velocity profiles in the viscoelastic model during a flow start-up from a homogeneous, high viscosity state with 〈〉 = 5.4 s−1. The applied simulation parameters are α = 0.1, τ = 0.001, η0 = 1.0, β = 0.003 and G0 = 5.0, and λ0 = 2.5 × 10⁵. | ||
Also during the transient shear band relaxation the two responses differ. While in the viscous case the low shear band remains almost completely unsheared (Fig. 3), in the viscoelastic one, the shear rate in the low shear band increases gradually during the relaxation period. This can be spotted in Fig. 5, where the shear band edge in the velocity profile penetrates the gap only slightly before the velocity in the quiescent band begins to increase in a homogeneous fashion. Furthermore, clearly, the shear profiles are not shear rate invariant in the viscoelastic model (Fig. 6) in contrast to those in the viscous one (Fig. 4). This is due to the additional time derivative of the stress coming from the Maxwell element, which can induce a shear rate independent relaxation time scale.
 | ||
| Fig. 6 Time evolution of the shear in the Couette gap using the viscoelastic stress model with different imposed average shear rates. In this case, the shear strain profiles are not shear rate invariant. The same parameters as in Fig. 5 were used. | ||
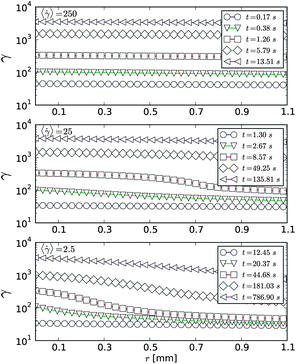
Starting from higher λ0 changes the relaxation path of the transient shear band even qualitatively. Instead of relaxing towards the outer edge of the Couette device, here, the shear band edge remains almost steady while the shear rate in each band evolves towards the homogeneous flow as pointed out by the arrows in Fig. 7. Furthermore, during the formation of the shear band, a strong elastic recoil flow related to the faster breaking of the structure next to the rotor can be observed.
 | ||
| Fig. 7 Shear rate (upper panel) and velocity (lower panel) as a function of the position in the Couette gap for the viscoelastic model with 〈〉 = 5.4 s−1. The arrows point the direction of the shear band time-evolution. The simulation parameters applied are α = 0.1, τ = 0.001, η0 = 1.0, β = 0.003, G0 = 5.0, and λ0 = 2.5 × 10⁶. | ||
As one could expect, the stress in the viscoelastic model shows linear growth during the early phase of the start-up as shown in Fig. 8. This is the linear elastic stress growth, which is caused by the initial loading of the spring in the Maxwell elements. A turning point in the stress (the stress maximum) follows the elastic part. This occurs at the time when both, the viscous and elastic stresses, begin to decrease as the viscosity approaches its steady shear value associated with the applied shear rate. This behavior of the stress is very similar to the one observed in the Soft Glassy Rheology (SGR) model.37 There the elastic stress overshoots were associated with the formation of the transient shear bands. Here, the transient shear bands occur due to the delayed adaptation of the structure corresponding to the uneven shear rate profile (stress overshoots occur even under homogeneous shear). Therefore, we interpret the stress overshoots as simply a route for the relaxation, rather than the cause of the transient shear bands. A comparison between the shear profile evolution and the stress overshoot indicates that the transient shear band appears always right after the stress maximum, precisely as seen experimentally for carbopol gels.38
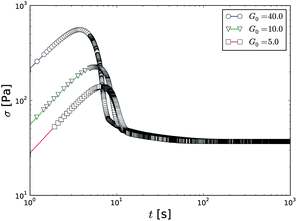 | ||
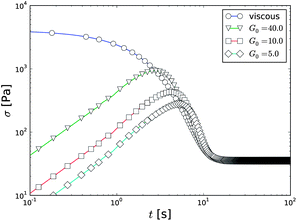
| Fig. 8 Stress overshoots during the fluidization with different values of the elastic modulus with 〈〉 = 5.4 s−1. The applied simulation parameter are α = 0.1, τ = 0.001, η0 = 1.0, β = 0.003, and λ0 = 2.5 × 10⁶. | ||
The stress overshoot depends on the rate parameters of the model, however, if the steady state is fixed, it is rather trivial to see that the only real degree of freedom in eqn (1) and (2) is λ0, the initial condition. Therefore, a parameter sweep over a range of λ0 is performed and plotted in Fig. 9. The stress overshoot maximum expectedly increases with λ0 and its shape turns from relatively smooth to a rather peaked one. After the stress maximum, the stress rather rapidly decreases, until a certain point after which the decrease slows down dramatically.
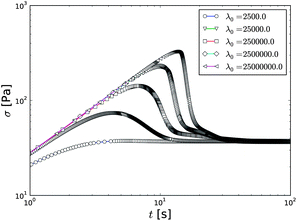 | ||
| Fig. 9 Stress overshoots in the viscoelastic model during the fluidization with different values of the λ0 with 〈〉 = 5.4 s−1. The other parameters are α = 0.1, τ = 0.001, η0 = 1.0, β = 0.003, and G0 = 10.0. | ||
In the experiments combining rheometry and ultrasound velocimetry, this particular dramatic slowing down in the stress reduction was associated with Transient Shear Banding in carbopol gels.18 We plot again one of the stress curves from Fig. 9 and show in Fig. 10 along with snapshots of the associated velocity profiles to observe that this is indeed the case in the model, too.
 | ||
| Fig. 10 The fluidization in the viscoelastic model relating the velocity profiles to the stress overshoot. The applied simulation parameter are α = 0.1, τ = 0.001, η0 = 1.0, β = 0.003, G0 = 5.0, λ0 = 2.5 × 10⁶, and 〈〉 = 5.4 s−1. | ||
In both models the transient shear banding times (and the related stress relaxation in the heterogeneous stress case) are long compared to the homogeneous stress relaxation times (Fig. 1 and 8). The stress overshoot under the homogeneous and heterogeneous shear appears roughly at the same time, but the steady state stress is only reached a decade later in the heterogeneous case due to the transient shear bands. Thus, the transient shear bands observed in these simulations seem to correspond very well to those in the start-up experiments. Furthermore, the stress relaxation diagrams show a transition from the elastic stress overshoot to the slowly decaying stress pattern, which in the experimental papers is called the ‘hump’, and is interpreted as a sign of transient shear bands due to its appearance during the transient shear banding phase.
The edge of the two shear bands is estimated to be at the location of the maximum of the second spatial derivative of the shear rate ( ). Monitoring the evolution of the shear band width during the start-up shows different patterns for both the viscous and viscoelastic stress models. In the viscous model, as shown in Fig. 11 (upper panel), at high shear rates the width of the shear band follows a uniform shape, characterized by an initial induction period, during which the shear bands are formed. After that the shear band width grows with a constant velocity until the whole gap flows. The evolution curves can be collapsed, as demonstrated earlier for a similar (but not the same) structural model,28 by re-scaling the time axis with the destruction term in the relaxation equation. However, at low shear rates the dynamic yield stress, which eventually prevents complete fluidization, starts to dominate, breaking the otherwise perfect scaling. In the viscoelastic stress model this pattern is more complex, Fig. 11 (lower panel). Similar to the viscous case, it shows an initial induction period, during which the shear band is created. This is followed by the fluidization of an initial layer, the depth of which depends on the shear rate. Finally the process ends with a sudden complete fluidization at high shear rates, or in shear localization at low shear rates. Starting from smaller λ0 gives a slightly modified evolution behavior also for the shear band width (not shown), which is simply a mixture of the two evolutions, the viscous and viscoelastic ones, described above. Experimental observations for the shear band evolution in a simple yield stress fluid38 show similarities to the ones shown for the viscoelastic stress model (Fig. 11). In the experiments, too, at certain times, the shear band width stops growing, and after a while a sudden jump in the shear band width is detected as the sample completely fluidizes.
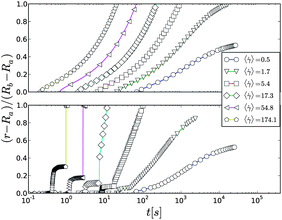 | ||
| Fig. 11 The position of the shear band edge (width of the shear band) in the gap for viscous (upper panel) and viscoelastic (lower panel) stress models with different values of the imposed shear rate. The model parameters are α = 0.1, τ = 0.001, η0 = 1, β = 0.003, λ0 = 2.5 × 10⁶, and G0 = 40.0 (viscoelastic case). | ||
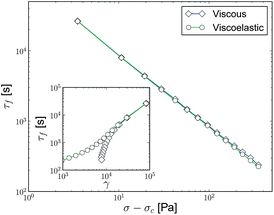
The fluidization times, defined as the time when the TSB reaches the stator, were experimentally observed to follow power-laws with different exponents associated with the shear rate and stress controlled driving modes.16 Moreover the ratio of these two exponents was found to give directly the Herschel–Bulkley exponent of the corresponding steady state flow curve.18 Here we apply the same definition of the fluidization time, and trace the location of the shear rate spatial derivative minimum. The fluidization times in the viscous model, which includes a dynamical yield stress, plotted in Fig. 12 also follow power-laws at high shear rates, here, being inversely proportional to the imposed shear rate. This is well in line with the observations from a simple viscous model exhibiting no yield stress;28 there the fluidization times were found to be inversely proportional to the destruction term exponent of the kinetic equation. Here this destruction term exponent equals unity. However, at low shear rates, the fluidization times diverge. This is again due to shear localization. In this scenario, the shear band edge vanishes into a smooth transition zone from shear to no shear and does not reach the stator. However, the experiments did not find such a feature for carbopol.18 This apparent contradiction is explained by the comparison between the experimental and simulated steady state flow curves, and considering the stress distribution in the Couette. At small shear rates the theoretical flow curves are flatter compared to the experimental ones (which apparently continue decreasing even at the smallest measured shear rate). This causes the shear localization to appear at higher shear rates in the simulations compared to the experiments for carbopol.
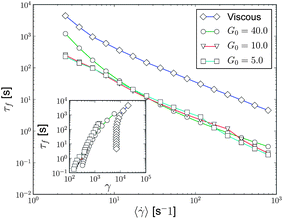 | ||
| Fig. 12 The fluidization times against the over-edge shear rate in the viscous and Maxwell models in the shear rate controlled case. The simulation parameters used are α = 0.1, τ = 0.001, η0 = 1.0, β = 0.003, and λ0 = 2.5 × 10⁶. The inset compares the fluidization time to the shear at fluidization. | ||
In the viscoelastic model the data scattering of the fluidization times is somewhat bigger due to the fact that our criterion for the fluidization is not straightforward, as the propagation of the shear band edge is not as easy to define as in the viscous stress model. Thus, the fluidization times show some scatter, and moreover do not follow a power-law even in the high shear rates (Fig. 12). If a power-law is fitted against the simulated fluidization times, the power-law exponent is a bit smaller than that for the viscous model. The absolute values of the fluidization times are overall much shorter compared to the viscous stress model as expected given the additional elastic effects. The divergence of the fluidization times at small shear rates due to the dynamic yield stress appears also in the viscoelastic model. The inset of Fig. 12 compares the fluidization time against the fluidization shear. Since the imposed shear rate (angular velocity) is constant, the plot in the inset resembles the shape of the plot of fluidization time against the shear rate. In the viscoelastic case, the fluidization against the shear rate has a small slope, whereas in the viscous model, the fluidization shear is almost constant excluding the part where the shear localization occurs.
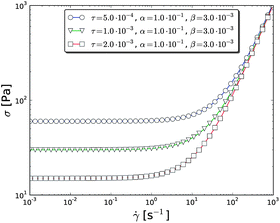
In the stress controlled case, the viscous model captures the experimental observation that the fluidization times also decay with a power-law as a function of the reduced stress (Fig. 13).16 Similar to the simple Newtonian model a trivial exponent relationship was suggested to map the two time-scales to the Herschel–Bulkley steady state flow curve, comes out in the viscous model, leaving the experimental relationship still without a correspondence.28 In the viscoelastic model, a separate simulation would not be needed, since under a constant stress, the model response can be trivially shown to follow that for the viscous model by plugging ∂σ/∂t = 0 into eqn (4). The small shift in the fluidization times between the viscous and viscoelastic stress models is due to a small numerically caused start-up stress over-shoot of the viscoelastic model, which reduces the induction period before the transient shear banding process. The same effect is even more clearly seen in the inset, where the fluidization time is compared with the fluidization shear, as the fluidization shear is reducing more at the short fluidization times i.e. high imposed stresses. Due to the fact that the power-law exponents of the two cases, the shear rate controlled, and the stress controlled ones, are roughly the same, neither of the models could explain the experimental observation of the power-law exponent relationship.
 | ||
| Fig. 13 Fluidization times vs. reduced stress for viscous and viscoelastic models in the stress controlled simulation. The simulation parameters are the same as in the shear controlled case. The inset plots the fluidization time against the shear at fluidization. | ||
Changing the gap width had no observable effect on the experimental view of the fluidization.16 This means that for some reason the traveling velocity of the shear band edge is different depending on the device geometry, although the global shear rate is the same. In the simulations shown in Fig. 14, the fluidization times with constant shear rate depend on the gap width. In the viscous case, a monotonic power-law like increase in the fluidization time is seen. However, in the viscoelastic case at small gaps the fluidization time is almost constant, even decreasing, but after a certain threshold, it increases towards the wider gaps. The experiments were performed with reduced gaps between 0.04 and 0.12, where the fluidization times in the viscoelastic simulation vary roughly 10%. This weak dependence may be close to the experimental observations.
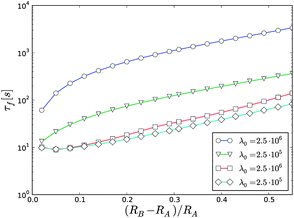 | ||
| Fig. 14 Fluidization time with different reduced gaps. Circles and triangles represent the viscous, and squares are for the viscoelastic model. The global shear rate was set to 〈〉 = 30.0 to avoid shear localization even at the largest gaps. | ||
4 Conclusions
We have here studied a variant of the λ-model family with the viscoelastic Maxwell response. This shows during the initial phase of the flow start-up, stress overshoots related to the elastic stress growth. A relaxation period follows the stress peak beginning with a recoil backward flow comparable to that found frequently in shear ramps induced to polymer melts.29 During the onset of the recoil flow, the system splits into two shear bands. A highly sheared band nucleates right next to the rotor, while the rest of the gap remains under a quiescent flow. This process initiates by the geometry induced shear inhomogeneity, which is inherent to the circular Couette geometry.This reason and the related observations are common for both viscous and viscoelastic stress models. The time-dependent shear thinning of the present models tends to decrease the structural parameter at the fastest rate where the shear stress has the highest value. Therefore, the parts of the fluid close to the rotor tend to relax first while the other parts follow later. In other words, the flow geometry together with a shear thinning fluid set up a positive feedback loop between the local viscosity and the local shear rate. Owing to the dynamic yield stress, the shear rate localization in the highly sheared parts of the device cause an increase of the viscosity in the other parts of the geometry (due to the same stress balance, which induces the transient shear band).
After the initial start-up, for the viscous stress model the edge of the two bands moves towards the stator gradually increasing the thickness of the high shear band finally reaching either homogeneous flow (high applied shear rates) or shear localization (low shear rates). In the viscoelastic stress model, the scenario is more complicated, and the relaxation pattern depends on the initial value of the λ. While in the viscous model, the slowly sheared band is almost quiescent, in the viscoelastic case, the slowly sheared band is evolving throughout the relaxation. Furthermore, in the viscoelastic stress model two separate modes of relaxation depending on the initial state of the structure appear: one with a viscous-like relaxation of the transient shear band, and the other characterized by an intense backward flow during the shear band formation. These separate relaxation paths are related to the selection of the initial structure parameter λ0. Starting at high λ0 induces the intense backward flows, whereas lower λ0 gives a more moderate elastic response. This hints of eventual experimental tests.
The viscoelastic stress model realistically describes the stress overshoots associated with the start-up flow. Furthermore, the timing of the stress overshoot and the initialization of the shear band match with the experimental observations for carbopol gels. The shape of the stress overshoots can be controlled as expected by adjusting the time-constants of the structural model, which were shown to be linked with the λ0.
In the experiments for carbopol gels,16 a power-law dependence was found for the relationship of the fluidization time and the applied shear rate, or applied reduced stress. This scaling law had different exponents for shear rate controlled and shear stress controlled experiments. A similar (but not the same) behavior is found for both of the stress models. The power-law dependence is less than perfect for the elastic stress model, however. Moreover, the scaling exponent has the same value for both stress and shear rate controlled cases, and in both cases it differs from the experiments. This demonstrates that while the Maxwell stress model manages to capture many of the experimental details, there still exist some open questions. These might be related to the fact that the Maxwell model is designed for the fluid state and therefore does not properly describe creep deformation observed in solids, and sometimes even in the fluidization of simple YSFs under stress control.18 Related to this, in stress control the start-up flow of the viscoelastic stress model follows that of the simple viscous one. This leads to the same scaling of the fluidization times with the reduced stress in the Maxwell model and in the viscous model. In contrast, the experiments found the fluidization time exponent to be larger in the stress controlled case compared to the shear controlled one as suggested by the Herschel–Bulkley exponent (0.5 for the actual experimental case) and the Ansatz that relates the two fluidization exponents to the Herschel–Bulkley exponent.18
The search for a right fluidization dynamics might be helped by adding a Kelvin–Voigt stress element to the present stress model. However, we are left with two fundamental questions that we cannot answer at the time of writing. Why should the experimental systems show viscoelastic effects, i.e. what is the microscopic mechanism that clearly might be present given the similarity of the model and experiment? Why should the fluidization times be dominated by the part of the system that flows, is thus above the yield stress, and thus exhibits the Herschel–Bulkley scaling?
Acknowledgements
This work was supported by the Effnet program in the Finnish Forest Cluster Ltd, and the EU framework 7 program SUNPAP. Also, the support from the Academy of Finland through the COMP center of excellence and the project number 140268 and within the framework of the International Doctoral Programme in Bioproducts Technology (PaPSaT) is acknowledged. Furthermore, X.I. acknowledges the financial support from the Spanish Ministry of Science (Programa Juan de la Cierva, and MAT2010-15114).References
- C. L. A. Berli and D. Quemada, Langmuir, 2000, 16, 7968–7974 CrossRef CAS.
- P. C. F. Møller, A. Fall and D. Bonn, Europhys. Lett., 2009, 87, 38004 CrossRef.
- F. Pignon, A. Magnin and J.-M. Piau, J. Rheol., 1996, 40, 573 CrossRef CAS.
- P. Coussot, N. Roussel, S. Jarny and H. Chanson, Phys. Fluids, 2005, 17, 011704 CrossRef.
- G. Barthelmes, S. Pratsinis and H. Buggisch, Chem. Eng. Sci., 2003, 58, 2893–2902 CrossRef CAS.
- G. Biroli, Nat. Phys., 2007, 3, 222–223 CrossRef CAS.
- A. Fall, J. Paredes and D. Bonn, Phys. Rev. Lett., 2010, 105, 225502 CrossRef.
- A. J. Liu and S. R. Nagel, Nature, 1998, 396, 21–22 CrossRef CAS.
- G. Ovarlez, S. Rodts, X. Chateau and P. Coussot, Rheol. Acta, 2009, 48, 831–844 CrossRef CAS.
- S. Manneville, Rheol. Acta, 2008, 47, 301 CrossRef CAS.
- D. Bonn, S. Rodts, M. Groenink, S. Rafa, N. Shahidzadeh-Bonn and P. Coussot, Annu. Rev. Fluid Mech., 2008, 40, 209 CrossRef.
- T. Divoux, V. Grenard and S. Manneville, Phys. Rev. Lett., 2013, 110, 018304 CrossRef.
- A. Ragouilliaux, G. Ovarlez, N. Shahidzadeh-Bonn, B. Herzhaft, T. Palermo and P. Coussot, Phys. Rev. E: Stat., Nonlinear, Soft Matter Phys., 2007, 76, 051408 CrossRef CAS.
- J. Piau, J. Non-Newtonian Fluid Mech., 2007, 144, 1–29 CrossRef CAS.
- D. Bonn and M. M. Denn, Science, 2009, 324, 1401–1402 CrossRef CAS.
- T. Divoux, D. Tamarii, C. Barentin and S. Manneville, Phys. Rev. Lett., 2010, 104, 208301 CrossRef.
- T. Divoux, D. Tamarii, C. Barentin, S. Teitel and S. Manneville, Soft Matter, 2012, 8, 4151 RSC.
- T. Divoux, C. Barentin and S. Manneville, Soft Matter, 2011, 7, 8409 RSC.
- D. Bonn, P. Coussot, H. T. Huynh and F. Bertrand, Europhys. Lett., 2002, 59, 786 CrossRef CAS.
- P. Sollich, F. Lequeux, P. Hébraud and M. E. Cates, Phys. Rev. Lett., 1997, 78, 2020–2023 CrossRef CAS.
- J. R. Seth, L. Mohan, C. Locatelli-Champagne, M. Cloitre and R. T. Bonnecaze, Nat. Mater., 2011, 10, 838 CrossRef CAS.
- J. Mewis and N. Wagner, Adv. Colloid Interface Sci., 2009, 147, 214–227 CrossRef.
- J. Sherwood, J. Non-Newtonian Fluid Mech., 2008, 154, 109–119 CrossRef CAS.
- K. Dullaert and J. Mewis, J. Non-Newtonian Fluid Mech., 2006, 139, 21–30 CrossRef CAS.
- A. Mujumdar, A. Beris and A. Metzner, J. Non-Newtonian Fluid Mech., 2002, 102, 157–178 CrossRef CAS.
- P. C. F. Møller, A. Fall, V. Chikkadi, D. Derks and D. Bonn, Philos. Trans. R. Soc. London, Ser. A, 2009, 367, 5139–5155 CrossRef.
- P. Coussot, Q. Nguyen, H. T. Huynh and D. Bonn, Phys. Rev. Lett., 2002, 88, 175501 CrossRef.
- X. Illa, A. Puisto, A. Lehtinen, M. Mohtaschemi and M. J. Alava, Phys. Rev. E: Stat., Nonlinear, Soft Matter Phys., 2013, 87, 022307 CrossRef.
- J. M. Adams, S. M. Fielding and P. D. Olmsted, J. Rheol., 2011, 55, 1007 CrossRef CAS.
- P. C. F. Møller, J. Mewis and D. Bonn, Soft Matter, 2006, 2, 274 RSC.
- N. Roussel, R. Le Roy and P. Coussot, J. Non-Newtonian Fluid Mech., 2004, 117, 85–95 CrossRef CAS.
- W. Lai, D. Rubin and E. Krempl, Introduction to continuum mechanics, Butterworth-Heinemann, 1999 Search PubMed.
- P. de Souza Mendes, J. Non-Newtonian Fluid Mech., 2009, 164, 66–75 CrossRef CAS.
- A. Putz and T. Burghelea, Rheol. Acta, 2009, 48, 673–689 CrossRef CAS.
- R. J. Phillips, R. C. Armstrong, R. A. Brown, A. L. Graham and J. R. Abbott, Phys. Fluids A, 1992, 4, 30 CrossRef CAS.
- S. D. Cohen and A. C. Hindmarsh, Comput. Phys., 1996, 10, 138 Search PubMed.
- R. L. Moorcroft, M. E. Cates and S. M. Fielding, Phys. Rev. Lett., 2011, 106, 055502 CrossRef.
- T. Divoux, C. Barentin and S. Manneville, Soft Matter, 2011, 7, 9335 RSC.
| This journal is © The Royal Society of Chemistry 2013 |