 Open Access Article
Creative Commons Attribution 3.0 Unported Licence
Optimised determination of viscoelastic properties using compliant measurement systems†
James W.
Andrews
*a,
James
Bowen
a and
David
Cheneler
b
aSchool of Chemical Engineering, The University of Birmingham, Edgbaston, B15 2TT, UK. E-mail: ANDREWJW@BHAM.AC.UK; Fax: +44 (0)121 414 5354; Tel: +44 (0)121 414 5080
bSchool of Mechanical Engineering, The University of Birmingham, Edgbaston, B15 2TT, UK
First published on 3rd May 2013
Abstract
An analysis of a novel indentation model has been implemented to obtain master curves describing the optimal experimental parameters necessary to achieve the highest possible accuracy in the determination of viscoelastic properties of soft materials. The indentation model is a rigid indenter driven by a compliant measurement system, such as an atomic force microscope or optical tweezers, into a viscoelastic half space. The viscoelastic material is described as a multiple relaxation Prony series. The results have been extended via an application of a viscoelastic equivalence principle to other physical models such as poroelasticity. Optimisation of the indentation parameters has been conducted over many orders of magnitude of the velocity, viscoelastic moduli, spring stiffness, relaxation times and the duration of indentation resulting in a characteristic master curve. It is shown that using sub-optimal conditions gives the appearance of a more elastic material than is actually the case. For a two term Prony series the ideal ramp duration was found to be approximately one eighth of the relaxation. Also the ideal ramp duration for a three term Prony series was determined and shown to guarantee distinct relaxation times under specific conditions.
1 Introduction
Currently, indentation is a popular method of determining the properties of soft viscoelastic materials such as biological tissues1 and polymers.2 In particular, determination of the properties of individual cells3 has applications in cancer detection,4–6 optimal design of cell separators,7 mechanotransduction8 and actin remodelling.5 Hydrogels are soft materials which can be biocompatible9,10 allowing stem cell seeded hydrogel scaffolds to culture cells for biomedical applications,11 further the mechanotransduction networks of the cells are dependent on the mechanical properties of the hydrogel in which they are grown and can affect the differentiation of the cells.An understanding of the mechanical properties from a micro- to macroscopic length scale12,13 is of interest to understand the microstructure of hydrogels. For cases such as these, compared to other techniques like tensile14 and bending tests,15 indentation can be advantageous as it allows for the consistent application of loads,16 the simple acquisition of transient data17 and the sample can be tested in the most convenient environment, be it aqueous or otherwise.18 However the usefulness of this technique at small length scales is limited by the compliance of the measurement equipment,19 which is inherent in many highly accurate systems such as atomic force microscopy (AFM) and optical tweezers (OT). Further the relaxation to the equilibrium state proceeds more rapidly at small length scales.20
Typically, in order to measure transient data, two techniques are employed: creep testing and stress relaxation.21 In these cases, the force applied or indentation depth of the probe is increased to a set value and then held constant whilst the other parameter, depth or force respectively, is monitored. Classically, these techniques in general demand that the maximum force or indentation depth is attained instantaneously in order to allow for simple mathematical analysis using step functions.22 This condition is an idealised situation unattainable experimentally, due to finite acceleration, resulting in experiments where the analysis can only ever be approximate as relaxations in the material that occur during the instrument ramp in force or displacement are neglected.23,24 The appropriateness of the idealised models is diminished further when the compliance of the indentation device is considered. All instruments incorporate an element of compliance, which is usually an inherent property of the measurement system. When indentation is performed using compliant systems, the fixed end of the compliant component is controlled. If possible, this ‘fixed end’ can be driven so that the deflection of the beam is maintained, via feedback control, such that the force applied to the sample increases linearly to a set value and then held so that it resembles a classic creep test.25 However, force control can be difficult to achieve for highly compliant systems. In contrast, a prescribed fixed end motion is experimentally achievable but precludes simple analysis.
The analysis is based on the theory derived for the case of the indentation of a rigid sphere into a planar elastic half space, considered first by Hertz26 and subsequently the indentation of a rigid sphere into a planar viscoelastic half space as considered by Lee and Radok.27 While Lee and Radok27 considered the response of a Maxwell fluid, Yang28 extended the theory to a standard linear solid (SLS) indenting under its own weight. It should be noted that the theoretical analysis of Lee and Yang does not describe the response of the material when the sphere is retracted from the viscoelastic half space. Removing the sphere requires additional constraints to ensure that the stress and strain fields are continuous in time; Ting29,30 developed an approach to deal with this case, but this approach will not be developed further here. The next major development in the theory of creep testing considered the effect of increasing the force to a maximum value in a finite time before it is held constant.31 Incorporating the effect of system compliance has been considered in certain situations, especially for the AFM, yet these solutions are few and involve solving the full beam equation for an oscillating cantilever;32,33 they do not apply for a cantilever which is not oscillating.
Here the indentation of a viscoelastic material by a rigid sphere attached to a compliant indentation system is considered. In order to ensure the mathematics describes the most convenient experimental set-up whereby force feedback is not necessary, nor are instantaneously applied loads, the model assumes the sphere is driven into the material via a compliant element. Furthermore, it is assumed that the fixed end is driven with a constant velocity to a specified distance and held constant; an experimental set-up that is easy to create accurately. The equipment that is frequently used to indent materials is investigated along with an example of each of the four major classes of materials of interest in the literature. This explains why the subsequent developments are necessary to improve the accuracy of measurement of viscoelastic properties. It is shown that the indentation depth and the measured force are coupled in a complex manner that can be described exactly by non-linear Volterra equations. These equations include the effects of the finite time of the ramp, the compliance of the system and the effects of the pre-load which is often unavoidable during experimentation. For the case where the compliance tends to infinity, the exact equations are solved asymptotically. The exact equations do not have an analytical solution and need to be solved numerically. The method for doing so is explained in the ESI [Section 2].†
Analyses of the exact equations show that there are values of the experimental parameters that lead to less than ideal indentation conditions that will result in low accuracy measurements. It is shown that there are ideal experimental parameters that ensure maximum possible accuracy. The procedure for deducing the optimal experiment for a range of machines and materials is presented. Also discussed are the implications of the assumptions used in the derivation of the model, including the assumption of affine deformations implicit in assuming the material is a linear viscoelastic material.
2 Experimental considerations
Here we introduce a range of instruments that are commonly used to measure the viscoelastic properties of a material via an indentation experiment, and present a schematic which incorporates the elements common to each instrument. We outline the range of experimental parameters associated with each instrument and the types of materials which can be tested.2.1 Instruments
There are four main types of instrument that can be used for indentation: AFM, nanoindenter (NI), mechanical tester (MT) and optical tweezers (OT). Other instruments exist, but they are commonly comparable in essence to these instruments. These instruments share a common mode of operation during indentation testing, although the full range of measurements possible with each type of instrument is vast. Fig. 1 shows the standard elements present in a measurement performed using one of these instruments. These include: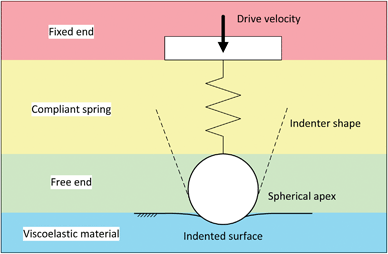 | ||
| Fig. 1 Standard elements present during an indentation measurement. | ||
(i) the fixed end, which is usually a motorised, piezoelectrically, or magnetically controlled displacement stage;
(ii) the compliant element or spring, which is frequently the load measuring element i.e. the AFM cantilever or a force transducer, of each device;
(iii) the free end, which is a probe of specific geometry, is attached at the end of the compliant spring and is the element which makes contact with the surface being indented;
(iv) the viscoelastic material being measured.
In the example case of an AFM, the compliant spring is the cantilever beam and the free end is either a pyramidal tip with a sphericonical apex of radius approximately 10 nm, or a spherical colloid probe of radius in the range 0.5–10 μm. For a nanoindenter the compliant spring is often a ceramic pendulum or some kind of high stiffness element, and the free end is a pyramidal, spherical, or sphericonical diamond-coated probe with dimensions on the micron scale or larger. The compliant spring of a mechanical tester consists of a load cell, which is typically piezoelectric or capacitive in design, whilst the probe is a spherical or hemispherical probe typically of radius greater than 1 mm. For optical tweezers the compliant spring is the effective stiffness of the beam of light used to trap a nanoparticle.34,35
Fig. 2(a) is a scanning electron microscopy image of a rectangular AFM cantilever with attached colloid probe, with the free end, fixed end, and compliant spring elements labelled. Similarly, Fig. 2(b) is a photograph of a mechanical tester with attached spherical indenter, in which the free end and compliant spring elements are labelled; the spring is attached to the main body of the instrument, to which the load cell is attached.
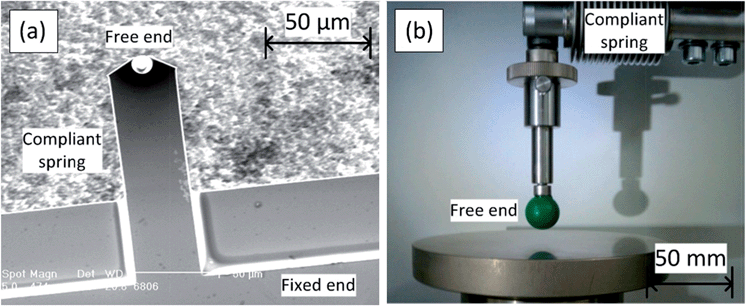 | ||
| Fig. 2 Examples of indentation equipment: (a) AFM cantilever with colloid probe; (b) mechanical tester with spherical indenter. | ||
Calculation of viscoelastic moduli using instruments such as these is normally achieved by fitting a pertinent theory to the measured force and indentation depth data. In the cases where either the force or probe displacement can be controlled directly via feedback control, the classical creep or stress relaxation theories are appropriate. However, it is usually the case that the force is measured directly whilst the displacement is given by the assumed or measured response of the actuator to a specified input. This means the indentation depth is not monitored directly but rather assumed to be equal to the displacement of the fixed end. The inherent compliance of the system results in the indentation depth actually being unknown. This is a source of error in indentation measurements. In a typical mechanical tester for instance, the force transducer, to which the probe is attached, is suspended from the centre of a cross-head bar which is driven via a lead-screw attached to the ends of the bar to which the displacement sensors are attached. The displacement of the probe is therefore assumed to be the same as the cross-head. As the force transducer is compliant, the true displacement of the probe is not recorded.
2.2 Experimental parameters
Typically the measurement length scale, time scale, and material hardness dictate the displacement resolution, force resolution, and indenter geometry required, and therefore the type of instrument used for the indentation of a specific material. This affords the user the opportunity to design an experiment suitable for the measurement of viscoelastic moduli of the indented material. It can be seen in Table 1 that the ranges of variable experimental parameters for the four main types of indentation equipment detailed in Section 2.1 can be over many orders of magnitude. Likewise the viscoelastic properties of typical materials that are commonly tested via indentation as given in Table 2 also vary over a wide range, it should be noted that these have been simplified as ‘real’ materials typically exhibit multiple relaxations and not the single relaxation considered in this table. Typically a Prony series36–39 is required to treat a ‘real’ material and examples include; Lim (2006) for cells40 and Ahearne (2005) for hydrogels.41 It is obvious that not all experimental set-ups will be adequate for the indentation of all materials. For instance glassy polymers are far too stiff to be indented by an accurately measurable amount with optical tweezers and single cells are far too small to be indented sufficiently accurately using a mechanical tester. In order to ascertain which materials can be indented adequately given an experimental set-up the appropriate theory will first be developed in Section 3. Preliminary experiments to indicate approximate parameters are possible via rheology42,43 for hydrogels, elastomers and glassy polymers but are not suitable for cells. Determination of material parameters for cells can be obtained by micro-pipetting.44| Method | Force range (N) | Spring constant (N m−1) | Indenter radius (m) | Drive velocity (m s−1) | Indentation time (s) |
|---|---|---|---|---|---|
| Optical tweezers (OT) | 10−14 to 10−10 | 10−5 to 10−3 | 10−8 to 10−7 | 10−9 to 10−7 | 10−4 to 10−1 |
| Atomic force microscopy (AFM) | 10−11 to 10−6 | 10−2 to 102 | 10−9 to 10−5 | 10−9 to 10−4 | 10−3 to 100 |
| Nanoindenter (NI) | 10−4 to 100 | 104 to 105 | 10−6 to 10−3 | 10−8 to 10−5 | 10−2 to 102 |
| Mechanical tester (MT) | 10−3 to 104 | 105 to 106 | 10−4 to 10−1 | 10−5 to 10−2 | 10−2 to 101 |
| Material | Viscoelastic moduli (MPa) | Viscoelastic relaxation (s) |
|---|---|---|
| Glassy polymer | 103 to 105 | 10−4 to 10−2 |
| Elastomer | 100 to 102 | 10−1 to 101 |
| Hydrogel | 10−3 to 101 | 100 to 102 |
| Cells | 10−3 to 10−1 | 100 to 102 |
3 Theory
In this section a theory will be developed which includes the compliance of the measurement system and allows the optimisation of experimental parameters for the indentation of a given material. For instance, the selection of a suitable AFM cantilever for an indentation measurement requires consideration of the cantilever spring constant, the radius of the spherical indenter at the free end, the indentation velocity into the substrate, and the duration of the indentation process. Similar consideration should be given to indentation measurements performed with any of the instruments discussed in this work.3.1 Assumptions
Following the work of Hertz26 and Lee and Radok,27 the following assumptions are made throughout this paper:• The sphere is rigid in comparison to the viscoelastic material.
• The viscoelastic material presents a flat, planar surface, and can be considered to be an isotropic, semi-infinite half-space.
• The viscoelastic material can be described using a generalised Prony series model.
• The sphere approaches normal to the surface.
• The radius of the sphere is sufficiently large compared to the indentation depth that the probe geometry can be given by the parabolic approximation.
• The contact between the indenter and the viscoelastic material is frictionless.
• There is no adhesion between the indenter and the viscoelastic material.
• The compliant element is a linear spring, described by a single spring constant.
3.2 Problem formulation
Fig. 3 shows the geometry under consideration during the derivation of the model. It can be seen that the four types of indentation equipment idealised in Fig. 1 can all be described by this geometry. With regards to the discussion in Section 2, the system under consideration is the indentation of a linear viscoelastic solid by a rigid sphere, of radius R, attached to the free end of a compliant element, such as a spring or cantilever of spring constant k, and driven by controlling the position of the fixed end. Briefly, the fixed end is driven at constant velocity, V, towards the viscoelastic material for a period of time, γ, after which time the position of the fixed end is held constant.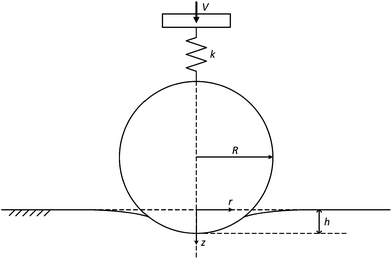 | ||
| Fig. 3 Geometry under consideration for spherical indentation into a viscoelastic material. | ||
Therefore the position, x, of the fixed end takes this form:
 | (1) |
 | (2) |
 | (3) |
 with Poisson's ratio, ν, which has previously been assumed to be 0.5, and ξ is the dummy time variable required for the integration.
3.3 Viscoelastic model
In this paper, it will be assumed that the viscoelastic behaviour of the material being indented is well described by a generalised Prony series model. The generalised Prony model is a phenomenological model represented by a linear combination of springs and dashpots, as shown in Fig. 4. The model can describe both creep and relaxation processes. The springs and dashpots are linear and are described by Hooke's law and Newton's law of fluid flow respectively and can be fully characterised by a constant coefficient. Where ηi is the viscosity of the ith damping component (dashpot) and each of the Gi's are the elastic moduli of the restorative force components (springs).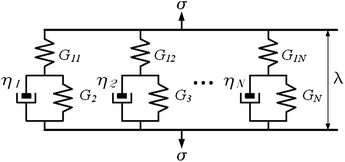 | ||
| Fig. 4 Schematic of standard linear solid model. ηn is the viscosity of the damping component (dashpot), G1n and Gn are the elastic moduli of the restorative force components (springs), α and λ are the stress and strain applied to the element respectively. | ||
The constitutive equation that describes the behaviour of the SLS model is
ηnG1n![[small lambda, Greek, dot above]](https://www.rsc.org/images/entities/i_char_e152.gif) + G1nGn+1λ = (G1n + Gn+1)σ + ηn + G1nGn+1λ = (G1n + Gn+1)σ + ηn![[small sigma, Greek, dot above]](https://www.rsc.org/images/entities/i_char_e156.gif) , n = 1…N , n = 1…N |
 | (4) |
 | (5) |
When there is only one relaxation time τ = τ2. For a two term Prony series the elastic Hertzian case is obtained with the following substitution, G1 = E and G2 → ∞, where E is the shear modulus of the elastic medium, further τ = τr = 0 and the creep modulus is given by, J(t) = 1/E, which is a constant. The viscoelastic Maxwell fluid is obtained by the following substitution, G1 = GM and G2 = 0, where GM is the Maxwell viscoelastic modulus, and the creep modulus is given by, J(t) = 1/GM + t/η.
3.4 Exact solution for final indentation depth
Combining eqn (2)–(4) and integrating by parts, the following non-linear Volterra equations46 of the second kind are derived, | (6) |
 | (6a) |
 | (6b) |
The introduction of an initial indentation depth, h(0), results in an initial preload of F(0) = −kh(0) although this force requires a reference force as only relative forces are measured. Although the initial indentation will be considered in the derivation it will be set to 0 for all results obtained. This preload prior to the start of the experiment is generally unavoidable during real experimentation as it is necessary to first ensure contact with the material. The limit of eqn (6) may be obtained as t → ∞ to obtain the final indentation depth, (h∞), by a direct application of L'hopital's rule.47 In this way the following polynomial is obtained:
| Φ = Ak/(G1(Vγ)1/2) |
| Γ = Φ(1 + μ) |
| Θ = Γ(1 + h(0)/Vγ) |
the final indentation depth is given by,
 | (7) |
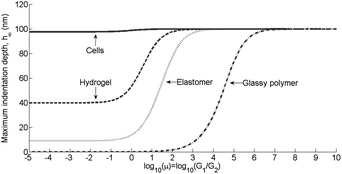 | ||
| Fig. 5 Variations in the maximum indentation depth provided by eqn (7) as G2 is varied for a Prony series with N = 2. Low μ values correspond to the elastic limit and high μ values correspond to the Maxwell limit. The material parameters G1 and τ are given in Table 4 and the system parameters are supplied in Table 5. | ||
3.5 Numerical solution
A numerical procedure has been developed to solve eqn (6) directly, by evaluating the integral using the NAG library algorithm D05BA. Since the NAG routine requires a licence for the NAG library an alternative is provided in the ESI [Section 2],† however greater computational effort is required to obtain satisfactory results.4 Results
Results presented here will focus on a two term Prony series (N = 2) and the deviations for a three term Prony series (N = 3) are discussed. The results and discussions will be split into two sections; the first considers a simple comparison of the asymptotic and numerical models for relatively stiff springs and the second considers the optimal values of the experimental parameters. To assist in the presentation and discussion of results the non-dimensionalisations defined in Table 3 are considered. For the remainder of this paper the preload and hence initial indentation distance is assumed to be 0.| Parameter | Definition |
|---|---|
![[t with combining macron]](https://www.rsc.org/images/entities/i_char_0074_0304.gif)
|
t/τi |
| β i | τ i /γ |
![[h with combining macron]](https://www.rsc.org/images/entities/i_char_0068_0304.gif)
|
h/(Vγ) |
![[k with combining macron]](https://www.rsc.org/images/entities/i_char_006b_0304.gif)
|
k/(VγG1) |
| μ |

|
![[F with combining macron]](https://www.rsc.org/images/entities/i_char_0046_0304.gif)
|
F/((Vγ)2G1) |
| Φ | Ak/(G1(Vγ)1/2) |
| E ∞ | (Vγ)1/2/(Ak(1 + μ)) |
4.1 Comparisons between numerics and asymptotics
Asymptotic results for stiff springs have been derived and may be found in the ESI [Section 1, eqn (1.6); this equation will be referred to as S1.6].†Fig. 6 indicates the relative success of the asymptotic model when compared to the analytic result of eqn (6) as E∞ is varied by changing the values of G1 (100 to 1010 Pa), G2 (100 to 1010 Pa), V (10−5 to 101 m s−1), γ (10−3 to 102 s), R (10−4 to 102 m), and k (10−4 to 106 N m−1), further the value of τ (10−3 to 101 s). The extremes are removed from Fig. 6 to ensure that the most applicable range is considered. The error is obtained by taking the final indentation depth provided by eqn (7) and comparing this with the final indentation depth given by, | (8) |
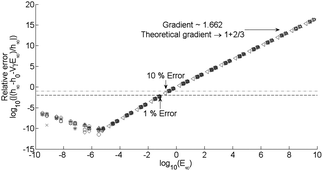 | ||
Fig. 6 Errors of the asymptotic results compared to eqn (6) and (S1.6) in the ESI,†E∞ is varied by varying the values of G1 (100 to 1010 Pa), G2 (100 to 1010 Pa), V (10−5 to 101 m s−1), γ (10−3 to 102 s), R (10−4 to 102 m), k (10−4 to 106 N m−1) and τ (10−3 to 101 s). The dashed (![[dash dash, graph caption]](https://www.rsc.org/images/entities/char_e091.gif) ) and the dot dashed ( ) and the dot dashed (![[dash dot, graph caption]](https://www.rsc.org/images/entities/char_e090.gif) ) lines correspond to an error of 1% and 10% respectively and data below these lines are considered acceptable within that error. ) lines correspond to an error of 1% and 10% respectively and data below these lines are considered acceptable within that error. | ||
The dashed (![[dash dash, graph caption]](https://www.rsc.org/images/entities/char_e091.gif) ) and the dot dashed (
) and the dot dashed (![[dash dot, graph caption]](https://www.rsc.org/images/entities/char_e090.gif) ) lines correspond to an error of 1% and 10% respectively and data below these lines are considered acceptable within that error. Generally the error scales with log10(E∞), and the trend shown in Fig. 6 shows two of the three important features the ideal curves must possess. There is initially a decrease in the error with decreasing E∞ until the asymptotic solution crosses the analytic solution and the error begins to increase again, and finally the error must tend to 0 as E∞ tends to 0. The value of E∞ which corresponds to the (
) lines correspond to an error of 1% and 10% respectively and data below these lines are considered acceptable within that error. Generally the error scales with log10(E∞), and the trend shown in Fig. 6 shows two of the three important features the ideal curves must possess. There is initially a decrease in the error with decreasing E∞ until the asymptotic solution crosses the analytic solution and the error begins to increase again, and finally the error must tend to 0 as E∞ tends to 0. The value of E∞ which corresponds to the (![[dash dash, graph caption]](https://www.rsc.org/images/entities/char_e091.gif) ) line is 0.0846, and for the (
) line is 0.0846, and for the (![[dash dot, graph caption]](https://www.rsc.org/images/entities/char_e090.gif) ) line 0.2808. Below this value the asymptotic method produces an acceptable solution, in this limit the compliance of the spring may be ignored.
) line 0.2808. Below this value the asymptotic method produces an acceptable solution, in this limit the compliance of the spring may be ignored.
As a demonstration of the model developed earlier, using the typical material parameters in Table 4 and the system parameters from Table 5 the following values for E∞ are obtained in each case; cells, 0.1193 (below 10% error), hydrogel, 1.5901 (above 10% error) and elastomers, 6.2114 (above 10% error). Fig. 7 and 8 demonstrate the indentation curves and force curves for the numerical case detailed above with the asymptotic results for the cells included for comparisons, the asymptotic solution for the cells case is also displayed as it is below 10% error for the indentation depth for the final indentation depth (1.30%), the largest error occurs at h(γ) and has a relative error 8.88%.
| Material | G 1 (MPa) | G 2 (MPa) | τ (s) |
|---|---|---|---|
| Glassy polymer | 9 × 10³ | 104 | 10−3 |
| Elastomer | 7 | 101 | 100 |
| Hydrogel | 5 × 10⁻¹ | 100 | 101 |
| Cells | 5 × 10⁻³ | 5 × 10⁻² | 101 |
| Parameter | Symbol | Value |
|---|---|---|
| Radius of sphere | R | 8 μm |
| Spring/cantilever stiffness | k | 1 N m−1 |
| Duration of ramp | γ | 0.1 τ |
| Velocity of fixed end during ramp phase | V | 100 nm s−1 |
| Time step |
![[h with combining macron]](https://www.rsc.org/images/entities/i_char_0068_0304.gif)
|
10−4 s |
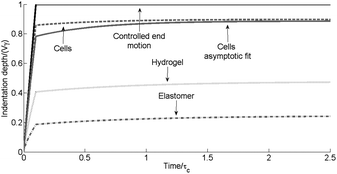 | ||
Fig. 7 Comparison of the indentation depth as a function of time for the various materials, the black solid line (![[thick line, graph caption]](https://www.rsc.org/images/entities/char_e117.gif) ) represents the motion of the fixed end; the cells represented by the dashed line ( ) represents the motion of the fixed end; the cells represented by the dashed line (![[dash dash, graph caption]](https://www.rsc.org/images/entities/char_e091.gif) ) were obtained by the numerical code, the solid grey line ( ) were obtained by the numerical code, the solid grey line (![[thick line, graph caption]](https://www.rsc.org/images/entities/char_e117.gif) ) is the asymptotic fit to eqn (S1.6); the grey dotted line (…) is the hydrogel and the grey dot dashed line ( ) is the asymptotic fit to eqn (S1.6); the grey dotted line (…) is the hydrogel and the grey dot dashed line (![[dash dot, graph caption]](https://www.rsc.org/images/entities/char_e090.gif) ) is the elastomer obtained numerically. ) is the elastomer obtained numerically. | ||
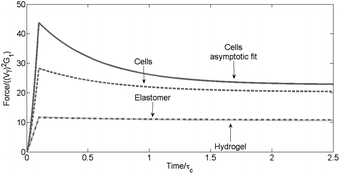 | ||
Fig. 8 Comparison of the indentation force as a function of time for the various materials; the cells represented by the grey dashed line (![[dash dash, graph caption]](https://www.rsc.org/images/entities/char_e091.gif) ) were obtained by the numerical code, the solid grey line ( ) were obtained by the numerical code, the solid grey line (![[thick line, graph caption]](https://www.rsc.org/images/entities/char_e117.gif) ) is the asymptotic fit to eqn (S1.6); the grey dotted line (…) is the hydrogel and the grey dot dashed line ( ) is the asymptotic fit to eqn (S1.6); the grey dotted line (…) is the hydrogel and the grey dot dashed line (![[dash dot, graph caption]](https://www.rsc.org/images/entities/char_e090.gif) ) is the elastomer obtained numerically. ) is the elastomer obtained numerically. | ||
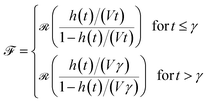
However the error in the force corresponding to this is 54.7% at h(γ) and 11.9% for the final indentation depth, this demonstrates that even if the indentation depth is well predicted a greater relative error in the force is possible. The relative error in the force (![[scr F, script letter F]](https://www.rsc.org/images/entities/char_e141.gif) ) may be determined from the relative error in the indentation depth (
) may be determined from the relative error in the indentation depth (![[scr R, script letter R]](https://www.rsc.org/images/entities/char_e531.gif) ),
),
 | (9) |
5 Discussion
5.1 Optimal experimental parameters
Naturally the experimentalist needs to design the experiment with a view of maximising sensitivity and accuracy. This has to be done without knowing the exact properties of the material being indented a priori. However, sensible decisions can be based on approximate figures for the properties which can be estimated given rheometry (hydrogels, elastomers and glassy polymers) or micro-pipetting (cells). Determination of the ideal parameters for indentation of a viscoelastic material is presented here, however no comparisons may be made with other recommendations as none have been reported. The determination of the optimal spring constant is similar to that proposed by Nikonov48 (2005) for the compression of a viscoelastic cylinder.As an example, E∞ was calculated for the typical hydrogel properties given in Table 4 and system parameters found in Table 5, except the spring stiffness, which is varied and with γ = 0.1 s. The results of this calculation are shown in Fig. 9. As can be seen, a peak value of E∞ is observed and this corresponds to the optimal value E*∞. The peak value, E*∞, may be sought for all parameters, however such a simple parameter can never capture the full complexity of the problem, as it is independent of τ and fails to capture the effects of γ on h(γ). See Section 5.1.2 for further discussion.
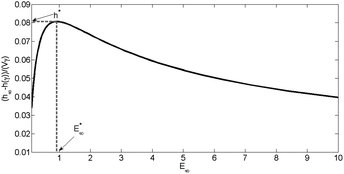 | ||
Fig. 9 Determination of optimality E*∞: for the typical hydrogel properties obtained from Table 4 and the system parameters in Table 5 except γ = 0.1 s and the spring stiffness which is varied. The grey dashed line (![[dash dash, graph caption]](https://www.rsc.org/images/entities/char_e091.gif) ) represents the optimal E*∞ = 0.916 corresponding to a spring stiffness of 0.549 N m−1 and the maximum relative relaxation depth, h* = 0.0807. ) represents the optimal E*∞ = 0.916 corresponding to a spring stiffness of 0.549 N m−1 and the maximum relative relaxation depth, h* = 0.0807. | ||
A further result may be obtained by noting the following condition,
 | (10) |
 | (11) |
Eqn (10) describes the optimal parameters for maximum relative relaxation depth. A significant weakness of eqn (11) is that should γ be varied, h(γ) will vary disproportionately and hence E*∞ and h* will also vary.
The axes in Fig. 10 are,
 | (12) |
 | (13) |
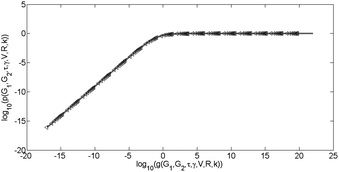 | ||
| Fig. 10 Master curve governing the optimal conditions, the axes are provided by eqn (12)–(15) for a single relaxation, although results are equivalent for Prony series with additional relaxation times. | ||
It has been found that a master curve to indicate optimal parameters is possible and is provided by the following equation,
 | (14) |
 | (15) |
This expression gives the experimentalist the optimum experimental parameters for any material in terms of the remaining parameters. Using this will ensure the relaxation is maximised and ensure that the best possible accuracy is achieved during the indentation experiment. ESI† [Section 4] details the construction of the functional forms found in eqn (14) and (15) for a two term Prony series. For a two term Prony series a natural consequence of this analysis has been the identification of the ideal ramp duration, γ* ≈ τ/8.
5.2 Ideal ramp duration for a three term Prony series
Results and discussions above have focused on a two term Prony series despite the optimisation parameters remaining in a general form. In this section the ideal ramp duration for a three term Prony series is considered.When there are two relaxation elements in the Prony series the determination of the ramp duration is further complicated. For convenience we shall consider the mean frequency and the frequency difference to present results; f = (1/τ1 + 1/τ2)/2 and Δf = (1/τ1 − 1/τ2)/2, where both are greater than or equal to zero, hence Δf can at most equal f and it is assumed that τ1 ≤ τ2. A plot of the optimal ramp duration as a function of the frequency ratio Δf/f is presented in Fig. 11. Eqn (10) will have one maximum value with respect to the ramp duration if Δf = 0 since this corresponds to a single relaxation time, however as the frequency difference increases there is a region where there may be at most three local maxima until the frequencies are sufficiently separated to represent only two local maxima located at the isolated local maxima, however since this happens when Δf/f = 1 this corresponds to a single relaxation time again. Determination of a Prony series requires each modulus to be positive36 and this imposes restrictions on the frequency difference which may be observed. When the moduli are equal the restriction is Δf/f ≥ 9/11 and 9/11 corresponds to the position of the discontinuity in the optimal ramp duration observed in Fig. 11. During small frequency shifts Δf/f < 9/11 at optimality, the mean of the frequency is observed and the material may be well approximated by a single relaxation time at 1/f. For frequency shifts larger than this there is a sudden shift in the position of the optimum and the optimal ramp duration is moved significantly towards the optimal of the isolated larger relaxation time. Further the material requires two relaxation times to be described well until Δf/f is sufficiently close to 1 to prevent detection of the smaller relaxation time.
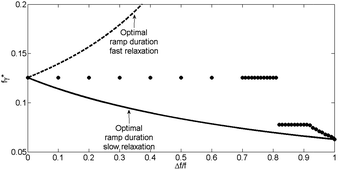 | ||
Fig. 11 Optimal ramp duration as a function of the normalised frequency difference is represented by the solid markers. The solid line represents the optimal ramp duration for the slow relaxation time, τ1. The dashed line (![[dash dash, graph caption]](https://www.rsc.org/images/entities/char_e091.gif) ) represents the optimal time for the fast relaxation, τ2. ) represents the optimal time for the fast relaxation, τ2. | ||
When the conditions for the Prony series to provide positive moduli are not satisfied at a separation of τ1 = 10τ2 (γ* = 9/11), the location of the discontinuous jump occurs at the time separation predicted in Gradowczyk36 (1969), Soussou37 (1970), Park38 (1999) and Park39 (1999). The connection between this approach and that of Gradowczyk36 (1969) is expected since the approach details the minimum theoretical differences in the relaxation times for the determination of different relaxation times.
5.3 Ideal indentation parameters
In Section 5.1 the optimal parameters were determined; however it has been demonstrated that there are an infinite number of optimal parameters for any experimental case. Additional limitations are required to narrow the range of experimental parameters and suggest which experimental method is recommended for given material parameters. There are a host of limitations that prevent accurate indentation measurements. These include low noise to signal ratios, maximum permissible indentation depth and the operating parameter ranges for each of the indentation machines. By combining these limitations, it can be shown that there are well defined regions in the range of the experimental parameters that lead to permissible, i.e. accurate indentation experiments.To deduce the effect of the signal to noise ratio, it is necessary to assume a maximum working indentation depth of hmax. In this case, the maximum velocity for the ramp phase is provided by,
 | (16) |
 | (17) |
The ideal drive velocity to maximise for the relaxation phase is provided by the same maximum drive velocity as the ramp phase, Vmax. The minimum drive velocity required for the relaxation phase to be observable, Vrelaxmin is obtained in a similar manner and is provided by,
 | (18) |
To demonstrate the use of eqn (10) and (11) the maximum indentation depth permissible for an indentation method is required, a simple approximation for this is the limit of Hertz's26 parabolic approximation hmax = 0.1R, although the real maximum is likely to be less than this due to physical limitations of the instrument construction. The maximum noise needs to be estimated for each of the indentation methods and will be taken simply as the following values: AFM/OT, Δh = 0.1 nm, NI Δh = 1 nm and for the MT Δh = 2 μm. This information has been combined to generate Fig. 12a and b and highlight the methods and parameters which are required permissible for determination of viscoelastic parameters for the hydrogel discussed above and in greater detailed in the ESI [Section 5].† The white regions in Fig. 12 may be split into two; above the black line the indentation depth is greater than the maximum permitted by the parabolic approximation, while below the black line the signal to noise ratio is too low and hence is not discernible from the noise, ensuring the indentation is considered not measurable. The permissible region highlighted in grey indicates that for the hydrogel considered and the ramp duration, only AFM can produce optimal indentations. Further the ideal parameters (optimal parameters for the optimal indentation) are obtained from the permissible region with the greatest velocity. The axis on the right corresponds to the logarithm of the spring constant calibrated to be read from the optimal indentation conditions line, to obtain the optimal spring constant at any given point the lines of constant k (![[dash dash, graph caption]](https://www.rsc.org/images/entities/char_e091.gif) ), are used to project the point onto the optimal indentation conditions line and hence may be read from the axis on the right. Fig. 12a does not have the force limits of the method included; the limitations of the radius, velocity and spring constant are included. Fig. 12b is restricted to the case of indentation by AFM, however the force limits are added and in this case the permissible region is diminished as a result. Further in Fig. 12b the (
), are used to project the point onto the optimal indentation conditions line and hence may be read from the axis on the right. Fig. 12a does not have the force limits of the method included; the limitations of the radius, velocity and spring constant are included. Fig. 12b is restricted to the case of indentation by AFM, however the force limits are added and in this case the permissible region is diminished as a result. Further in Fig. 12b the (![[dash dot, graph caption]](https://www.rsc.org/images/entities/char_e090.gif) ) lines are lines of constant force and correspond to the maximum and minimum permissible forces for AFM. The permissible regions are obtained from the intersection of inequality constraints with the following objective function,
) lines are lines of constant force and correspond to the maximum and minimum permissible forces for AFM. The permissible regions are obtained from the intersection of inequality constraints with the following objective function,
| ϕ = Vγh* | (19) |
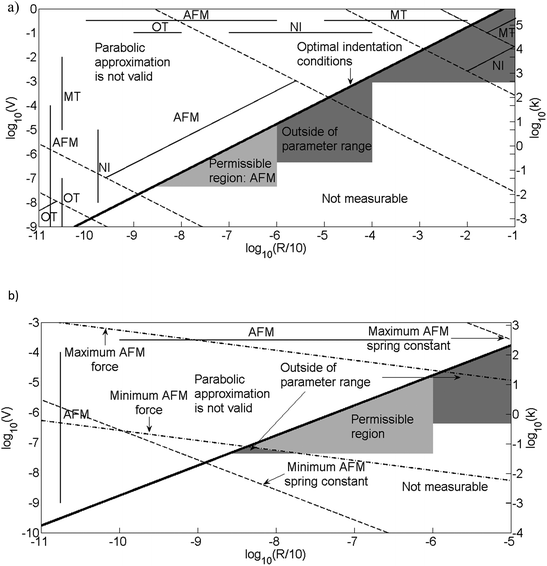 | ||
Fig. 12 The permissible indentation regions for the hydrogel provided in Table 4 and the system parameters in Table 5 except γ = 0.1 s and k* is provided by eqn (11). The white regions are not possible either due to over indentation or due to low signal to noise ratio. The grey represents regions where it is possible to indent and obtain meaningful results. The dark grey regions represent regions where it is not possible to indent as the parameter range of the method is not available. The black line represents the optimal indentation parameters and this corresponds to the maximum permissible indentation. Lines of constant spring constant are indicated by (![[dash dash, graph caption]](https://www.rsc.org/images/entities/char_e091.gif) ) and lines of constant force by ( ) and lines of constant force by (![[dash dot, graph caption]](https://www.rsc.org/images/entities/char_e090.gif) ). (a) The force limits have not been considered in this particular figure. (b) For the AFM case highlighted as permissible, the force limits have been added to indicate the permissible region with the force limits included. AFM: Atomic Force Microscopy, OT: optical tweezers, NI: nanoindentation and MT: mechanical tester. ). (a) The force limits have not been considered in this particular figure. (b) For the AFM case highlighted as permissible, the force limits have been added to indicate the permissible region with the force limits included. AFM: Atomic Force Microscopy, OT: optical tweezers, NI: nanoindentation and MT: mechanical tester. | ||
The set of parameters which satisfy the constraints are highlighted grey in Fig. 12b for the hydrogel example. The particular set of parameters which maximise the objective function are called the ideal parameters and may not be unique, for the hydrogel case in Fig. 12b the ideal parameters are unique (V = 17 μm s−1, R = 10 μm and k = 8 N m−1). Since the constraints imposed by each method, the limits of the velocity, radius, spring constant, force and the signal to noise ratio are not linear it is not possible to directly apply a linear programming optimisation49 to obtain the ideal parameters but this is simply resolved by taking the logarithm of all constraints and the objective function. Refer to the ESI for details [Sections 5 and 6].†
5.4 Sub-optimal indentation
In Section 5.1 the optimal parameters were determined and from these the ideal parameters were determined in Section 5.3; yet it is possible to indent using sub-optimal parameters. However, this may have ramifications for the perceived properties of the material. Fig. 13 indicates for the hydrogel example that varying the spring constant can have a significant effect on the ramp and relaxation phases; but there are more important implications than the magnitude of the indentation depth. When a greater than ideal spring constant is used the parabolic approximation will no longer be valid as the ideal parameters were on the boundary of validity. A smaller spring constant than ideal may have the effect that the relaxation phase may not be distinguishable from the noise in the system. Currently there are no simple approaches other than to run the indentation code discussed earlier to evaluate how far away from optimal the experiment can be before meaningful results are limited. Sub-optimal indentation may also appear elastic when the material is viscoelastic as the relaxation phase may be unperceivable.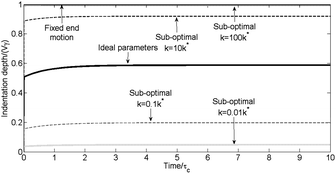 | ||
| Fig. 13 Indentation curves for the hydrogel with a ramp duration of 0.1 s and the following ideal parameters V = 17 μm s−1, R = 10 μm and k* = 8 N m−1, where the spring constant is altered as specified for the sub-optimal cases. | ||
5.5 Implications of the assumptions made in Section 3.1
The assumption of viscoelasticity and negligible adhesion require special attention and are considered separately in the following sections. The implications of the remaining assumptions are discussed here.The sphere is rigid requires that a spherical indenter is available which is effectively rigid compared to the viscoelastic material and it must be attachable for indentation to the method of choice. This assumption is easily satisfied, especially for the materials described in Table 2, as there are many diamond, ceramic, metallic probes and indenters available that are order of magnitudes stiffer than the materials to be tested.
It is assumed that the viscoelastic material presents a flat, planar surface; the viscous nature of the material should always allow this to be achieved given a sufficiently long settling time given appropriate sample preparation, however should the material be curved the reduced radius should be used. Ensuring the sphere approaches normal to the surface is achievable by adequate experimental design. If this assumption is not satisfied a result equivalent to that of Mindlin and Deresiewicz50 is required, but for viscoelastic materials this does not currently exist. The material is assumed to be isotropic; this is a more problematic issue which is related to the assumption that the material undergoes affine deformations. An extension of this theory for viscoelastic fluid behaviour was introduced by Johnson and Segalman51 and is required to consider non-affine deformations. This is another consideration that can be negated with good sample preparation. The viscoelastic material is assumed to be a semi-infinite half-space. In practice this is only ever approximately satisfied as the sample will always have a finite thickness. If the thickness is insufficient, the stress field could interact with the supporting boundary affecting the measured modulus of the material. A rule of thumb is that the material should have a greater thickness than 10 times the maximum indentation depth (h∞).
The parabolic approximation is assumed to be valid when the indentation depth is 0.1R and is based on the assumption used in the original works of Hertz.26 However; techniques exist to extend the analysis beyond this limit.50,52
The contact between the indenter and the viscoelastic material is frictionless, and this will cause the indentation to be greater than for the frictional case; at present the equivalent of the Coulomb friction for viscoelastic materials does not exist.
The indenting object be it a spring, a cantilever, etc. may be treated as a linear spring only under certain conditions, usually under the assumption of small deflections, and these depend strongly on the specific geometry of the compliant element. As such this limit is not pursued here but should be considered for the specific case of interest.
5.6 Implication of assuming viscoelasticity
Assuming the material is well described by a linear viscoelastic material has certain advantages and limitations, these include the ability to fit almost any experimental data with realistic discrete decay modes34 but the physics of the problem could be masked by such a description. However it is noted that the techniques implemented to obtain solutions to the underlying physical descriptions, result in equations which may be represents as an equivalent viscoelastic material. Linear poroelasticity53–59 has been found to describe the behaviour of cells for a limited set of indentation data.60 The generalised Prony series for instance is able to describe the effects of a linear poroelastic indentation; the solution to a one dimensional indentation of a linear poroelastic material produces a well-defined infinite series of exponentials which can be equated to an equivalent linear viscoelastic series, there is then a one-to-one correspondence between coefficients. The equivalent viscoelastic response will then have the usual response of a poroelastic material [ESI, Section 7 and 8†]. This physical approach differs from the fitting of a Prony series36 and has the advantage that the results discussed here may be directly applied to such physical models. Plasticity61,62 which is rarely discussed for soft materials since it is difficult to determine with certainty as the relaxation process may take many months or years;20 plasticity may never be treated by an equivalent linear viscoelastic material. However, the initial response which is considered the duration of the experiment may be well approximated by an infinite series of exponentials and as such can be described over the duration of the experiment by an equivalent linear viscoelastic response. Provided preliminary tests, for instance rheology42,43 can be used to determine parameter values and appropriate theories are implemented to provide the correspondence to an equivalent linear viscoelastic material all of the results obtained here can be applied to any system.5.7 Implication of assuming negligible adhesion
The previous section details how a solution to a physical model may be equated to an equivalent viscoelastic material in the absence of adhesion, here it is noted that when adhesion cannot be neglected an equivalent approach is possible using solutions available in the literature.The assumption of negligible adhesion considered throughout this work is only valid for certain systems and should be verified for each case. The adhesive force depends on the area of contact for a viscoelastic material;56 techniques exist in the literature for determining such dependence on contact area but are usually implemented to detect a poroelastic response.56 Adhesion differs significantly from a poroelastic response as an adhesive instability is observed as the probe approaches a surface, or ‘jump to’63 occurs. Elimination of adhesion is possible under liquid conditions but can rarely be ignored for dry contact,64 indeed this is crucial for fouling and in particular biofouling.65 For small length scales adhesion however small can represent a significant contribution to the net force on the spherical indenter, liquid contact with appropriately selected or modified probes; despite this the indentation of cells have been shown many times to be treated well by neglecting adhesion.4,40,44,60,66–73 Hydrogels typically being stiffer than cells are even less prone to adhesion effects as the length scale is typically larger than for cells and this has been demonstrated many times.41–43,74,75 The general treatment of adhesion in a linear viscoelastic material was considered for monotonic indentation by Hui et al.76 (1998) and has subsequently been extended to include retraction and further indentations.77 An approximation to adhesion in elastomers has been considered for a three element Prony series78 and this solution allows a three element Prony series to be fitted to the data and the effects of adhesion obtained as well as the non-adhesive three element Prony series, this analysis is not limited to elastomers. Hence the results here can be converted into results for adhesive contact once the appropriate conversion of the nth term Prony series has been established.78
6 Conclusions
A model has been developed and implemented to describe the indentation of a rigid indenter driven by a compliant measurement system into a viscoelastic half space. Further an application of a viscoelastic equivalence principle to physical models, including poroelasticity and adhesion, enables the results obtained in this work to be applied to such materials. The elastic Hertzian and Maxwell fluid are recovered as special cases of the standard linear solid model described by a two term Prony series.Optimisation of the indentation parameters for this model over many orders of magnitude of the velocity, viscoelastic moduli, spring stiffness, relaxation times and the duration of indentation results in a characteristic master curve which enables rapid determination of optimal measurement conditions. Analysis of simulated indentation measurements shows that using sub-optimal conditions generates data in which the resolution of the relaxation region is significantly compromised. This gives the appearance of a more elastic material than is actually the case.
For a two term Prony series the ideal ramp duration was found to be ≈τ/8. Also the ideal ramp duration for a three term Prony series was determined. It was observed that during small frequency shifts Δf/f < 9/11 at optimality, the mean of the frequency is observed and the material may be well approximated by a single relaxation time at 1/f. When Δf/f = 9/11 this corresponds to the position of the discontinuity in the optimal ramp duration time. The location of this discontinuity occurs at the same frequency shift observed by Gradowczyk and Moavenzadeh36 (1969) to guarantee distinct relaxation times.
Asymptotic results help to elucidate the behaviour of short duration and/or stiff indentation experiments. The results presented here have implications for researchers using measurement techniques such as atomic force microscopy and optical tweezers.
Acknowledgements
This work was supported by the European Union under the FP7 programme (NANOBIOTOUCH Project: FP7-NMP-228844).Notes and references
- I. Levental, P. C. Georges and P. A. Janmey, Soft Matter, 2007, 3, 299–306 RSC.
- S. T. Choi, S. R. Lee and Y. Y. Earmme, Acta Mater., 2008, 56, 5377–5387 CrossRef CAS.
- Y. F. Dufrene, Nat. Rev. Microbiol., 2008, 6, 674–680 CrossRef CAS.
- S. E. Cross, Y. Jin, J. Rao and J. K. Gimzewski, Nat. Nanotechnol., 2007, 2, 780–783 CrossRef CAS.
- S. E. Cross, Y. Jin, J. Rao and J. K. Gimzewski, Nat. Nanotechnol., 2009, 4, 72 CrossRef CAS.
- M. Lekka and P. Laidler, Nat. Nanotechnol., 2009, 4, 72–73 CrossRef CAS.
- S. C. Hur, N. K. Henderson-MacLennan, E. R. B. McCabe and D. Di Carlo, Lab Chip, 2011, 11, 912–920 RSC.
- B. D. Hoffman, C. Grashoff and M. A. Schwartz, Nature, 2011, 475, 316–323 CrossRef CAS.
- D. Seliktar, Science, 2012, 336, 1124–1128 CrossRef CAS.
- W. H. Roos, R. Bruinsma and G. H. L. Wuite, Nature Phys., 2010, 6, 733–743 CrossRef CAS.
- M. Ahearne, Y. Yang and K.-K. Liu, Topics Tissue Eng., 2008, 4, 1–16 Search PubMed.
- J. P. Gong and W. Hong, Soft Matter, 2012, 8, 8006–8007 RSC.
- Z. I. Kalcioglu, R. Mahmoodian, Y. Hu, Z. Suo and K. J. Van Vliet, Soft Matter, 2012, 8, 3393 RSC.
- J. A. Hinkley, L. D. Morgret and S. H. Gehrke, Polymer, 2004, 45, 8837–8843 CrossRef CAS.
- S. Hering and P. Niemz, Eur. J. Wood Wood Prod., 2012, 70, 667–670 CrossRef.
- G. M. Pharr, Mater. Sci. Eng., A, 1998, 253, 151–159 CrossRef.
- N. Ogbonna, N. A. Fleck and A. C. F. Cocks, Int. J. Mech. Sci., 1995, 37, 1179–1202 CrossRef.
- Y. Hu, J.-O. You, D. T. Auguste, Z. Suo and J. J. Vlassak, J. Mater. Res., 2012, 27, 152–160 CrossRef CAS.
- K. J. Van Vliet, L. Prchlik and J. F. Smith, J. Mater. Res., 2004, 19(1), 325–331 CrossRef CAS.
- M. Galli, K. S. C. Comley, T. A. V. Shean and M. L. Oyen, J. Mater. Res., 2009, 24, 973–979 CrossRef CAS.
- L. Cheng, X. Xia, L. E. Scriven and W. W. Gerberich, Mech. Mater., 2005, 37, 213–226 CrossRef.
- C. A. Tweedie and K. J. Van Vliet, J. Mater. Res., 2006, 21(6), 1576–1589 CrossRef CAS.
- M. Sakai and S. Shimizu, J. Non-Cryst. Solids, 2001, 282, 236–247 CrossRef CAS.
- M. L. Oyen, J. Mater. Res., 2005, 20, 2094–2100 CrossRef CAS.
- G. Moeller, J. Polym. Sci., Part B: Polym. Phys., 2009, 47, 1573–1587 CrossRef CAS.
- H. Hertz, J. Reine Angew. Math., 1882, 92, 156–171 Search PubMed.
- E. H. Lee and J. R. M. Radok, J. Appl. Mech., 1968, 27, 438–444 CrossRef.
- W. H. Yang, J. Appl. Mech., 1966, 33, 395–401 CrossRef.
- T. C. T. Ting, J. Appl. Mech., 1966, 33, 845–854 CrossRef.
- T. C. T. Ting, J. Appl. Mech., 1968, 35, 248–254 CrossRef.
- J. M. Mattice, A. G. Lau, M. L. Oyen and R. W. Kent, J. Mater. Res., 2006, 21, 2003–2010 CrossRef CAS.
- H. Wagner, D. Bedorf, S. Kuchemann, M. Schwabe, B. Zhang, W. Arnold and K. Samwer, Nat. Mater., 2011, 10, 439–442 CrossRef CAS.
- M. V. Flores-Merino, S. Chirasatitsin, C. LoPresti, G. C. Reilly, G. Battaglia and A. J. Engler, Soft Matter, 2010, 6, 4466–4470 RSC.
- T. T. Perkins, Laser Photonics Rev., 2009, 3, 203–220 CrossRef CAS.
- A. E. Moyer, Isis, 1977, 68, 266–275 CAS.
- M. H. Gradowczyk and F. Moavenzadeh, J. Rheol., 1969, 13, 173–191 CrossRef.
- J. E. Soussou, F. Moavenzadeh and M. H. Gradowczyk, J. Rheol., 1970, 14, 573–584 CrossRef CAS.
- S. W. Park and R. A. Schapery, Int. J. Solids Struct., 1999, 36, 1653–1675 CrossRef.
- R. A. Schapery and S. W. Park, Int. J. Solids Struct., 1999, 36, 1677–1699 CrossRef.
- C. T. Lim, E. H. Zhou and S. T. Quek, J. Biomech., 2006, 39(2), 195–216 CrossRef CAS.
- M. Ahearne, Y. Yang, A. J. E. Haj, K. Y. Then and K.-K. Liu, J. R. Soc., Interface, 2005, 2(5), 455–463 CrossRef CAS.
- R. E. Webber and K. Shull, Macromolecules, 2004, 37, 6153–6160 CrossRef CAS.
- K. A. Aamer, H. Srdinha, S. R. Bhatia and G. N. Tew, Biomaterials, 2004, 25, 1087–1093 CrossRef CAS.
- R. M. Hochmuth, J.Biomech., 2000, 33(1), 15–22 CrossRef CAS.
- W. N. Findley, J. S. Lai, and K. Onaran, Creep and Relaxation of Nonlinear Viscoelastic Materials: With an Introduction to Linear Viscoelasticity, Dover Publications, New York, 1989, ch. 5, pp. 62–94 Search PubMed.
- P. Linz, Analytical and Numerical Methods for Volterra Equations, SIAM, 1985, ch. 1, pp. 3–4 Search PubMed.
- N. Bleistein and R. A. Handelsman, Asymptotic Expansions of Integrals, Dover, New York, 2003, ch. 1, p. 17 Search PubMed.
- A. Nikonov, A. R. Davies and I. Emri, J. Rheol., 2005, 49, 1193–1211 CrossRef CAS.
- D. A. Pierre, Optimization Theory with Applications, Dover, New York, 1986, ch. 5, pp. 204–209 Search PubMed.
- R. D. Mindlin and H. Deresiewicz, J. Appl. Mech., 1953, 20, 327–344 Search PubMed.
- M. Johnson and D. Segalman, J. Non-Newtonian Fluid Mech., 1977, 2, 255–270 CrossRef.
- B. D. Hughes and L. R. White, Q. J. Mech. Appl. Math., 1979, 32, 445–471 CrossRef.
- D. C. Lin and F. Horkay, Soft Matter, 2008, 4, 669–682 RSC.
- H. J. Kumpel, Geophys. J. Int., 1991, 105, 783–799 CrossRef.
- J. Wiedemair, M. J. Serpe, J. Kim, J.-F. Masson, L. A. Lyon, B. Mizaikoff and C. Kranz, Langmuir, 2007, 23, 130–137 CrossRef CAS.
- Y. Hu, X. Zhao, J. J. Vlassak and Z. Suo, Appl. Phys. Lett., 2010, 96, 121904 CrossRef.
- S. Cai and Z. Suo, J. Mech. Phys. Solids, 2011, 59, 2259–2278 CrossRef CAS.
- H. T. Nia, L. Han, Y. Li, C. Ortiz and A. Grodzinsky, Biophys. J., 2011, 101, 2304–2313 CrossRef CAS.
- E. H. Zhou, F. D. Martinez and J. J. Fredberg, Nat. Mater., 2013, 12, 184–185 CrossRef CAS.
- E. Moeendarbary, L. Valon, M. Fritzsche, A. R. Harris, D. A. Moulding, A. J. Thrasher, E. Stride, L. Mahadevan and G. T. Charras, Nat. Mater., 2013, 12, 253–261 CrossRef CAS.
- L. Brassart and Z. Suo, J. Mech. Phys. Solids, 2013, 61, 61–77 CrossRef CAS.
- D. Vandembroucq and S. Roux, Phys. Rev. B: Condens. Matter Mater. Phys., 2011, 84(13), 134210 CrossRef.
- J. Bowen and D. Cheneler, Langmuir, 2012, 28, 17273–17286 CrossRef CAS.
- J. Y. Chung and M. K. Chaudhury, J. Adhes., 2005, 81, 1119–1145 CrossRef CAS.
- H. H. Tuson and D. B. Weibel, Soft Matter, 2013, 9, 4368–4380 RSC.
- D. P. Theret, M. J. Levesque, M. Sato, R. M. Nerem and L. T. Wheeler, J. Biomech. Eng., 1988, 110(3), 190–199 CrossRef CAS.
- G. I. Zahalak, W. B. McConnaughey and E. L. Elson, J. Biomech. Eng., 1990, 112(3), 283–294 CrossRef CAS.
- G. W. Schmid-Schonbein, Cell Biophys., 1990, 17(2), 107–135 CAS.
- M. Sato, D. P. Theret, L. T. Wheeler, N. Ohshima and R. M. Nerem, J. Biomech. Eng., 1990, 112(3), 263–268 CrossRef CAS.
- M. A. Tsai and D. A. Hammer, Ann. Biomed. Eng., 1997, 25, 62–68 CrossRef CAS.
- A. R. Bausch, W. Moller and E. Sackmann, Biophys. J., 1999, 76(Pt 1), 573–579 CrossRef CAS.
- H. Haga, S. Sasaki, K. Kawabata, E. Ito, T. Ushiki and T. Sambongi, Ultramicroscopy, 2000, 82, 253–258 CrossRef CAS.
- S. Yamada, D. Wirtz and S. C. Kuo, Biophys. J., 2000, 78(4), 1736–1747 CrossRef CAS.
- T. Iseki, M. Takahashi, H. Hatton, T. Hatakeyama and H. Hatakeyama, Food Hydrocolloids, 2001, 15, 503–506 CrossRef CAS.
- A. Martinez-Ruvalcaba, E. Chornet and D. Rodrigue, Carbohydr. Polym., 2007, 67(4), 586–595 CrossRef CAS.
- C. Y. Hui, J. M. Baney and E. J. Kramer, Langmuir, 1998, 14, 6570–6578 CrossRef CAS.
- G. Haiat, M. C. Phan Huy and E. Barthel, J. Mech. Phys. Solids, 2003, 51, 69–99 CrossRef.
- E. Barthel and C. Fretigny, J. Phys. D: Appl. Phys., 2009, 42, 195302 CrossRef.
Footnote |
| † Electronic supplementary information (ESI) available. See DOI: 10.1039/c3sm50706h |
| This journal is © The Royal Society of Chemistry 2013 |


