Role of compatibilizer in multicomponent polymer mixtures under shear flow†
Ruohai
Guo
,
Jialin
Li
,
Li-Tang
Yan
* and
Xu-Ming
Xie
Advanced Materials Laboratory, Department of Chemical Engineering, Tsinghua University, Beijing 100084, P. R. China. E-mail: ltyan@mail.tsinghua.edu.cn
First published on 17th October 2012
Abstract
We perform computer simulations to investigate the multiscale effects of a compatibilizer on A/B/C ternary blends under shear flow. Our results confirm the phase diagram predicted by spreading coefficients and reproduce the experimental observations on such systems. Study of the orientation of the interfacial and whole polymer chains reveals a new mechanism regarding the difference in the shear rheological behaviors of the uncompatibilized and compatibilized multicomponent polymer systems. We also examine the structure formation mechanism of the compatibilized multicomponent polymer blends and find that the presence of a compatibilizer hinders the dual coalescence process of the encapsulated composite droplets. This indicates a unique approach to stabilize the vesicles upon external stress.
1. Introduction
The control of complex microstructures in multicomponent polymer mixtures is critical to obtain desired material performance.1 Studies focusing on A/B/C ternary polymer systems have reported that the morphologies are determined by an interfacial force equilibrium and can be considered by spreading coefficients.2–4 In a system consisting of two dispersed phases and one matrix there are four possible structures, including separate dispersion, partial encapsulation and two forms of complete encapsulated phase, depending on the relative magnitude of interfacial tensions between the components. In addition, efforts have been made to investigate the control on the values of the spreading parameters and the equilibrium morphologies through the addition of a surfactant or copolymer in the ternary systems.5,6 These investigations open up the potential for a variety of applications, such as the fabrication of ultralow percolation threshold systems7 or monodisperse amphiphilic microparticles.8In experiments and during processing, shear flow conditions are commonly encountered. The response and conformation of polymer chains under shear flow are important to understand the physical origin of the structural and rheological behaviors in multicomponent polymer systems.9,10 Research on A + B + AB blends revealed that the interplay between chain conformations of the AB copolymers and their flow deformations can lead to unique flow effects.11–13 In this case, the localization of the block copolymers at the A–B interface enhances the viscosity of the systems at low shear rates, but at high shears, the deformation of the copolymers reduces the viscosity and results in a strong shear thinning response.
In spite of the huge number of studies devoted to the phase morphologies of the ternary blends and the shear behaviors of the two-phase polymer systems, the phase morphology and rheological behavior of multiphase polymer systems (e.g. A/B/C) under shear flow have been paid scarce attention. One critical aspect of the problem, which has not been studied and could be of great relevance, concerns a definite mechanism of the difference in the shear rheological behaviors of the uncompatibilized and compatibilized ternary polymer systems. In particular, the multiscale effects, covering the response of the chain conformation and mesoscopic phase structures, during the shear process of these more complex polymer systems requires clarification.
In this paper, we provide the first simulation study of the shear behavior of compatibilized A/B/C ternary blends and demonstrate the multiscale effects included in them. The mechanism regarding the difference of the shear rheological behaviors of the uncompatibilized and compatibilized ternary systems are clarified through considering the chain orientations at the interface and in the whole system. The structural formation mechanisms of the blends under shear flow are also investigated by examining the coalescence process of the dispersed droplets within the systems.
2. Methods
The dynamics of the phase separation of ternary immiscible blends are investigated via dissipative particle dynamics (DPD).14–16 In DPD, beads represent clusters of atoms and they interact with each other via pairwise interaction forces, leading to correct long-range hydrodynamics. The time evolution of the DPD beads is governed by Newton's equation of motion dri/dt = vi and mdvi/dt = fi, where ri, vi and fi are, respectively, the position, velocity and force on a bead i. We put the masses of the beads at 1 and used the cutoff radius rc as the unit of length for simplicity. The force on a bead is fi = ∑j(FCij + FDij + FRij), where the sum runs over all beads j within rc around the bead i. The conservative force is given by FCij = aij(1 − rij)![[r with combining circumflex]](https://www.rsc.org/images/entities/b_i_char_0072_0302.gif) , where aij is the repulsion parameter which describes the maximum repulsion between beads i and j; and rij = ri − rj, rij = |rij|,
, where aij is the repulsion parameter which describes the maximum repulsion between beads i and j; and rij = ri − rj, rij = |rij|, ![[r with combining circumflex]](https://www.rsc.org/images/entities/b_i_char_0072_0302.gif) = rij/|rij|. The dissipative force is FDij = −γwD(rij)(
= rij/|rij|. The dissipative force is FDij = −γwD(rij)(![[r with combining circumflex]](https://www.rsc.org/images/entities/b_i_char_0072_0302.gif) ij·vij)
ij·vij)![[r with combining circumflex]](https://www.rsc.org/images/entities/b_i_char_0072_0302.gif) ij and the random force is FRij = σwR(rij)ξij
ij and the random force is FRij = σwR(rij)ξij![[r with combining circumflex]](https://www.rsc.org/images/entities/b_i_char_0072_0302.gif) ij, where vij = vi − vj and ξij is a Gaussian random variable with zero mean and unit variance. The weight functions wD(rij) and wR(rij) are coupled together to form a thermostat. In summary, wD(rij) = [wR(rij)]2 and σ2 = 2γkBT, here, kB is the Boltzmann constant, and T is the temperature of the system. In our simulations, we chose wD(rij) = [wR(rij)]2 = (1 − r)2, ρ = 3.0, kBT = 1 and σ = 3 due to Groot and Warren.14 The equations of motion are integrated using a modified velocity–Verlet algorithm where the time step Δt = 0.04τ with τ = (mr2c/kBT)1/2. The size of our computational system is 64 × 64 × 64, which is large enough to avoid the finite size effects. We study a ternary blend of A/B/C at a composition of 80/10/10, the homopolymers A, B and C chains have equal lengths and consist of 10 beads connected by a harmonic spring. The spring force is FSi = ∑jCrij where C = 4 is the spring constant. The compatibilizer is a grafted copolymer which has a backbone containing 10 beads of A and four branches containing 1 bead of B or C distributed in the backbone uniformly. Two compatibilizers denoted respectively by A–g–B and A–g–C are used in the simulations. The repulsion parameter aij is chosen according to the linear relation with Flory–Huggins χ parameters for the polymer aij ≈ aij + 3.27χij.14 Experimentally, χ is widely used to determine the phase diagram of the polymer blends.17 Thereby, this parameter is particularly useful to relate the thermodynamic properties of the DPD simulation and the experimental systems. The interfacial tensions among A, B and C homopolymers are then measured in binary fluids based on the pressure tensor.18,19
ij, where vij = vi − vj and ξij is a Gaussian random variable with zero mean and unit variance. The weight functions wD(rij) and wR(rij) are coupled together to form a thermostat. In summary, wD(rij) = [wR(rij)]2 and σ2 = 2γkBT, here, kB is the Boltzmann constant, and T is the temperature of the system. In our simulations, we chose wD(rij) = [wR(rij)]2 = (1 − r)2, ρ = 3.0, kBT = 1 and σ = 3 due to Groot and Warren.14 The equations of motion are integrated using a modified velocity–Verlet algorithm where the time step Δt = 0.04τ with τ = (mr2c/kBT)1/2. The size of our computational system is 64 × 64 × 64, which is large enough to avoid the finite size effects. We study a ternary blend of A/B/C at a composition of 80/10/10, the homopolymers A, B and C chains have equal lengths and consist of 10 beads connected by a harmonic spring. The spring force is FSi = ∑jCrij where C = 4 is the spring constant. The compatibilizer is a grafted copolymer which has a backbone containing 10 beads of A and four branches containing 1 bead of B or C distributed in the backbone uniformly. Two compatibilizers denoted respectively by A–g–B and A–g–C are used in the simulations. The repulsion parameter aij is chosen according to the linear relation with Flory–Huggins χ parameters for the polymer aij ≈ aij + 3.27χij.14 Experimentally, χ is widely used to determine the phase diagram of the polymer blends.17 Thereby, this parameter is particularly useful to relate the thermodynamic properties of the DPD simulation and the experimental systems. The interfacial tensions among A, B and C homopolymers are then measured in binary fluids based on the pressure tensor.18,19
3. Results and discussion
Fig. 1 shows the comparison of the equilibrium simulation morphologies with the prediction of spreading coefficients. The snapshots of the points marked by the letters within the brackets can be found in Fig. 2. The simulations run at varying γAB and γAC while γBC is fixed at 2.68. Here the γ values are the interfacial tensions between the different phases. According to the theory, the morphologies can be described using three spreading coefficients, λABC, λACB and λBAC, defined by, for example, λABC = γAC − γAB − γBC. The spreading coefficients provide the tendency of one phase to spread at the interface of the other two, for example, when λABC > 0, phase B wets the A–C interface completely while it cannot wet this interface when λABC < 0.2,3Fig. 1 presents the phase diagram, divided into four regions, obtained on the basis of spreading coefficients. Clearly, the simulation results are in good agreement with the theoretical prediction. Our simulations are also consistent with the simulations of emulsion systems.21,22 These results confirm the validity and accuracy of the spreading coefficient theory in multicomponent polymer mixtures with hydrodynamic interactions since a tiny distinction of interfacial tensions at the two sides of the phase boundary can lead to an entirely different morphology, as indicated in Fig. 1.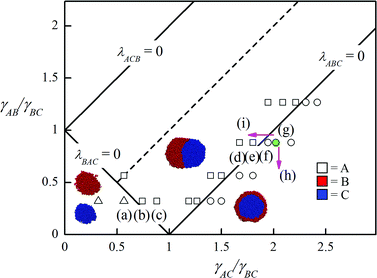 | ||
| Fig. 1 Phase diagram of ternary blends composed of one major phase and two minor phases showing isolated dispersion (△), partial encapsulation (□) and encapsulated morphology (○). The solid lines represent the phase boundaries predicted by the spreading coefficients and the phase diagram is symmetrical along the dashed line. In all simulations γBC is fixed at 2.68. The letters within the brackets correspond to the phase morphologies shown by the snapshots of Fig. 2. The pink arrows denote the transition of phase morphology from (g) after adding different types of compatibilizers to the system. | ||
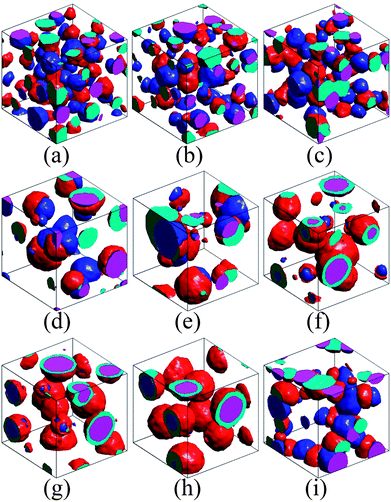 | ||
| Fig. 2 The simulated morphologies of ternary blends without and with compatibilizer. All of the corresponding state points are presented in Fig. 1 (marked by the corresponding letters within brackets). (a) Isolated dispersion, (b–e) partial encapsulation, (f, g) encapsulated morphology. Encapsulated morphology (h) and partial encapsulation morphology (i) formed after adding the compatibilizer of A–g–B and A–g–C to the system of (g), respectively. | ||
In fact, the interfacial tension γ has a tight relation to the Flory–Huggins interaction parameter of two phases, χ. Fig. 3(a) presents γ as a function of χ obtained through systematic simulations for the A/B polymer blends. χ can be easily determined in the experimental systems17 and in the DPD simulation,14 which provide an effective approach to relate the simulated morphologies to the real ternary polymer blends with various interfacial interactions. Fig. 3(b) shows the change of the interfacial tension with the increase of the composition of compatibilizer. Clearly, increasing compatibilizer can significantly reduce the interfacial tension. What is more interesting is that this effect is different for the A/B blends with different compatibilities, i.e., χ between A and B phases. The plots in Fig. 3(b) reveal that the surface tension of the A/B blend with a stronger incompatibility (or large χ) presents a more extreme decrease after adding the same amount of compatibilizer. This is particularly useful for the corresponding experimental designs.
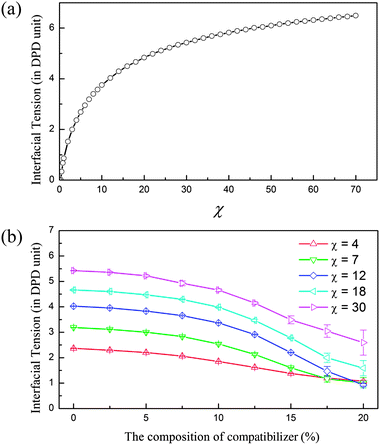 | ||
| Fig. 3 Determining interfacial tension from the Flory–Huggins parameters χ of two phases. (a) Interfacial tension γ as a function of the Flory–Huggins parameter χ for incompatible A/B blends. (b) The dependence of interfacial tension on the composition of compatibilizer in the A/B blends with different compatibilities (χ). | ||
We further compare the simulation and theoretical results with the experiments after adding the compatibilizer into the ternary systems. Fig. 2 (g–i) and S1 in the ESI† show the representative morphologies from simulations and experiments of polypropylene/polystyrene/polyamide 6 (PP/PS/PA6),20 where the interaction parameters of simulations between homopolymers are chosen as γAB = 2.37, γAC = 5.43 and γBC = 2.68, corresponding to the experimental system.23 This state point is marked by the green point in the phase diagram of Fig. 1. At this point (λABC > 0), phase B completely wets phase C, leading to the formation of encapsulated morphology. When the compatibilizer of A–g–C is induced into this system, the interfacial tension γAC is reduced, as indicated by the top pink arrow in Fig. 1. The phase point thereby moves towards the left side and crosses the phase boundary (λABC = 0), resulting in a partial encapsulation morphology (see Fig. 2(i)). On the other hand, the encapsulated phase remains in response to the addition of the compatibilizer of A–g–B (see Fig. 2(h)), because in this case the phase point moves downwards with the decrease of γAB, as indicated by the bottom pink arrow in Fig. 1. The images of Fig.S1† demonstrate that the experiments of the ternary system, PP/PS/PA6 with grafted compatibilizer, reproduce these behaviors very well. The agreement of simulations, theory and experiments indicates that the effects of the compatibilizer on the ternary polymer systems can be analyzed quantitatively by the phase diagram of spreading coefficients. Furthermore, DPD simulation, which can be extended to the polymer systems with four or more phases beyond the spreading coefficient theory, provides an accurate insight into the morphologies of the complex polymer systems.
Next we turn to the shear behavior of uncompatibilized and compatibilized ternary polymer systems. For this purpose, the Lees–Edwards boundary condition is applied to these systems where the flow profile is u = ix![[small gamma, Greek, dot above]](https://www.rsc.org/images/entities/i_char_e0a2.gif) ry.24 Here ry is the position of particle i along the y axis and
ry.24 Here ry is the position of particle i along the y axis and ![[small gamma, Greek, dot above]](https://www.rsc.org/images/entities/i_char_e0a2.gif) is the velocity profile with
is the velocity profile with ![[small gamma, Greek, dot above]](https://www.rsc.org/images/entities/i_char_e0a2.gif) = ∂vx/∂ry. The flow direction is parallel to the x axis, the y axis refers to the velocity gradient, and the z axis represents the transverse direction. The systems are equilibrated over 105 time steps before starting the non-equilibrium simulations.
= ∂vx/∂ry. The flow direction is parallel to the x axis, the y axis refers to the velocity gradient, and the z axis represents the transverse direction. The systems are equilibrated over 105 time steps before starting the non-equilibrium simulations.
Fig. 4 presents the simulation results comparing the shear viscosities of A/B/C ternary blends to those of blends with compatibilizer A–g–B in response to various shear rates. Obviously, the shear viscosity of both systems decreases with increasing shear rate, demonstrating the typical shear thinning behavior of polymer systems. However, Fig. 4 indicates that the compatibilized ternary blends present larger shear viscosity and stronger shear thinning. To understand the difference of the shear rheological behaviors with and without compatibilizer, the mesoscale phase morphologies of the polymer systems are firstly examined. The insets of Fig. 4 display the typical morphologies of the ternary systems with and without compatibilizer. At the lower shear rate (![[small gamma, Greek, dot above]](https://www.rsc.org/images/entities/i_char_e0a2.gif) = 0.002), the droplets of the dispersed phase move along the flow direction while their shapes remain spherical. Upon increasing the shear rate, the encapsulated morphology becomes elliptical with elongation along the shear direction (
= 0.002), the droplets of the dispersed phase move along the flow direction while their shapes remain spherical. Upon increasing the shear rate, the encapsulated morphology becomes elliptical with elongation along the shear direction (![[small gamma, Greek, dot above]](https://www.rsc.org/images/entities/i_char_e0a2.gif) = 0.01). At a higher shear rate (
= 0.01). At a higher shear rate (![[small gamma, Greek, dot above]](https://www.rsc.org/images/entities/i_char_e0a2.gif) = 0.02), further deformation of the shell phase in the encapsulated structure leads to the connection of neighboring droplets. It is noticed that in this case the core of the phase structure still remains spherical although its shell undergoes a great deformation. With further increasing shear rate, the core also deforms along the shear direction, inducing the formation of the completely cylindrical core–shell structure (
= 0.02), further deformation of the shell phase in the encapsulated structure leads to the connection of neighboring droplets. It is noticed that in this case the core of the phase structure still remains spherical although its shell undergoes a great deformation. With further increasing shear rate, the core also deforms along the shear direction, inducing the formation of the completely cylindrical core–shell structure (![[small gamma, Greek, dot above]](https://www.rsc.org/images/entities/i_char_e0a2.gif) = 0.05). In particular, the insets demonstrate that there is not an evident difference in the mesoscale phase morphologies of the systems with and without compatibilizer. Thereby the mechanism regarding the difference of the shear rheological behaviors of these both systems needs more detailed insight.
= 0.05). In particular, the insets demonstrate that there is not an evident difference in the mesoscale phase morphologies of the systems with and without compatibilizer. Thereby the mechanism regarding the difference of the shear rheological behaviors of these both systems needs more detailed insight.
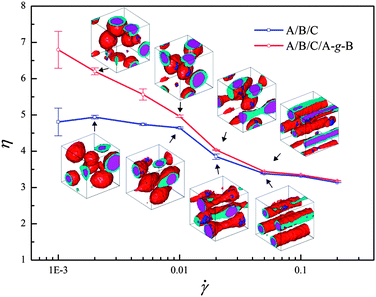 | ||
Fig. 4 Shear viscosities for the uncompatibilized and compatibilized ternary blends as a function of shear rate ![[small gamma, Greek, dot above]](https://www.rsc.org/images/entities/i_char_e0a2.gif) . The insets show the phase morphologies under four typical shear ( . The insets show the phase morphologies under four typical shear (![[small gamma, Greek, dot above]](https://www.rsc.org/images/entities/i_char_e0a2.gif) = 0.002, 0.01, 0.02, 0.05) for the two systems. = 0.002, 0.01, 0.02, 0.05) for the two systems. | ||
To delineate this mechanism, the deformation of the polymer chains along the shear direction is characterized by measuring the order parameter S, which is defined by the largest eigenvalue of Saupe tensor  . Here uiα is the α component of the unit vector along the chain bonds and δαβ is the Kronecker delta. S is zero for the complete random-coil chain and unity for the polymer in the ordered alignment state. Fig. 5 shows S as a function of the shear rate for both these systems, where the chain deformations of the whole polymer chains and the chains at the A–B interface are identified respectively for each component. Clearly, the deformation of the whole polymer chains of each component is almost unchangeable with and without compatibilizer, in agreement with the mesoscale phase morphology demonstrated by the insets of Fig. 4. However, great changes take place in the polymer chains at the interface. We note that the orientation degree of the interfacial polymer chains is evidently stronger than that of the whole polymer chains in the system without compatibilizer (Fig. 5(a)). To understand the effect of the compatibilizer on the orientation of the interfacial polymer chains, Fig. 6(a) and (b) display the detailed interfacial structures of the uncompatibilized and compatibilized systems respectively. The deformation of the bulk polymer chains is limited by the attraction and entanglement with its neighboring chains of the same component. At the interface, these limitations are considerably reduced due to the extra repulsion exerted by the incompatible heterogeneous chains, as demonstrated in Fig. 6(a). Thereby the interfacial polymer chains are easier to deform under the shear flow. The presence of the compatibilizer at the interface however reduces the repulsive interaction. Also, the entanglement between the polymer chains and their preferential part of the compatibilizer enhances the suppression for the orientation of the interfacial polymers, as demonstrated in Fig. 6(b). In this case, the orientation degree of the interfacial polymer chains decreases and tends to approximate the orientation degree of the whole polymer chains, as shown in Fig. 5(b). In principle, viscosity originates from the resistance of a fluid that is being deformed by an external stress.25 The compatibilizer at the interface provides additional “internal friction”, which is partly contributed by the additional entanglement between the compatibilizer and the interfacial polymer chains and is partly contributed by the attraction between the interfacial polymers and their preferential part of the compatibilizer, for the chain deformation in response to the shear flow and consequently increases the viscosity of the system. Thus the mechanism regarding the difference of the shear rheological behaviors of the uncompatibilized and compatibilized ternary systems can be rationalized through the difference of the orientation degrees of the interfacial and the whole polymer chains influenced by the compatibilizer.
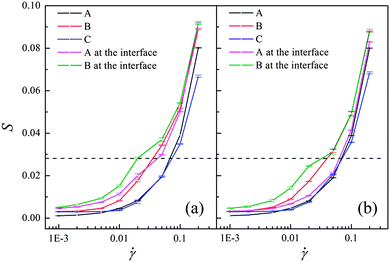 | ||
| Fig. 5 Shear-rate dependence of order parameters of all homopolymer chains (A, B, C) and chains at the A–B interface for (a) an uncompatibilized system; (b) a compatibilized system. The dashed line is to guide the eye. | ||
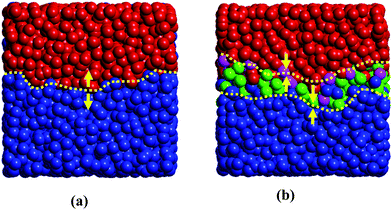 | ||
| Fig. 6 Simulated interfacial structures of uncompatibilized and compatibilized systems. The snapshots show the local A–B interfaces taken from the corresponding systems. The yellow dashed line in (a) indicates the uncompatibilized A–B interface while the yellow dashed lines in (b) mark a more rough interfacial region containing the compatibilizer. The yellow arrows denote the interaction direction between neighboring molecules at the interface. Color scheme: phase A (blue), phase B (red), part A of the compatibilizer (green) and part B of the compatibilizer (pink). | ||
At a low shear rate, the orientation of the polymer chains becomes obvious and the effect of the compatibilizer is extreme. Thereby there is a large difference between the viscosities of the systems with and without compatibilizer at a low shear rate. However, at a high shear rate, the polymer chains exerted by the shear effect are almost fully oriented along the shear flow, when the effect of the compatibilizer becomes trivial. In this case, the difference between the viscosities of the systems with and without compatibilizer is very small, as demonstrated in Fig. 4.
The structural formation mechanisms of the ternary systems with and without compatibilizer are also studied by examining the coalescence process of two neighboring encapsulated droplets. Fig. 7(a) and (b) present the processes in both these systems respectively, where the droplets with almost equivalent sizes are chosen. Fig. 7(a) shows that the composite droplets display a dual coalescence process, first between composite droplets themselves, i.e., composite droplet particles contact with each other and shell–shell coalescence takes place, then a shell phase layer forms between the two cores. Second, the shell phase layer ruptures in the middle of the contact zone to form a hemifusion state. This state is unstable and eventually opens a pore to complete the coalescence process. The structural formation process is in good agreement with the experimental observation of high-density polyethylene/polystyrene/poly(methyl methacrylate) ternary systems.26Fig. 7(b) indicates that a similar coalescence process occurs in the compatibilized system. However, in this system, the compatibilizers in the two droplets contact firstly and form a channel connecting the droplets. Then the shells of the composite droplets merge in the channel and the dual coalescence proceeds subsequently.
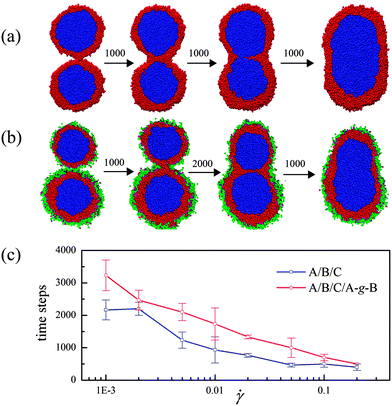 | ||
| Fig. 7 (a) Coalescence of composite droplets of uncompatibilized ternary blends. The approximate evolution time steps are shown between graphics. (b) The same process for compatibilized ternary blends. (c) Coalescence time decrease with increasing shear rate for original and compatibilized systems. The time is defined as the interval from the shell phase touch to the core phase contact. | ||
What is interesting is that the presence of the compatibilizer increases the coalescence time significantly by comparing Fig. 7(a) and (b). We further consider the coalescence time of the droplets in the uncompatibilized and compatibilized systems under the shear flow. Fig. 7(c) shows the coalescence time as a function of the shear rate for both these systems. Clearly, the coalescence process is evidently suppressed by the compatibilizer. This reveals that the compatibilizer can enhance the stability of the encapsulated droplets. We notice that the coalescence process shown in Fig. 7(a) and (b) is very similar to the fusion process of two vesicles.27 In fact, the shear-deformation behavior and even the rupture of vesicles are vital in the development of new nanocarriers and targeted drug delivery systems.28–30 Our research thereby indicates a unique approach to stabilize the vesicle structures and to control the fusion between vesicles during their transportation by decorating appropriate ligands on them.
4. Conclusions
In summary, we present the first simulation study of the effect of compatibilizer on the phase morphology and rheological behavior of the A/B/C ternary blends under shear flow. The simulated phase morphologies match with the experimental observations and are consistent with the prediction of the spreading coefficient theory. Our research then focuses on the role of the compatibilizer in the structure formation and rheological properties of these multicomponent polymer systems under shear flow. The study of chain conformation and orientation under shear flow reveals that the mechanism regarding the difference of the shear rheological behaviors of the uncompatibilized and compatibilized ternary systems can be rationalized through the difference of the orientation degrees of the interfacial and the whole polymer chains influenced by the compatibilizer. This provides a new insight into the mechanism of the shear induced phase transition kinetics and rheological behaviors of the multicomponent polymer blends. Moreover, our simulations demonstrate that the compatibilizers can significantly suppress the coalescence between two neighboring droplets and enhance the stability of the encapsulated droplets. This indicates a unique approach to stabilize the vesicle structures upon external stress by decorating appropriate ligands on them.Acknowledgements
The financial support from the National Natural Science Foundation of China (no. 21174080 and 51273105) is greatly appreciated.References
- A. van Blaaderen, Nature, 2006, 439, 545–546 CrossRef CAS.
- S. Torza and S. G. Mason, J. Colloid Interface Sci., 1970, 33, 67–83 CrossRef CAS.
- S. Y. Hobbs, M. E. J. Dekkers and V. H. Watkins, Polymer, 1988, 29, 1598–1602 CrossRef CAS.
- N. Virgilio, P. Desjardins, G. L'Esperance and B. D. Favis, Macromolecules, 2009, 42, 7518–7529 CrossRef CAS.
- E. Jo, S. W. Lee, K. T. Kim, Y. S. Won, H. S. Kim, E. C. Cho and U. Jeong, Adv. Mater., 2009, 21, 968–972 CrossRef CAS.
- N. Virgilio and B. D. Favis, Macromolecules, 2011, 44, 5850–5856 CrossRef CAS.
- J. H. Zhang, S. Ravati, N. Virgilio and B. D. Favis, Macromolecules, 2007, 40, 8817–8820 Search PubMed.
- S.-H. Kim, A. Abbaspourrad and D. A. Weitz, J. Am. Chem. Soc., 2011, 133, 5516–5524 CrossRef CAS.
- P. E. Boukany, O. Hemminger, S.-Q. Wang and L. J. Lee, Phys. Rev. Lett., 2010, 105, 027802 CrossRef.
- J. D. Halverson, G. S. Grest, A. Y. Grosberg and K. Kremer, Phys. Rev. Lett., 2012, 108, 038301 CrossRef.
- K. Krishnan, K. Almdal, W. R. Burghardt, T. P. Lodge and F. S. Bates, Phys. Rev. Lett., 2001, 87, 098301 Search PubMed.
- B. Narayanan, V. Pryamitsyn and V. Ganesan, Phys. Rev. Lett., 2006, 96, 028302 Search PubMed.
- C. C. Han, Y. Yao, R. Zhang and E. K. Hobbie, Polymer, 2006, 47, 3271–3286 Search PubMed.
- R. D. Groot and P. B. Warren, J. Chem. Phys., 1997, 107, 4423–4435 CrossRef CAS.
- C. Junghans, M. Praprotnik and K. Kremer, Soft Matter, 2008, 4, 156–161 RSC.
- M. Laradji and M. J. A. Hore, J. Chem. Phys., 2008, 128, 054901 CrossRef.
- A. K. Khandpur, S. Föster, F. S. Bates, I. W. Hamley, A. J. Ryan, W. Bras, K. Almdal and K. Mortensen, Macromolecules, 1995, 28, 8796–8806 CrossRef CAS.
- J. H. Irving and J. G. Kirkwood, J. Chem. Phys., 1950, 18, 817–829 CrossRef CAS.
- H. J. Qian, Z. Y. Lu, L. J. Chen, Z. S. Li and C. C. Sun, J. Chem. Phys., 2005, 122, 184907 Search PubMed.
- D. Wang, Y. Li, X. M. Xie and B. H. Guo, Polymer, 2011, 52, 191–200 Search PubMed.
- Y. Duda and F. Vazquez, Langmuir, 2005, 21, 1096–1102 CrossRef CAS.
- Y. Reyes and J. M. Asua, J. Polym. Sci., Part A: Polym. Chem., 2010, 48, 2579–2583 Search PubMed.
- T. S. Omonov, C. Harrats and G. Groeninckx, Polymer, 2005, 46, 12322–12336 Search PubMed.
- A. W. Lees and S. F. Edwsards, J. Phys. C: Solid State Phys., 1972, 5, 1921–1929 CrossRef.
- K. R. Symon, Mechanics, Addison-Wesley, Massachusetts, 3rd edn, 1971 Search PubMed.
- J. Reignier and B. D. Favis, Macromolecules, 2000, 33, 6998–7008 Search PubMed.
- L. H. Gao, R. Lipowsky and J. Shillcock, Soft Matter, 2008, 4, 1208–1214 RSC.
- A. Alexeev and A. C. Balazs, Soft Matter, 2007, 3, 1500–1505 RSC.
- M. Abkarian and A. Viallat, Soft Matter, 2008, 4, 653–657 RSC.
- A. Pommella, S. Caserta, V. Guida and S. Guido, Phys. Rev. Lett., 2012, 108, 138301 Search PubMed.
Footnote |
| † Electronic supplementary information (ESI) available: Additional simulation and experimental results. See DOI: 10.1039/c2sm26342d |
| This journal is © The Royal Society of Chemistry 2013 |
